Many surveys contain questions of the following type:
How did you find out about MAXQDA? (Multiple answers possible)
▢ Conference
▢ Colleagues
▢ Web search
▢ Other
Usually, a separate variable is created for each answer option, that is, in this example there are four variables, each indicating whether the respondent has ticked the answer option or not. The individual variables can be evaluated using the Stats function Descriptive Statistics > Frequencies, but it is usually better to analyze the questions as a whole and display them in a diagram.
To do this, you must first “tell” MAXQDA Stats which answers belong together by defining multiple response sets.
Defining Multiple Response Sets
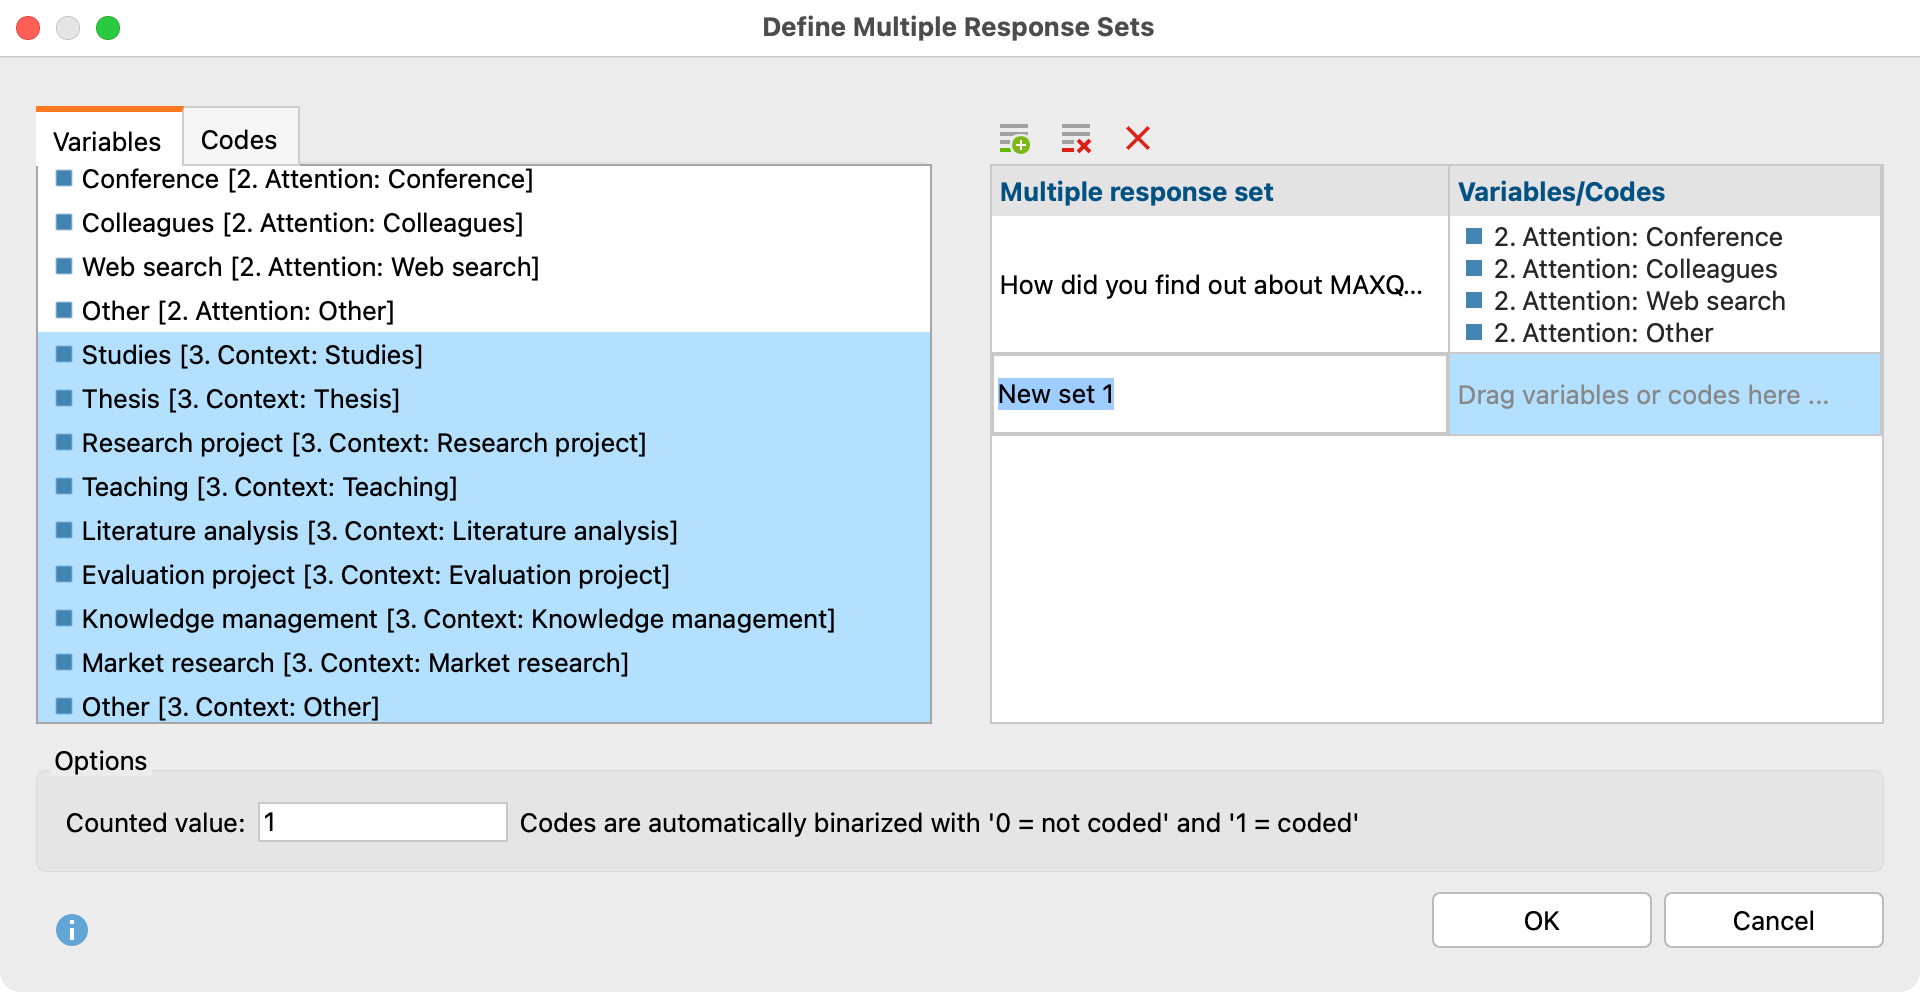
- Call Descriptive Statistics > Define Multiple Response Sets.
- Click the icon with the green plus sign to create a new set.
- Assign a name for the set in the "Multiple response set" column.
- Drag all the variables belonging to the set into the row with the mouse.
- At the bottom, enter the value that should be counted for each variable, i.e. the value that indicates whether a check mark has been set for a question. In most cases, this is the value “1”, “True”, or “Yes”. Please note that the value applies to all created sets.

If you are working with data from a MAXQDA project, the sets will be saved in the project and you can also create a set that consists of codes rather than variables (variables and codes cannot be mixed).
If you work with external data, for example, from SPSS, you can also create multiple response sets, but these are not saved and are only available while the file is open.
Create Frequency Tables
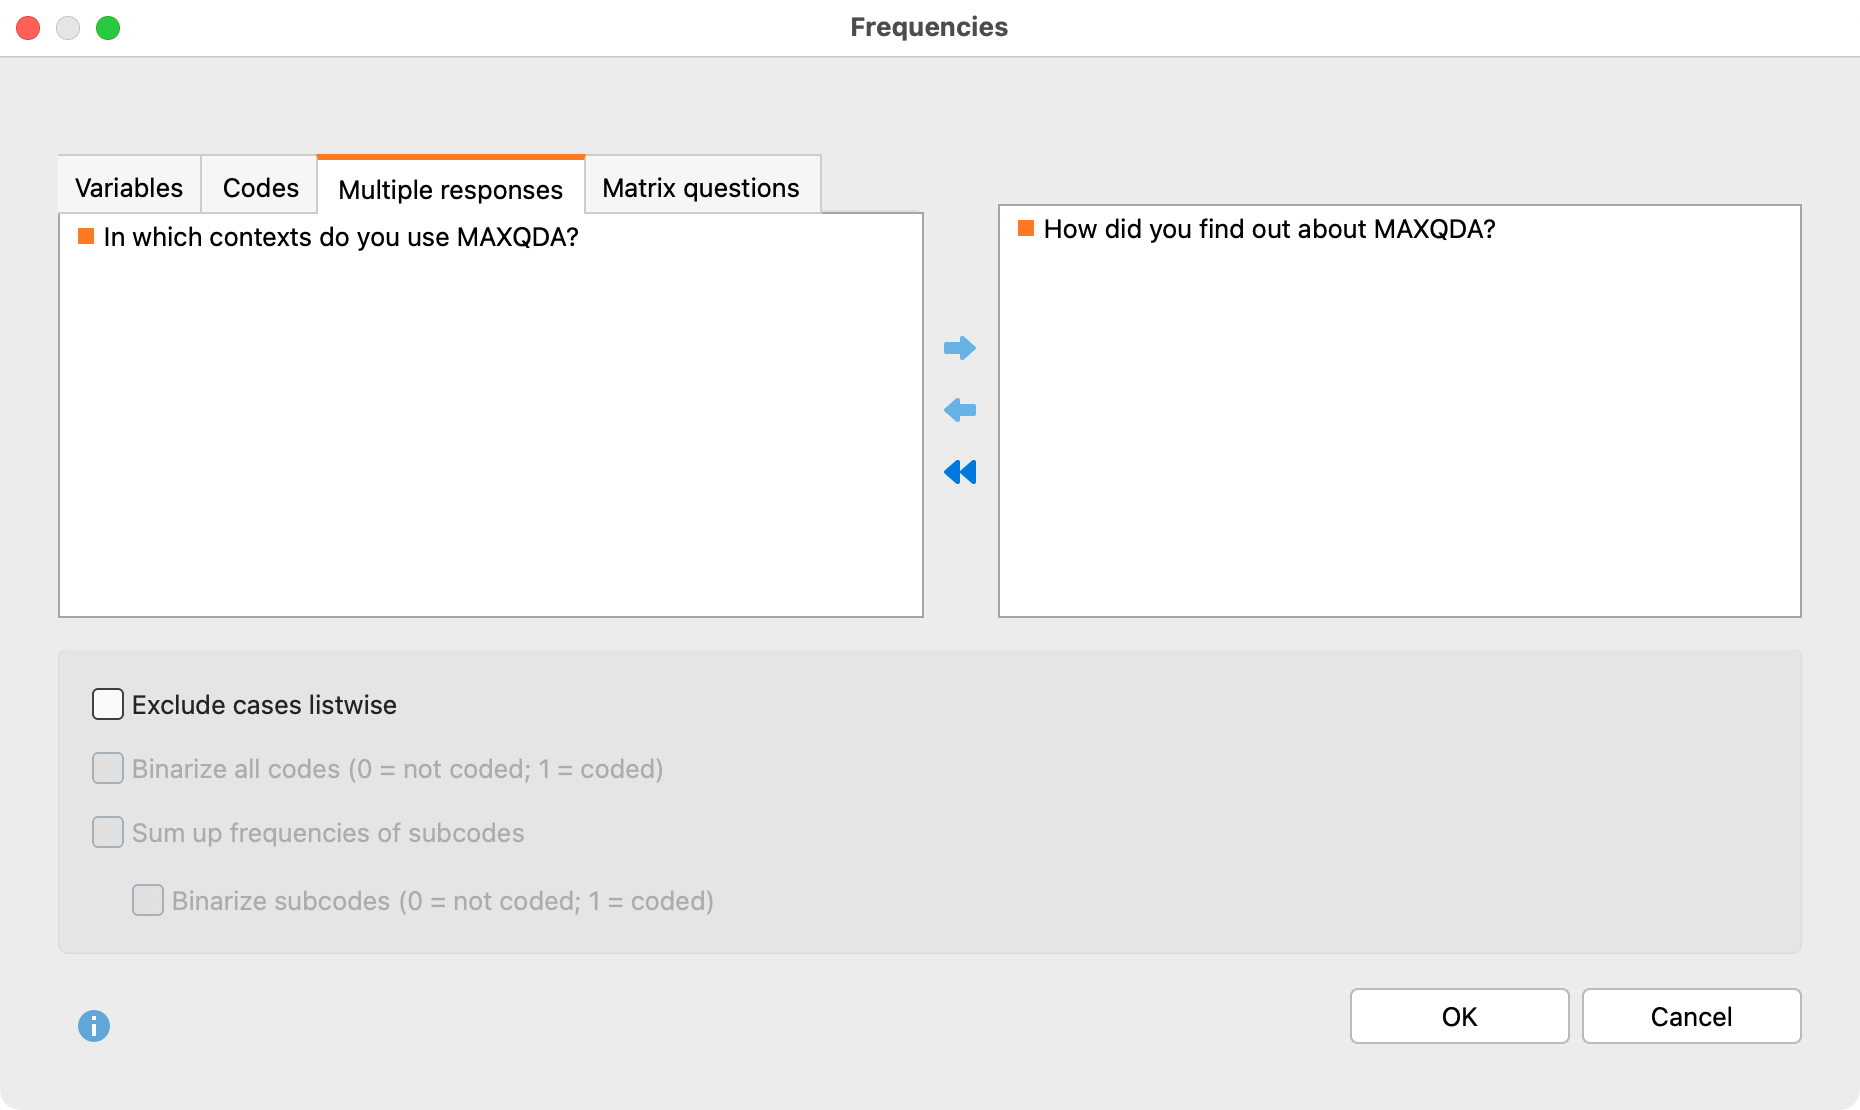
Once you have created a multiple response set, you can request a frequency analysis for them via Descriptive Statistics > Frequencies. In the options dialog, the sets are available on a separate tab and can be selected for analysis:

The Exclude cases listwise option ensures that only cases are analyzed that have a valid value for all analyzed variables (from all selected sets).
The results table has the following structure:
| Frequency | Percent responses | Percent cases |
Conference | 57 | 32,4 | 63,3 |
Colleagues | 49 | 27,8 | 54,4 |
Web search | 64 | 36,4 | 71,1 |
Other | 6 | 3,4 | 6,7 |
TOTAL | 176 | 100,0 | 195,6 |
TOTAL CASES | 90 |
|
|
MISSING CASES | 1 |
|
|
Three numbers are presented for each answer (that is, each variable in the set):
- Frequency – How many times the answer was selected (number of counted value in variable).
- Percent Responses – Frequency relative to all analyzed responses
- Percent Cases – Frequency relative to cases
As in frequency tables for single variables or codes, several rows with responses can be selected and combined by right-clicking; the filter function for the Data Editor and saving the documents as a document set are also available by right-clicking (see sections “Combining values” and “Saving documents as a document set” in the chapter Frequency Tables).
However, individual rows cannot be deleted.
By clicking on the diagram symbol, the answers can be displayed as a horizontal or vertical bar chart. The percentages of the cases are visualized.
Create crosstabs
Once you have created multiple response sets, you can request a breakdown by variable or code for them via Compare Groups > Crosstabs. In the options dialog, the sets are available on their own tab and can be selected for display in the rows.
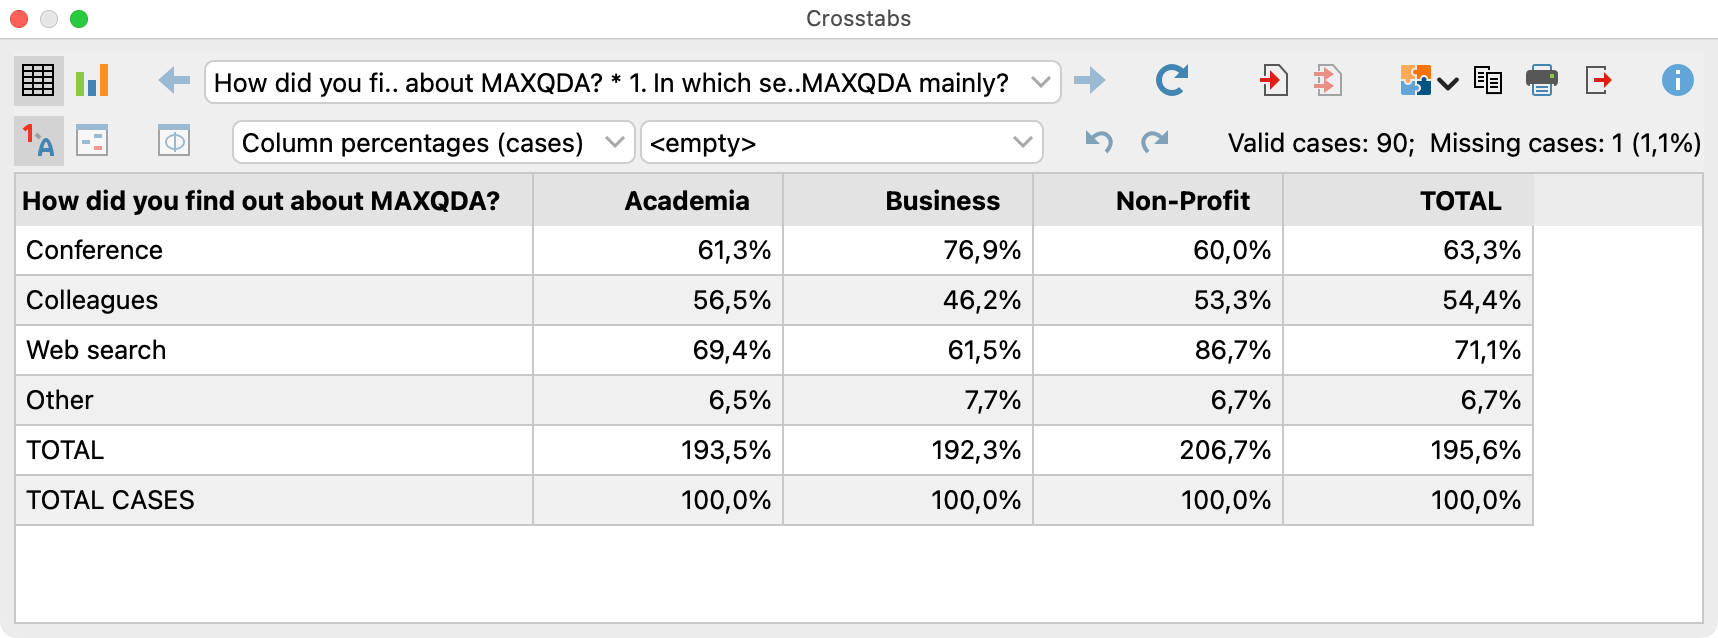
The crosstab looks like this:

In the two drop-down menus, you can select which values to show in the table.
For the grouped bar chart, which can be called up by switching to the chart view, the “Column percentages (cases)” are used.
Find out more about working with crosstabs.
