In order to conduct a t-test or U-test for independent samples with MAXQDA Stats, select Compare Groups > t-Test for Independent Samples or Compare Groups > Mann-Whitney U-Test for Independent Samples in the main menu. A window will appear which will allow you to select several dependent variables, as well as one comparison factor for the two groups.

Variables can be selected in several ways:
- Double-click on a variable.
- Drag and drop the variable into the right window pane.
- Select one or multiple variables with the mouse by holding the Ctrl/Cmd key then dragging the selection into the right window pane with the mouse, or click the blue arrow in the middle of the window.
To integrate code frequencies per document as dependent variables or as a factor, switch to the “Codes” tab and select the desired codes. (This option is available only if MAXQDA Stats was launched with the data in the MAXQDA project).
Once you have selected a variable or code for defining the groups, you can select a value for defining the groups in each of the Group 1 and Group 2 drop-down menus.
In order to integrate only those cases that contain variables with a valid value select Exclude cases listwise.
After starting the calculation by clicking OK a t-test or U-test is performed for each selected dependent variable.
Results table of the t-test
For the t-test, the following results table appears for the first dependent variable. By using the blue arrows and the drop-down list at the top of the window, you can switch to the results for the other dependent variables.

The results table contains the following information:
- The number of valid and missing cases for each calculated test is shown in the upper right corner.
- The first row shows the results for the assumption of homogeneous variances in the two groups. The second row contains the results assuming heterogeneous variances (Welch correction).
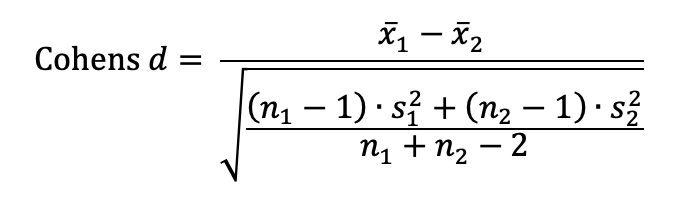
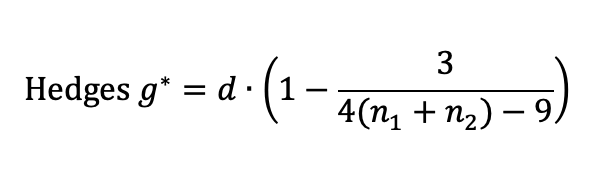
- The effect sizes Cohen’s d and Hedge’s g* help to assess the size of the difference in means.
- Levene’s test, the results of which are presented in the middle panel, can be used to assess the variance homogeneity of the two groups.
- In the lower area, the number of cases (N) as well as the mean, standard deviation, and standard error are displayed separately for both groups.
- Shapiro-Wilk value and the corresponding p-values can be used to check the assumption of a normal distribution in the individual groups.
Hedges g* applies an additional correction to Cohens d:
Results table of the U-test
For the U-test, the following results table appears for the first dependent variable. Using the blue arrows and the drop-down list at the top of the window, you can switch to the results for the other dependent variables.

In the upper area of the results table, descriptive statistics are presented separately for the two groups, in addition to the number of cases, the median and the mean.
In the lower area, the calculated p-values are displayed.
https://www.alglib.net/hypothesistesting/mannwhitneyu.php
Overview of toolbar functions
The toolbar in the upper section of the results window offers important functions:
![]() Table view/Chart view – switches between the result table and scatter plots.
Table view/Chart view – switches between the result table and scatter plots.
![]() Previous/Next – using the blue arrow or the selection list, switch between the results table for the dependent variables.
Previous/Next – using the blue arrow or the selection list, switch between the results table for the dependent variables.
![]() Refresh – recalls the dialog for selection of variables for the correlation table.
Refresh – recalls the dialog for selection of variables for the correlation table.
![]() Insert into output viewer – inserts the currently displayed table or chart in the Output Viewer.
Insert into output viewer – inserts the currently displayed table or chart in the Output Viewer.
![]() Insert all into output viewer – inserts all created tables or charts in the Output Viewer.
Insert all into output viewer – inserts all created tables or charts in the Output Viewer.
![]() Send to QTT worksheet - inserts the current view into a new or an existing QTT worksheet.
Send to QTT worksheet - inserts the current view into a new or an existing QTT worksheet.
![]() Copy – copies the current table, highlighted area in the table, or chart, for example for insertion into Word.
Copy – copies the current table, highlighted area in the table, or chart, for example for insertion into Word.
![]() Print – prints the currently displayed table or chart.
Print – prints the currently displayed table or chart.
![]() Export – exports the currently displayed table in Excel format, website (HTML) format or RTF format for Word and other word processing programs; exports the currently displayed chart in PNG, SVG or EMF (only Windows) format.
Export – exports the currently displayed table in Excel format, website (HTML) format or RTF format for Word and other word processing programs; exports the currently displayed chart in PNG, SVG or EMF (only Windows) format.
Transfer results table to the Output Viewer
After the tables have been created, they can be transferred to the Output Viewer from which they can later be exported together:
- Click the Insert into output viewer
 icon to transfer the currently displayed results table to the Output Viewer.
 - Click the Insert all result tables into output viewer icon to transfer all created tables to the Output Viewer at once.

Transfer results to Questions – Themes – Theories
In the Questions – Themes – Theories window, you can collect and comment on all the important results of your project. Click the ![]() Send to QTT Worksheet icon in the upper right corner to save the current view in a new or existing worksheet.
Send to QTT Worksheet icon in the upper right corner to save the current view in a new or existing worksheet.
Export and print results table
Several options for exporting and printing the currently displayed results table are available using the following symbols:
![]() Copy – copies the entire table or selection to the clipboard, for example in order to paste it directly into Word.
Copy – copies the entire table or selection to the clipboard, for example in order to paste it directly into Word.
![]() Print – starts the print process and displays a print preview, in which the settings such as margins, orientation, headers and footers can be applied.
Print – starts the print process and displays a print preview, in which the settings such as margins, orientation, headers and footers can be applied.
![]() Export – exports the table in Excel format, website (HTML) format or RTF format for Word and other word processing programs.
Export – exports the table in Excel format, website (HTML) format or RTF format for Word and other word processing programs.
Display means/medians as chart
In order to display a chart of the means or medians of the compared groups click the icon ![]() Chart view in the results table.
Chart view in the results table.

You can customize the design and view of the chart by using the icons in the toolbar above the chart as well as double-clicking and right-clicking the elements of the chart. The chart’s size automatically adjusts to the window size. Enlarge the window in order to receive a larger chart.
The charts can be transferred to the Output Viewer for storage and later export, or they can be transferred to a QTT worksheet. To do this, click on the corresponding icons in the top right corner of the toolbar:
![]() Insert into Output Viewer and
Insert into Output Viewer and ![]() Send to QTT Worksheet.
Send to QTT Worksheet.
To export or print a chart directly, you can use the usual icons in the top right of the window:
![]() Copy,
Copy, ![]() Print and
Print and ![]() Export.
Export.