In order to create a new crosstab select Compare Groups > Crosstabs in the main menu of MAXQDA Stats. A window appears that allows you to determine rows and columns for the crosstab.

Variables can be selected in several ways:
- Double-click on a variable.
- Drag and drop the variable into the right window pane.
- Select one or multiple variables with the mouse by holding the Ctrl/Cmd key then drag the selection into the right window pane with the mouse, or click the blue arrow in the middle of the window.
To integrate code frequencies per document in the crosstab, switch to the “Codes” tab and select the desired codes. (This option is available only if MAXQDA Stats was launched with the data of a MAXQDA project).
In the lower section of the window, the following options are available:
Exclude cases listwise – Select this option to include only cases for which all selected variables have a valid value.
Binarize column/row code (only available if at least one code has been selected in the corresponding field) – All code frequencies greater than 1 are set to 1, i.e. the code frequency per document is not evaluated, but only whether a code occurs in a document or not.
Sum up frequencies of subcodes (only available if at least one code has been selected in the corresponding field) – For parent codes, the frequencies of all subcodes available in the Stats dialogue are added to the code frequency. If the option Binarize subcodes is also selected, the summation only takes into account whether the code was assigned to a document (the frequency of a subcode is set to “1”) or not (the frequency of a subcode is set to “0”). When combining both options, the sum of the subcodes indicates how many subcodes were coded for a document.<-/p>
Results table
After starting the calculation by clicking OK a crosstab will be computed for each combination of rows and columns variables/codes. The figure above shows a selection for which four crosstabs will be created. A results table then appears that allows you to switch between the single crosstabs by using the blue arrows and the drop-down menu at the top of the window.
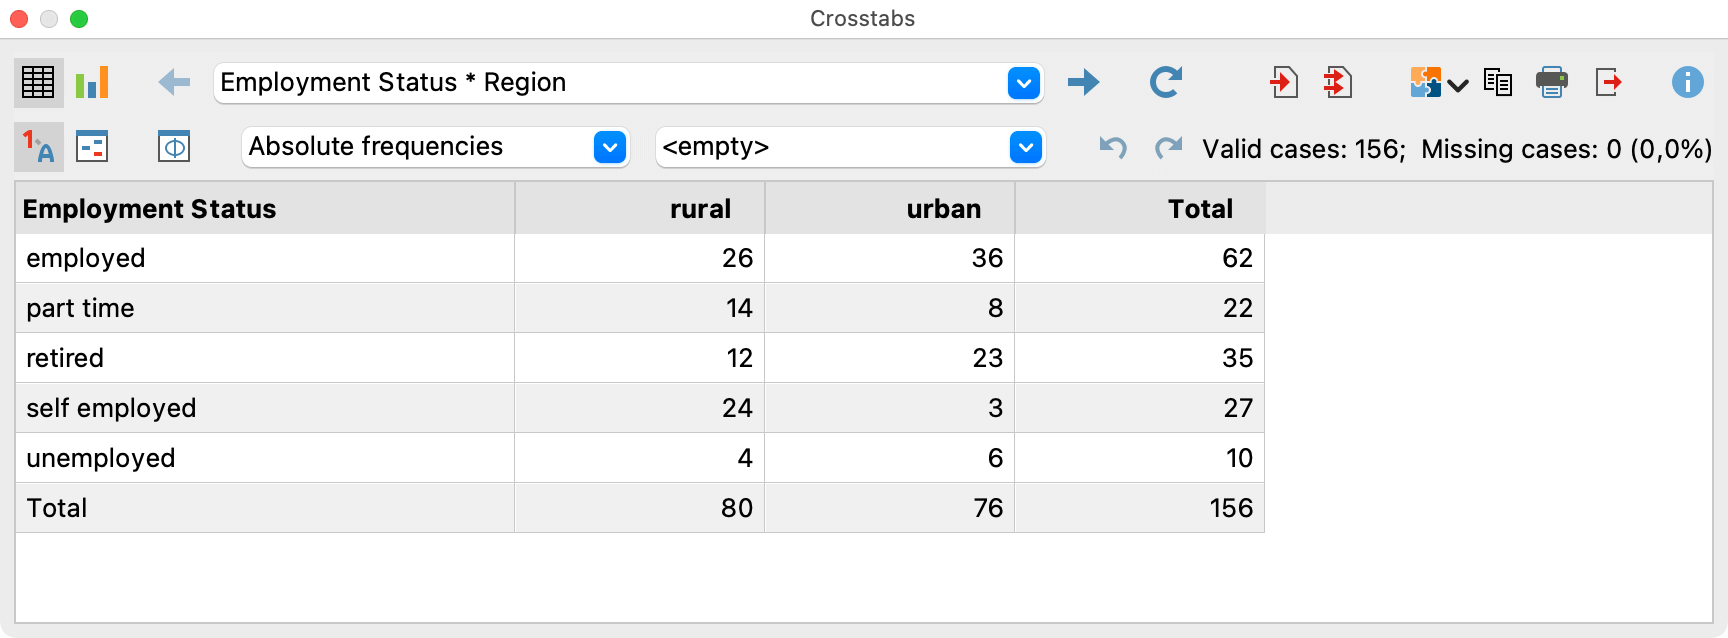
The number of valid and missing values for the displayed variable combination is shown in the upper right corner.
Selecting displayed values
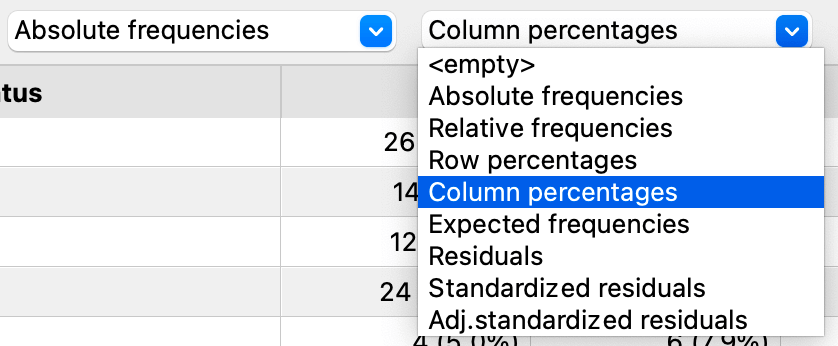
If you start the function “crosstabs” the numbers in the cells display the absolute frequencies, thus the number of cases for each combination of variable values. You can switch the display for the cells to the following values:
- Relative frequencies – percentage based on all valid values
- Row percentage – percentage based on the sum of a row
- Column percentages – percentage based on the sum of a column
- Expected frequencies – expected frequencies in case of independence of both variables
- Residuals – differences between observed absolute frequencies and the expected. In case of positive residuals more cases occurred than would be expected considering the marginal distributions.
Standardized residuals – in order to gain a better comparability the residuals are divided by the root of the expected frequencies. The standardized residuals’ magnitude corresponds to the root of the particular cell’s Chi-square.
Corrected standardized residuals – the standardized residuals are adjusted on the basis of the marginal frequencies.
The cells of the crosstab display either one or two of the presented values. Use the drop-down menu on the top of the chart to select the values you want to display.
Highlighting cells with high standardized residuals
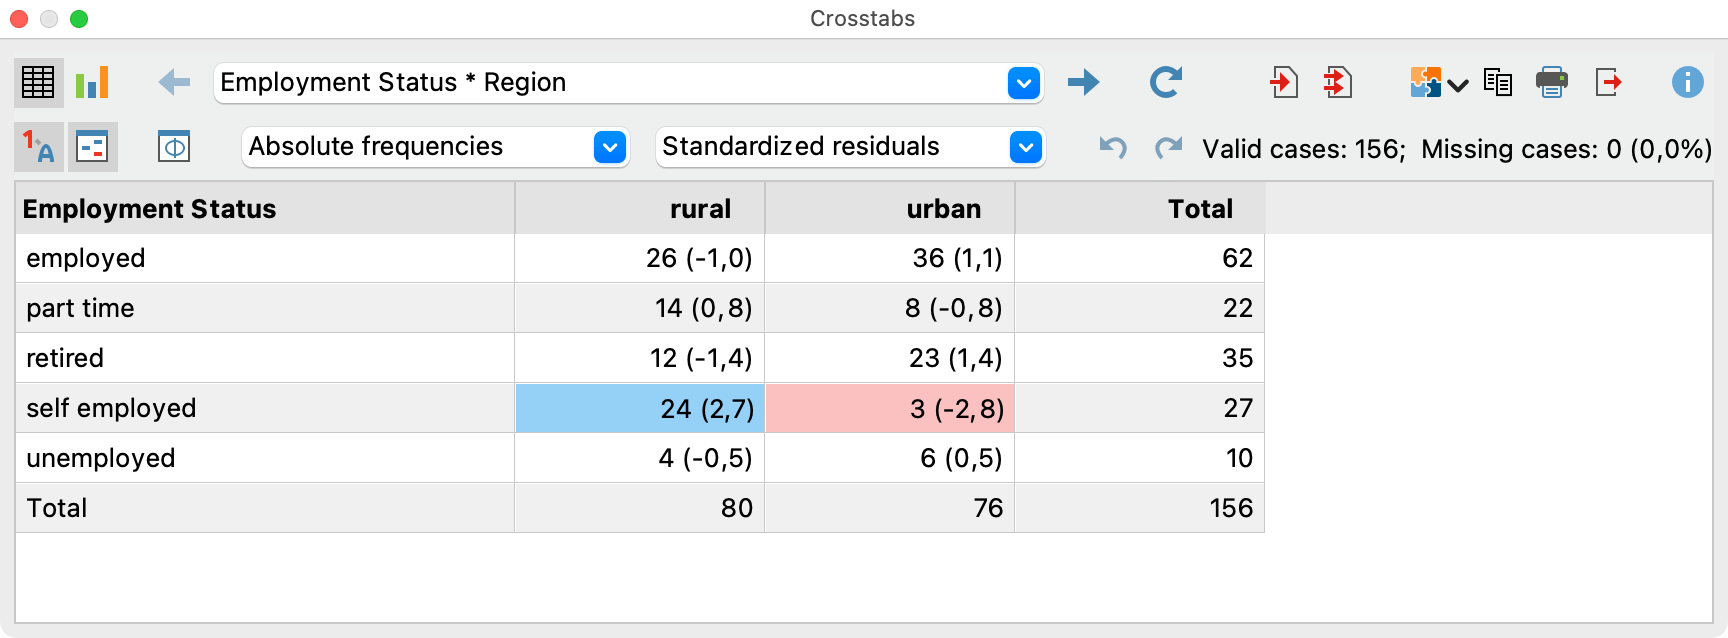
You can use standardized residuals for the exploratory interpretation of the table. This is possible because based on the assumption of the independency of the two tabulated variables the standardized residuals are asymptotically normally distributed. Accordingly, a standardized residual greater than 2 or less than -2 indicates an unexpected high or low number of observations in the cell. Values that exceed the magnitude of 2.6 are even less expected.
Click on the icon Highlight cells with high standardized residuals ![]() . Now MAXQDA Stats highlights all cells with a standardized residual greater than 2 in blue and all cells with values smaller than 2 in red. If there are values whose magnitude is greater than 2.6 the cells are additionally displayed in a darker colour.
. Now MAXQDA Stats highlights all cells with a standardized residual greater than 2 in blue and all cells with values smaller than 2 in red. If there are values whose magnitude is greater than 2.6 the cells are additionally displayed in a darker colour.
Overview of toolbar functions
In the upper section of the results window two toolbars are located, which contain the following important functions:
![]() Previous/Next – using the blue arrow or the selection list, switch between the created crosstabs table.
Previous/Next – using the blue arrow or the selection list, switch between the created crosstabs table.
![]() Refresh – Recalls the dialog window for creation of crosstabs.
Refresh – Recalls the dialog window for creation of crosstabs.
![]() Insert into output viewer – inserts the currently displayed table in the Output Viewer.
Insert into output viewer – inserts the currently displayed table in the Output Viewer.
![]() Insert all into output viewer – inserts all created tables in the Output Viewer.
Insert all into output viewer – inserts all created tables in the Output Viewer.
![]() Send to QTT Worksheet
Send to QTT Worksheet
![]() Copy – copies the current table or the highlighted area in the table, for example for insertion into Word.
Copy – copies the current table or the highlighted area in the table, for example for insertion into Word.
![]() Print – prints the currently displayed table.
Print – prints the currently displayed table.
![]() Export – exports the currently displayed table in Excel format, website (HTML) format or RTF format for Word and other word processing programs; exports the currently displayed chart in PNG, SVG or EMF (only Windows) format.
Export – exports the currently displayed table in Excel format, website (HTML) format or RTF format for Word and other word processing programs; exports the currently displayed chart in PNG, SVG or EMF (only Windows) format.
![]() Show value labels – this option is selected by default and causes the defined value label of a variable to be displayed in the place of the value of the variable.
Show value labels – this option is selected by default and causes the defined value label of a variable to be displayed in the place of the value of the variable.
![]() Highlight cells with high standardized residuals – switch on this option to highlight cells, whose magnitudes of standardized residuals are greater than 2 for easy interpretation of the results.
Highlight cells with high standardized residuals – switch on this option to highlight cells, whose magnitudes of standardized residuals are greater than 2 for easy interpretation of the results.
![]() Association measures – opens a window with association measures for the two variables displayed in the actual crosstab.
Association measures – opens a window with association measures for the two variables displayed in the actual crosstab.
![]() Undo changes – step-by-step resetting of changes to a table (deletion of rows, merging and moving of rows).
Undo changes – step-by-step resetting of changes to a table (deletion of rows, merging and moving of rows).
![]() Redo – step-by-step restoring of changes to a table.
Redo – step-by-step restoring of changes to a table.
Sort tables and customize columns
Tables can be sorted by clicking a column header, in ascending order with the first click and descending order with the second. Clicking again will restore the original order.
Column widths can be adjusted with the mouse, and their positions can be changed by clicking the column header then dragging them to the desired location with the mouse.
Delete rows or columns
The results table is interactive and one or more rows can be removed, for example to restrict the evaluation to selected variables. Right-click a row and select Delete. You can also select multiple rows to delete by holding down the Ctrl/cmd key.
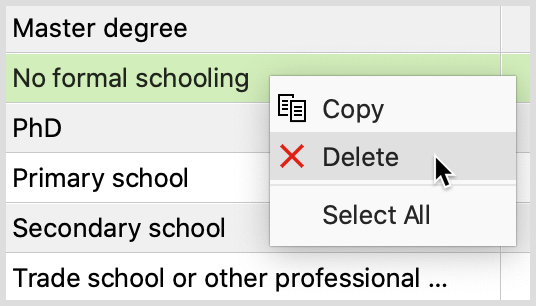
To delete a column from the results table, right click on its heading and select Delete.
The table will be automatically updated after deletion of rows or columns.
Merge values
The interactive results table also allows you to merge multiple values:
- Highlight at least two rows by holding down the Ctrl/cmd key as you click on the desired rows with the mouse.
- Right-click the selection and select Merge values.
In the following example, the two values “married” and “partner” are merged:
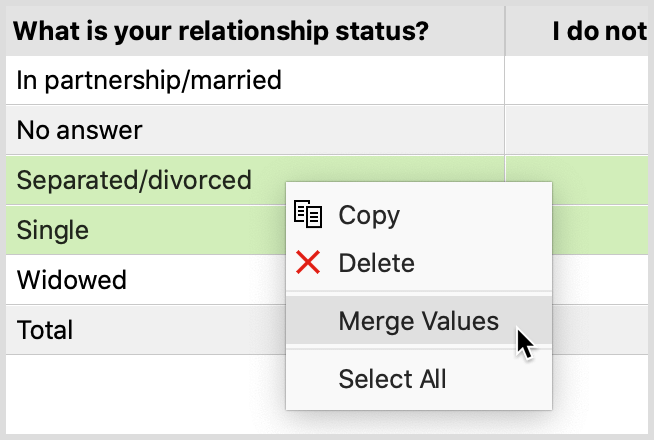
Columns can be merged, too:
- Right-click on a column heading and select Merge values.
- A popup menu appears containing all other columns of the crosstab. Click on one of the displayed columns to merge it with the right-clicked column.
The table will be automatically updated after merging columns or rows.
Save compilations of documents as document sets
If MAXQDA Stats was started with the data of a MAXQDA project, the frequencies for the individual variable values correspond to the number of documents for which this variable value was assigned. Thus, each frequency number represents a collection of documents. This collection can be saved as a document set for the MAXQDA project: Right-click on a cell and select Save as document set.
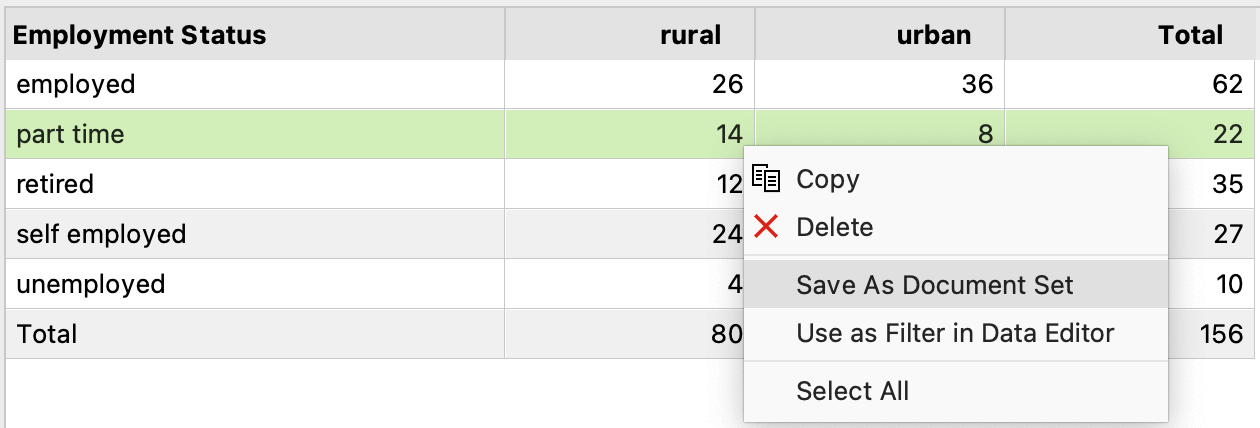
MAXQDA Stats saves such new sets temporarily in the background. When you quit Stats, all document sets formed during the analysis are displayed so that you can select which document sets are to be transferred to the MAXQDA project.
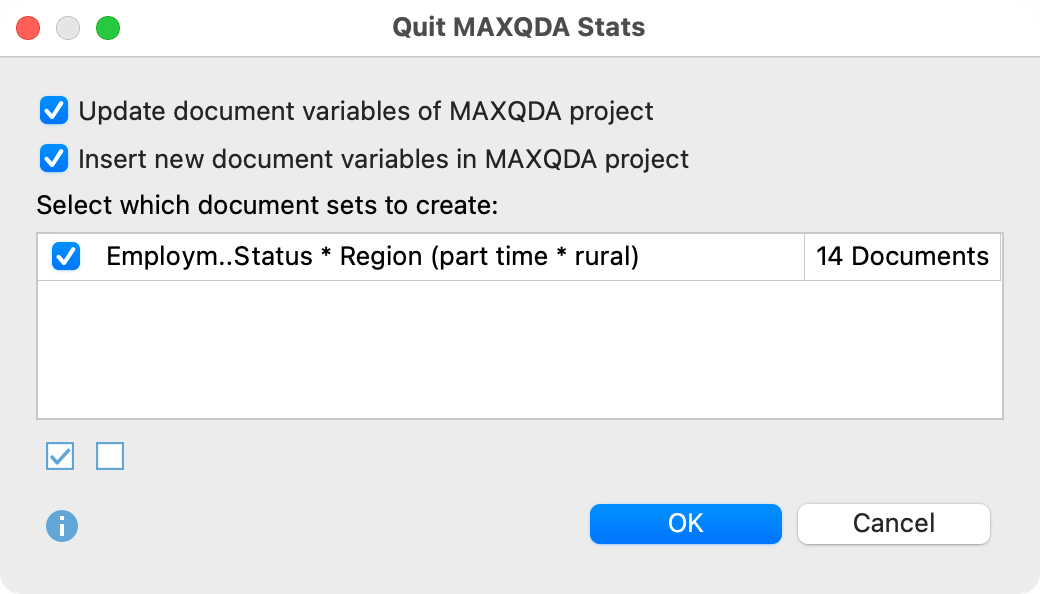
Tip: In the MAXQDA Stats status bar, you can see the number of document sets currently saved in Stats at any time. Clicking on the information in the status bar opens a window in which you can view and delete the saved document sets.
Use results to filter cases in Data Editor
You can use the results in a frequency table to filter cases in the Data Editor. To do this, right-click in a cell and select Use as Filter in Data Editor in the menu that appears:

As a result, only the cases that have the value of the selected row and column are displayed in the Data Editor. For this purpose, MAXQDA creates a new variable "StatsFilter", sets the value 1 for all associated cases and switches on the filter in the Data Editor for this variable.
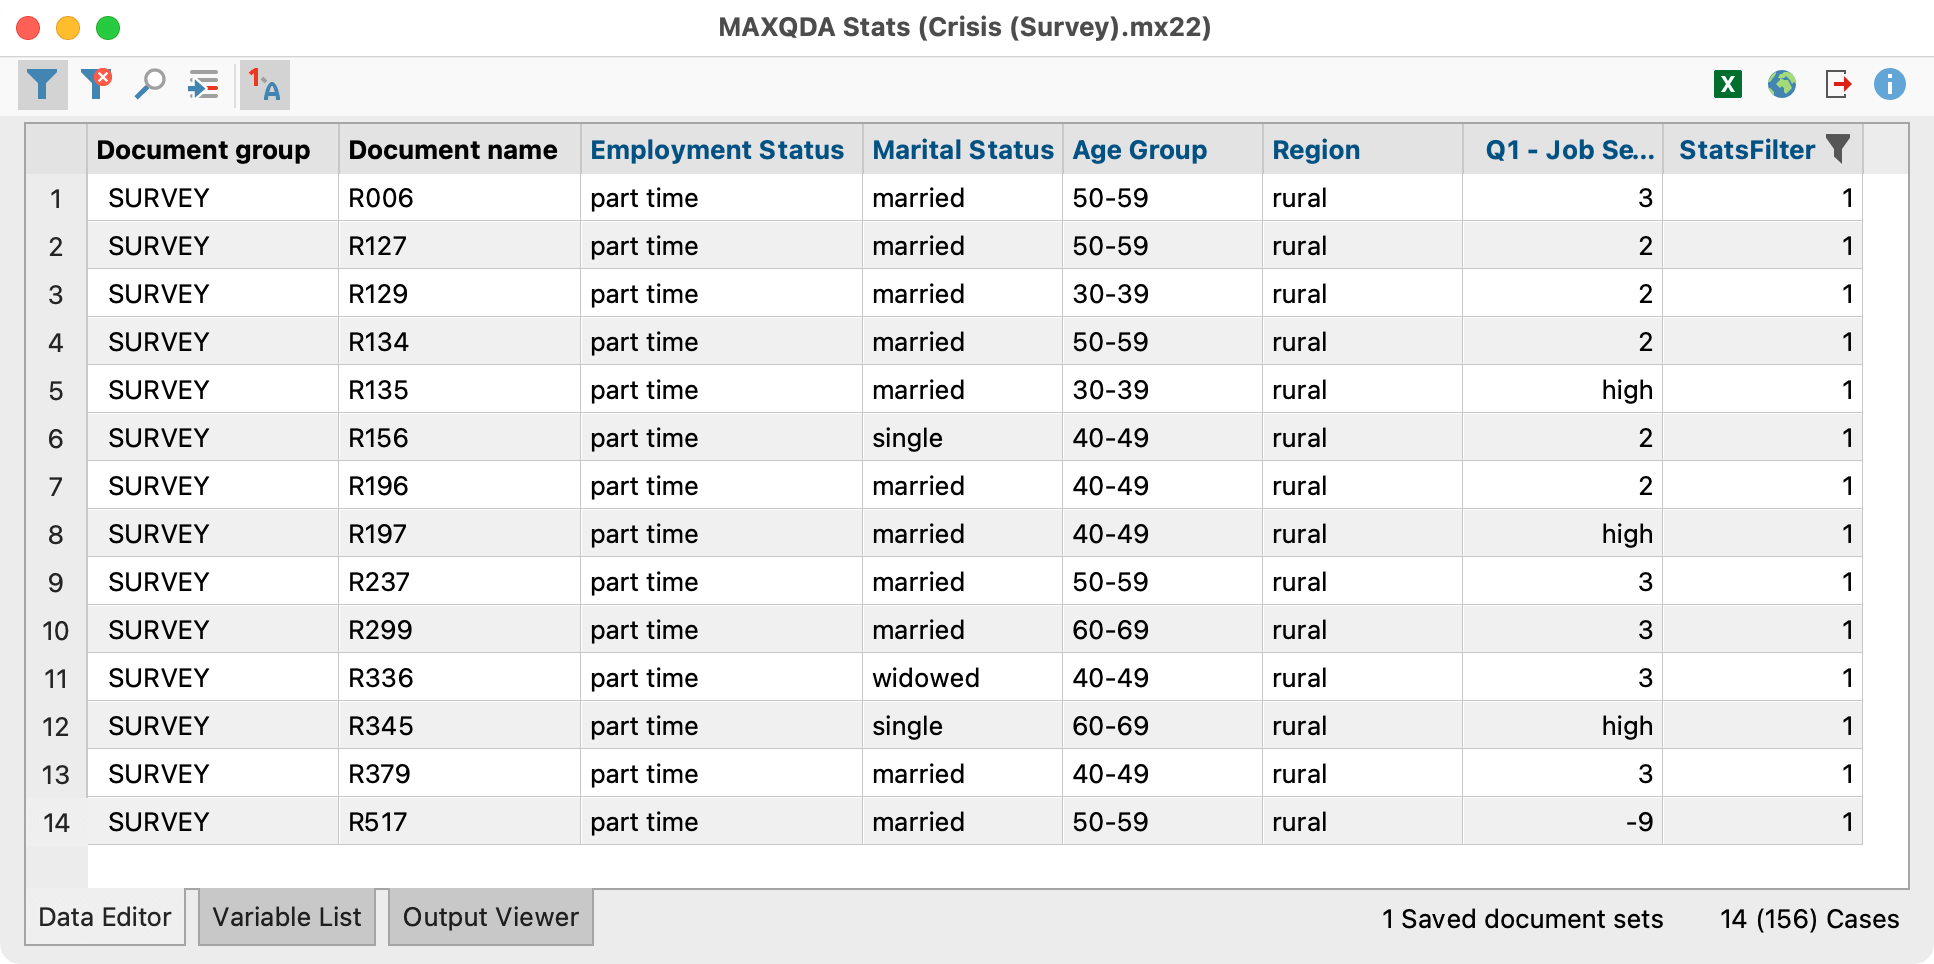
To switch the currently set filter on and off, click on the Filter ![]() icon in the toolbar above the Data Editor. To delete all filters, click on the
icon in the toolbar above the Data Editor. To delete all filters, click on the ![]() icon.
icon.
Calculating measures of association for crosstabs
In order to calculate measures of association and Chi-square values for a crosstab, click the icon Association measures ![]() in the toolbar above the crosstab.
in the toolbar above the crosstab.
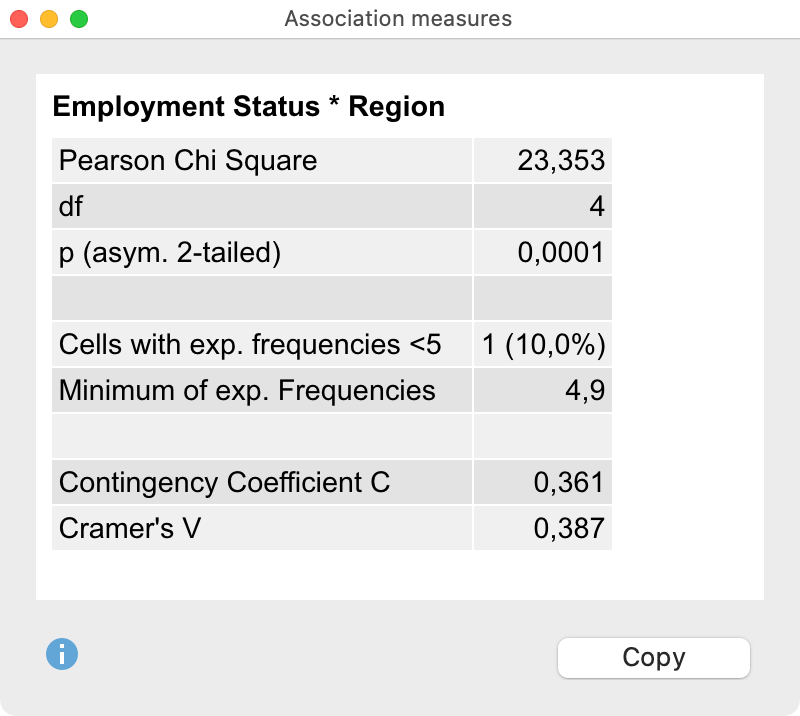
The following measures are computed (see textbooks on statistics for interpretation):
- Pearson’s Chi-square with degrees of freedom for the crosstab and the asymptotic two-sided significance level.
- Number of cells with expected frequencies smaller than 5 as well as the minimum expected frequency.
- Coefficient of contingency
- Cramer’s V
- As you can see in the example above, additional measures are calculated in fourfold tables:
- Pearson’s Chi-square with continuity correction
- Phi
If you click Copy the table will be transferred to the clipboard so you can paste the table easily into other programs such as Word.
Transfer results table to the Output Viewer
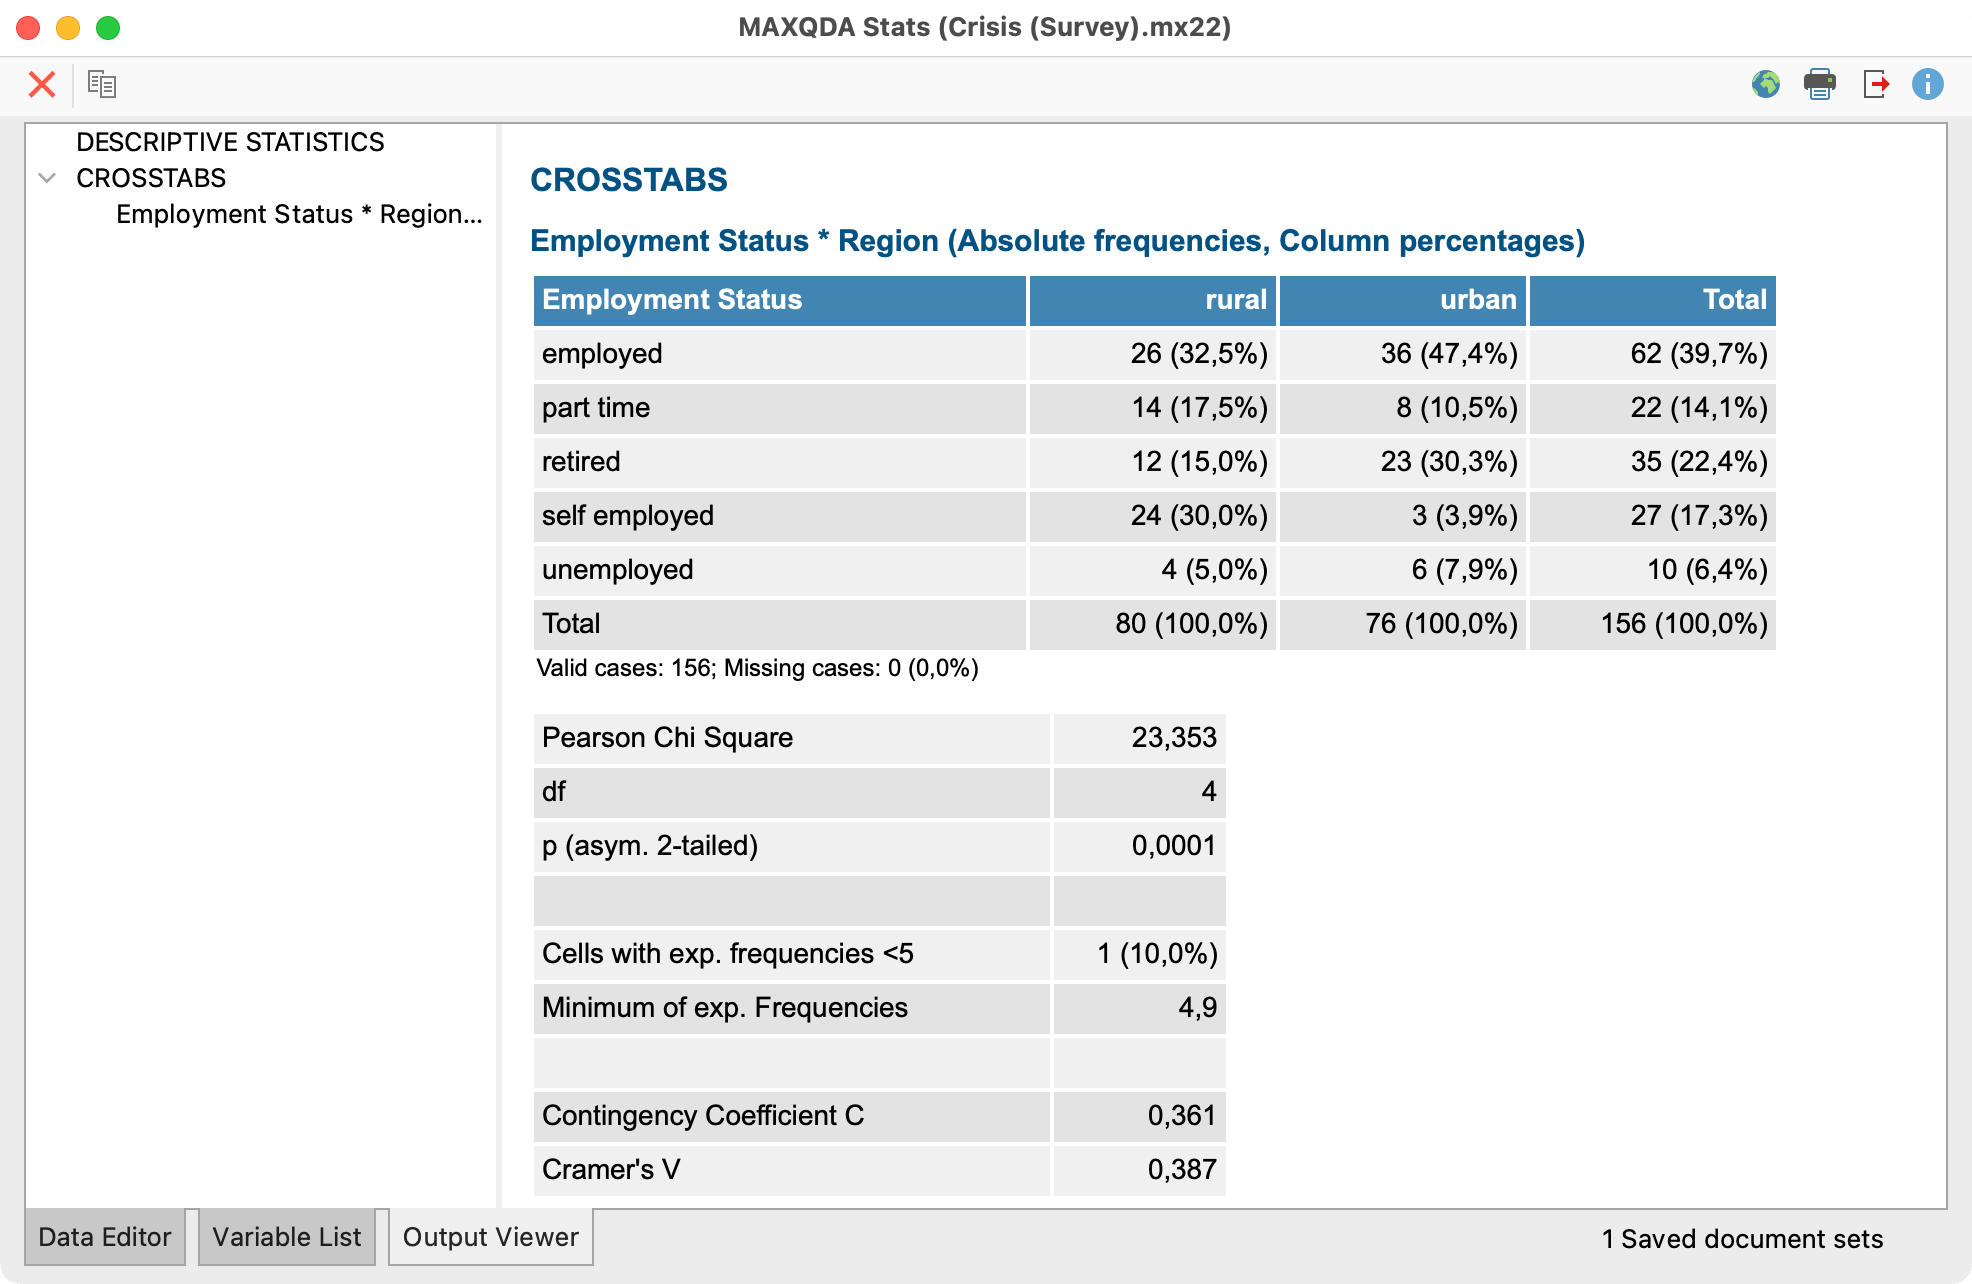
After the tables have been created and adapted according to your needs, they can be transferred to the Output Viewer from which they can later be exported together:
- Click the Insert into output viewer
 icon to transfer the currently displayed results table to the Output Viewer.
 - Click the Insert all result tables into output viewer
 icon to transfer all created tables to the Output Viewer at once.
MAXQDA Stats will ask if you also wish to include the measures of association. If you agree, a table containing the measures will be displayed below the results table.
Transfer results to Questions – Themes – Theories
In the Questions – Themes – Theories window, you can collect and comment on all the important results of your project. Click the ![]() Send to QTT Worksheet icon in the upper right corner to save the current view in a new or existing worksheet.
Send to QTT Worksheet icon in the upper right corner to save the current view in a new or existing worksheet.
Once you close MAXQDA Stats, you can access all your QTT worksheets via Analysis > Questions – Themes – Theories.
Export and print results table
Several options for exporting and printing the currently displayed results table are available using the following symbols:
![]() Copy – copies the entire table or selection, for example in order to paste it directly into Word.
Copy – copies the entire table or selection, for example in order to paste it directly into Word.
![]() Print – starts the print process and displays a print preview, in which the settings such as margins, orientation, headers and footers can be applied.
Print – starts the print process and displays a print preview, in which the settings such as margins, orientation, headers and footers can be applied.
![]() Export – exports the table in Excel format, website (HTML) format or RTF format for Word and other word processing programs.
Export – exports the table in Excel format, website (HTML) format or RTF format for Word and other word processing programs.
Display results as a grouped vertical or horizontal bar chart
You can display the contents of the crosstab as a grouped vertical or horizontal bar chart. Via the ![]() and
and ![]() icons you can switch between the chart view and the table view.
icons you can switch between the chart view and the table view.
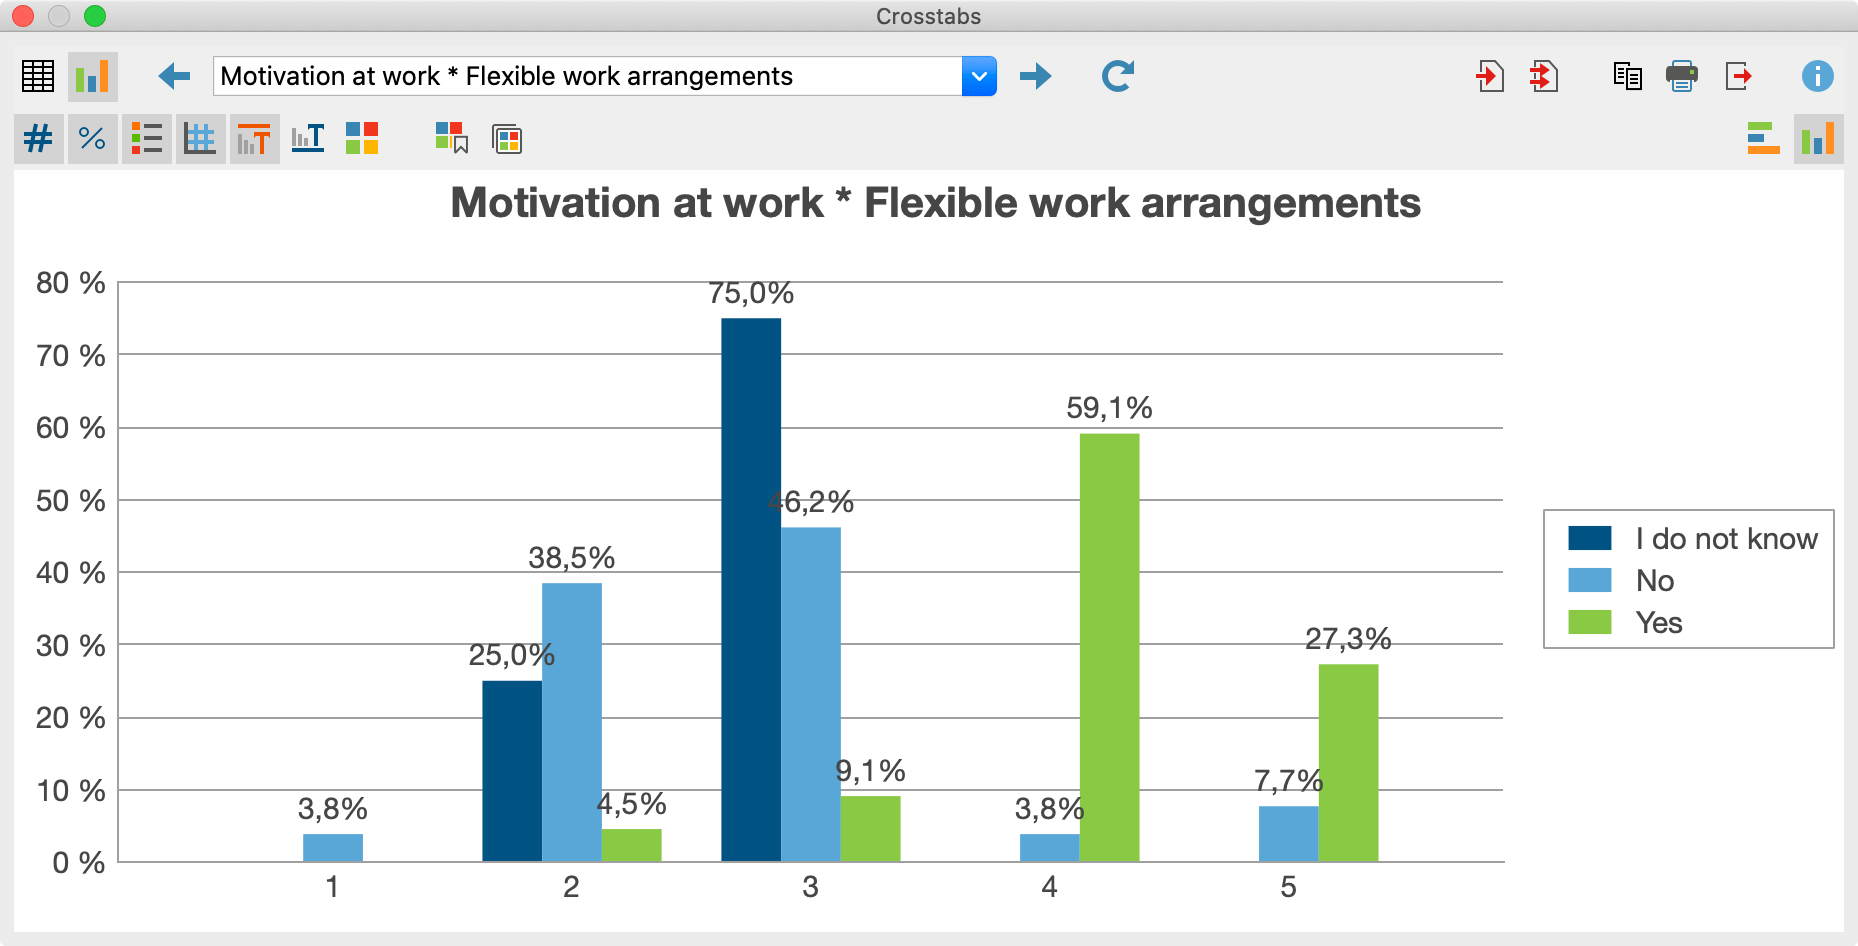
You can change the display from a ![]() vertical bar chart to a
vertical bar chart to a ![]() horizontal bar chart by clicking on the corresponding icons in the upper right-hand corner of the toolbar.
horizontal bar chart by clicking on the corresponding icons in the upper right-hand corner of the toolbar.
Via the icons on the left side above the diagram, you can show or hide the data labels, titles and subtitles, as well as specify the color.
The size of the chart automatically adjusts to the window size. Maxmize the window to display a larger chart.
Exporting charts
The charts can be transferred to the Output Viewer for storage and later export, or they can be transferred to a QTT worksheet. To do this, click on the corresponding icons in the top right corner of the toolbar:
![]() Insert into Output Viewer and
Insert into Output Viewer and ![]() Send to QTT Worksheet.
Send to QTT Worksheet.
To export or print a chart directly, the usual icons are available in the upper right-hand corner of the window:
![]() Copy,
Copy, ![]() Print and
Print and ![]() Export.
Export.
