In many surveys there are questions of the following type, in which respondents are asked to rate statements in a matrix-like representation:
How often do you use the following MAXQDA functions?
| never 0 |
|
| often |
Transcription | ◯ | ◯ | ◯ | ◯ |
Memos | ◯ | ◯ | ◯ | ◯ |
Variables | ◯ | ◯ | ◯ | ◯ |
QTT | ◯ | ◯ | ◯ | ◯ |
MAXMaps | ◯ | ◯ | ◯ | ◯ |
MAXDictio | ◯ | ◯ | ◯ | ◯ |
Stats | ◯ | ◯ | ◯ | ◯ |
Usually, each item is represented by a separate variable that indicates which answer option the respondent chose. The individual variables can be analyzed using the Stats function Descriptive Statistics > Frequencies, but it is usually better to present the results in a combined table or chart.
To do this, you must first “tell” MAXQDA Stats which items belong together by defining matrix question sets.
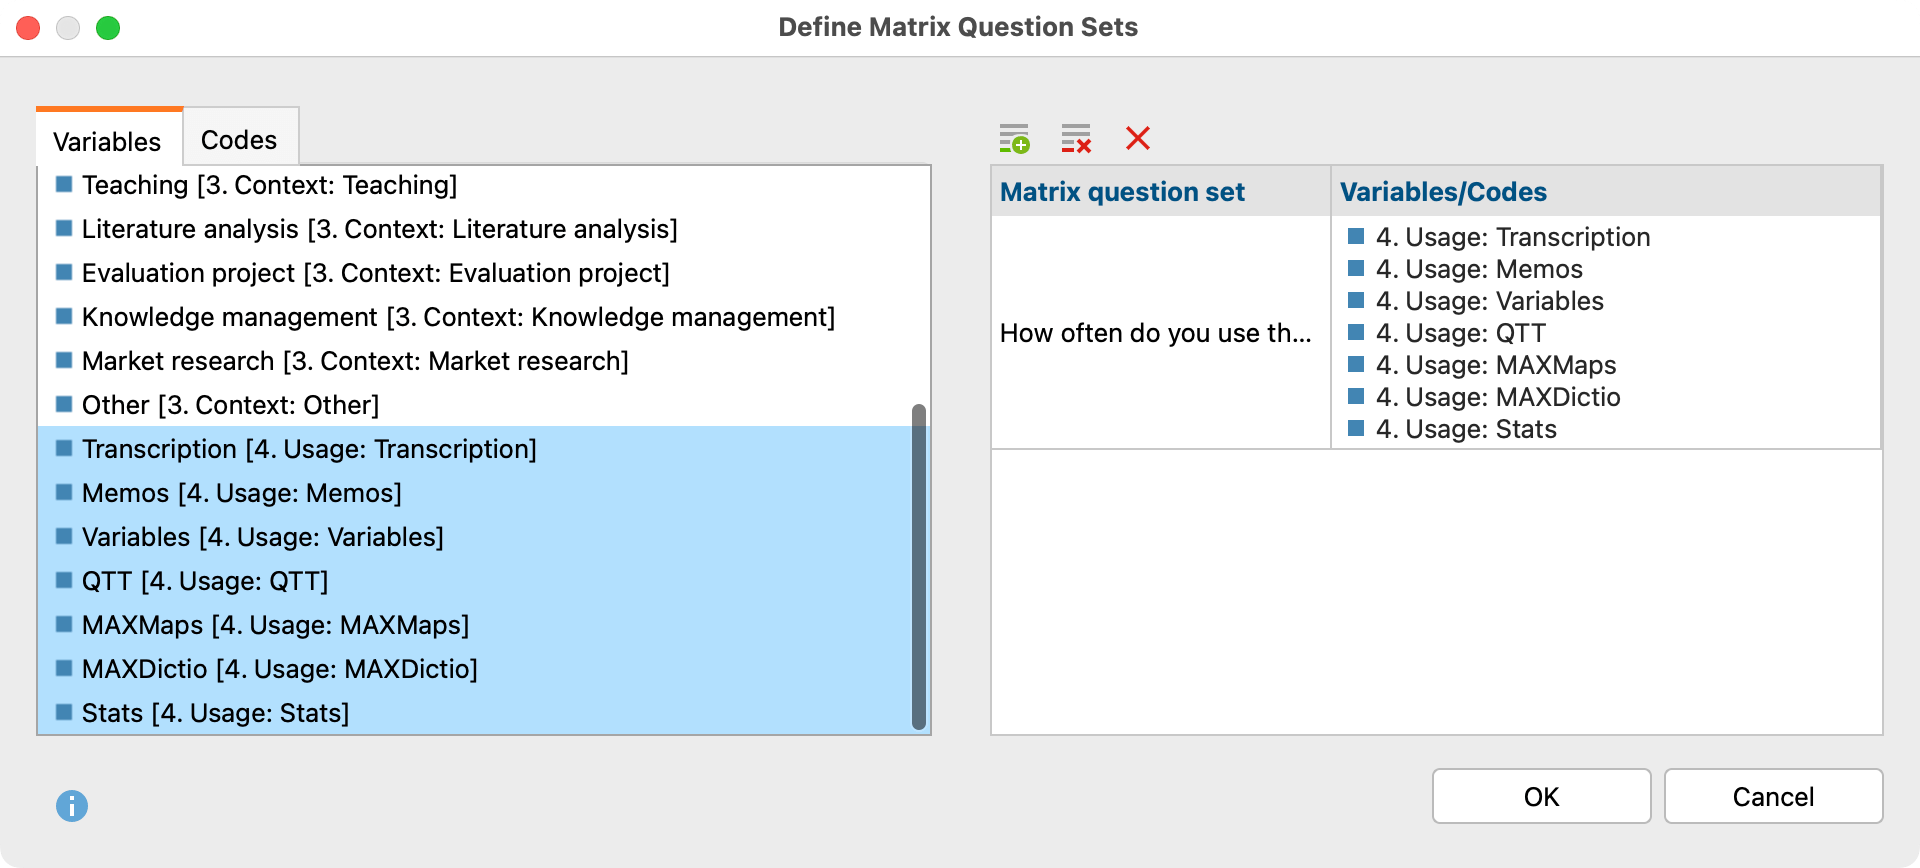
Define Matrix Question Sets
- Call Descriptive Statistics > Define Matrix Question Sets.
- Click on the icon with the green plus sign to create a new set.
- Assign a name for the set in the “Matrix question set” column.
- Drag all variables belonging to the set into the new row on the right side.

If you are working with data from a MAXQDA project, the sets will be saved in the project and you can also create a set that consists of codes rather than variables (variables and codes cannot be mixed).
If you work with external data, for example, from SPSS, you can also create multiple response sets, but these are not saved and are only available while the file is open.
Create Frequency Tables
Once you have created a matrix question set, you can request a frequency analysis for them via Descriptive Statistics > Frequencies. In the options dialog, the sets are available on a separate tab and can be selected for analysis:

The Exclude cases listwise option ensures that only cases are analyzed that have a valid value for all analyzed variables (from all selected sets).
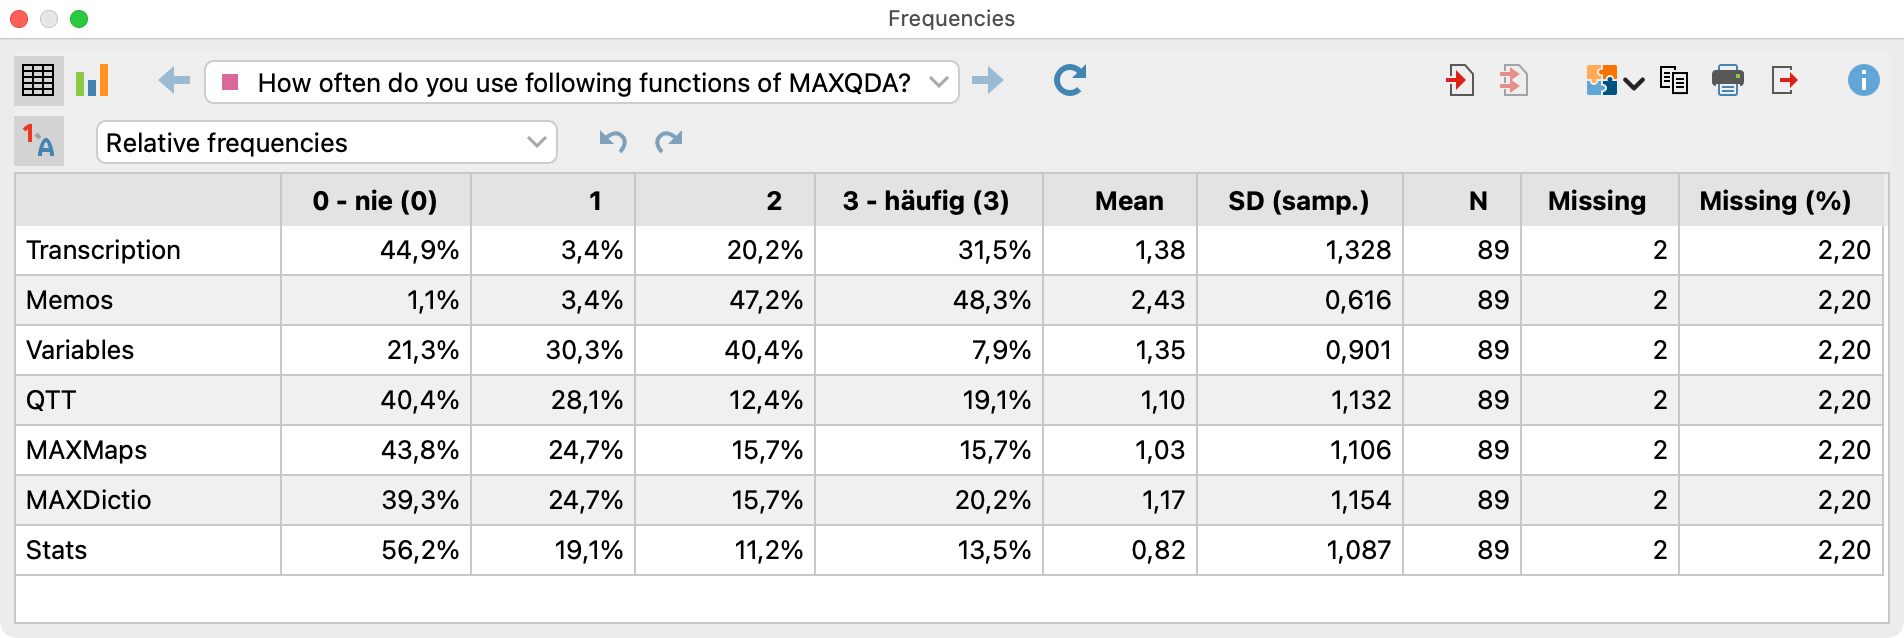
The results table looks as follows:

For each variable of the set, the frequencies per response option are presented, supplemented by the mean, the standard deviation, and the number of valid and missing cases.
Using the drop-down menu at the top, you can set whether the absolute, relative or both frequencies should be presented.
Note: The table is automatically sorted according to the order of the variables in the set. By clicking on the column headers, the sorting can be adjusted, usually a descending sorting by mean is suitable.
By right-clicking on a row, it can be removed from the view. Multiple rows cannot be merged (this would make no sense in this context).
By right-clicking in a cell with document frequencies, the filter function for the data editor and saving as a document set are available (see section “Saving documents as a document set” in chapter Frequency tables).
By clicking on the chart icon, the responses can be displayed as a stacked bar chart.
