Using a cluster analysis, cases can be grouped according to their similarity. The basis for the calculation is a distance matrix, which indicates for each two documents how similar (more precisely: how dissimilar) they are with regard to their variable assignments and, if applicable, code assignments.
Cluster analysis for interval data
A cluster analysis for interval data is useful if the calculation of the
arithmetic mean for the analyzed variables makes sense, for example, for age
or for a scale from “0 = never” to “10 = very often”.
In a cluster
analysis for interval data, all variables of the integer and decimal type are
available (regardless of the scale level defined for the variables in the
Variable List). If codes from a MAXQDA project are included in the analysis,
code frequencies per case are analyzed, that is, how often a code was assigned
to a document.
How to perform a cluster analysis for interval data
- Call Function Compare Groups > Hierarchical Cluster Analysis (Interval Data).
- In the dialog, select the desired variables and codes.
- the following options are available at the bottom of the dialog:
- z-standardize values- Performs z-standardization of the selected variables and codes. The option should always be set if the selected variables have different scale ranges or if variables and codes are mixed, otherwise the calculations will not make sense.
- Binarize all codes – All code frequencies greater than 1 are set to 1, that is, the code frequency per document is not evaluated, but only whether a code occurs in a document or not.
- Sum up frequencies of subcodes – For parent codes, the frequencies of all subcodes available in the Stats dialogue are added to the code frequency. If the option Binarize subcodes is also selected, the summation only takes into account whether the code was assigned to a document (the frequency of a subcode is set to “1”) or not (the frequency of a subcode is set to “0”). When combining both options, the sum of the subcodes indicates how many subcodes were coded for a document.
- Start the calculation with OK.
Result: Merge table
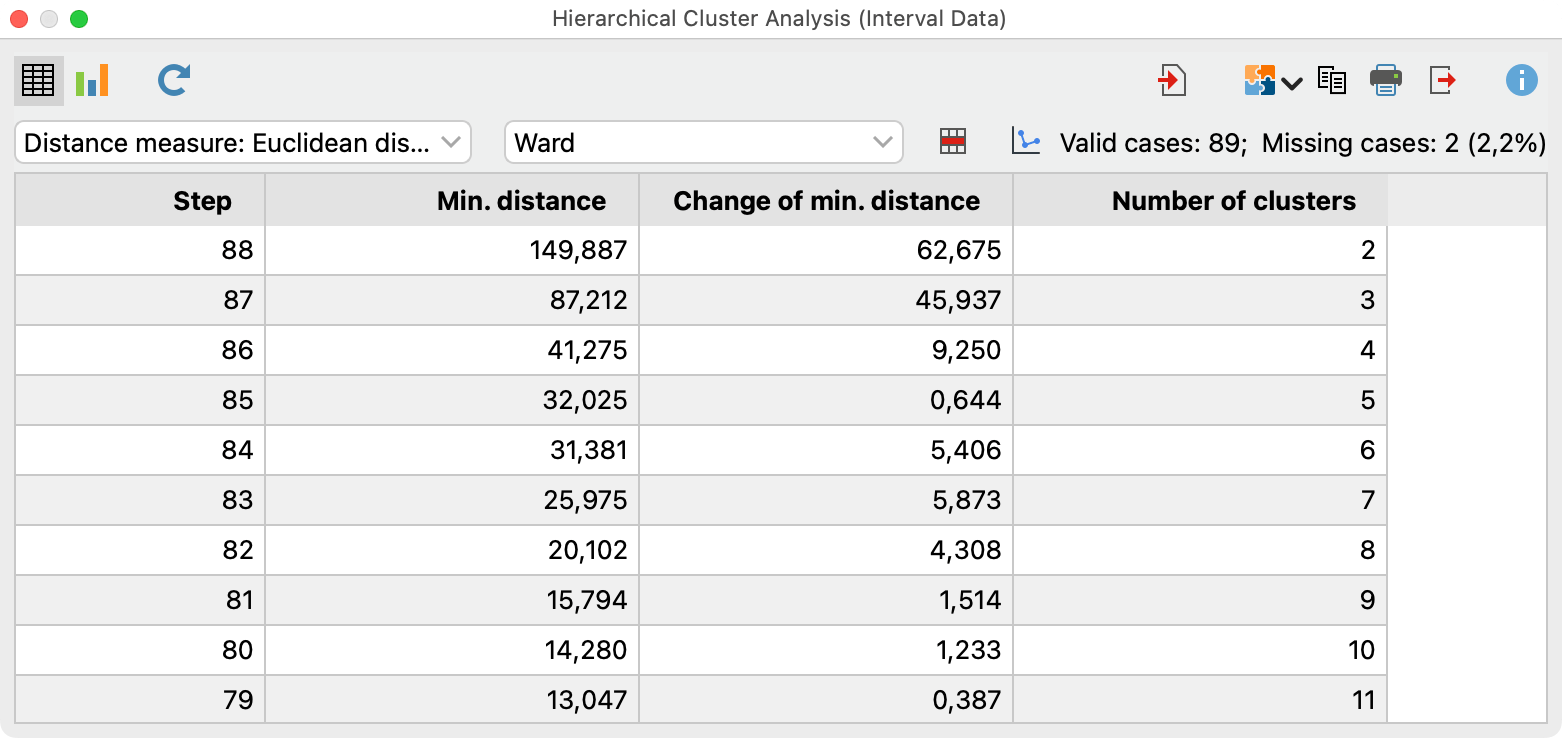
MAXQDA displays a table that informs which clusters are merged in each step of the analysis:

The columns of the table have the following meaning:
- Step– Current merging step.
- Min. distance– Distance between the two clusters that are merged in the current step. For Average, Complete and Single linkage the raw values are output, for Ward the weighted intra-cluster variance.
- Change of min. distance– Difference from current “Min. distance” to previous step; this value is useful for deciding on the number of clusters.
- Number of clusters– Number of clusters remaining after merge.
Using the first pop-up menu at the top, you can set various distance measures:
- Euclidean distance
- Squared Euclidean distance
- Block distance
Using the second pop-up menu at the top, you can choose a merge criterion:
Criterion | Meaning | SPSS Name |
Unweighted average linkage | Average distance of all case pairs from both clusters | between groups |
Weighted average linkage | Average distance of all case pairs from the union of both clusters | nicht vorhanden |
Complete linkage | Maximum distance of all case pairs from both clusters | furthest neighbour |
Single linkage | Minimum distance of all cases from both clusters | nearest neighbour |
Ward | Increase of variance when merging two clusters | Ward |
Details on the fusion criteria can be found here: https://en.wikipedia.org/wiki/Hierarchical_clustering
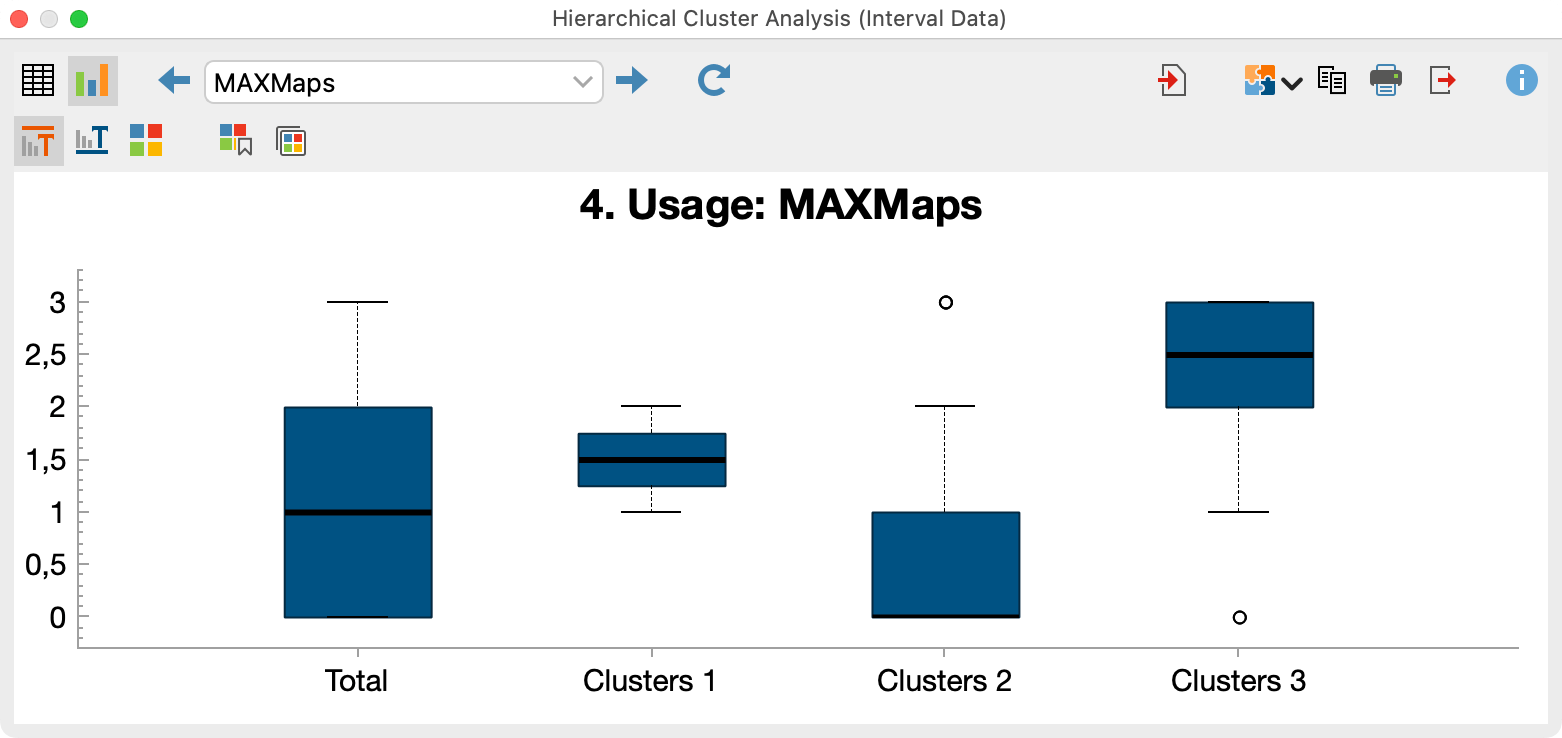
To analyze the differences between the clusters, you can switch to the chart view using the icon in the upper left corner. Boxplots per cluster are created for all analyzed variables and codes:

Result: Typology table
In addition to the results window, MAXQDA automatically opens the following typology table, which can also be opened at any time using the corresponding icon in the toolbar of the results window. The table allows you to compare the mean and standard deviation per cluster for all selected variables and codes.

As an aid to interpretation, the highest mean values per row are shown in green and the lowest values in red. The highlighting can be switched on and off using the icons at the top left.
The number of clusters can also be set in the toolbar at the top left, allowing to compare different solutions easily.
Using the icon ![]() , the cluster membership is saved as a document variable, so
that the cluster membership is available for other calculations and qualitative analyses.
, the cluster membership is saved as a document variable, so
that the cluster membership is available for other calculations and qualitative analyses.
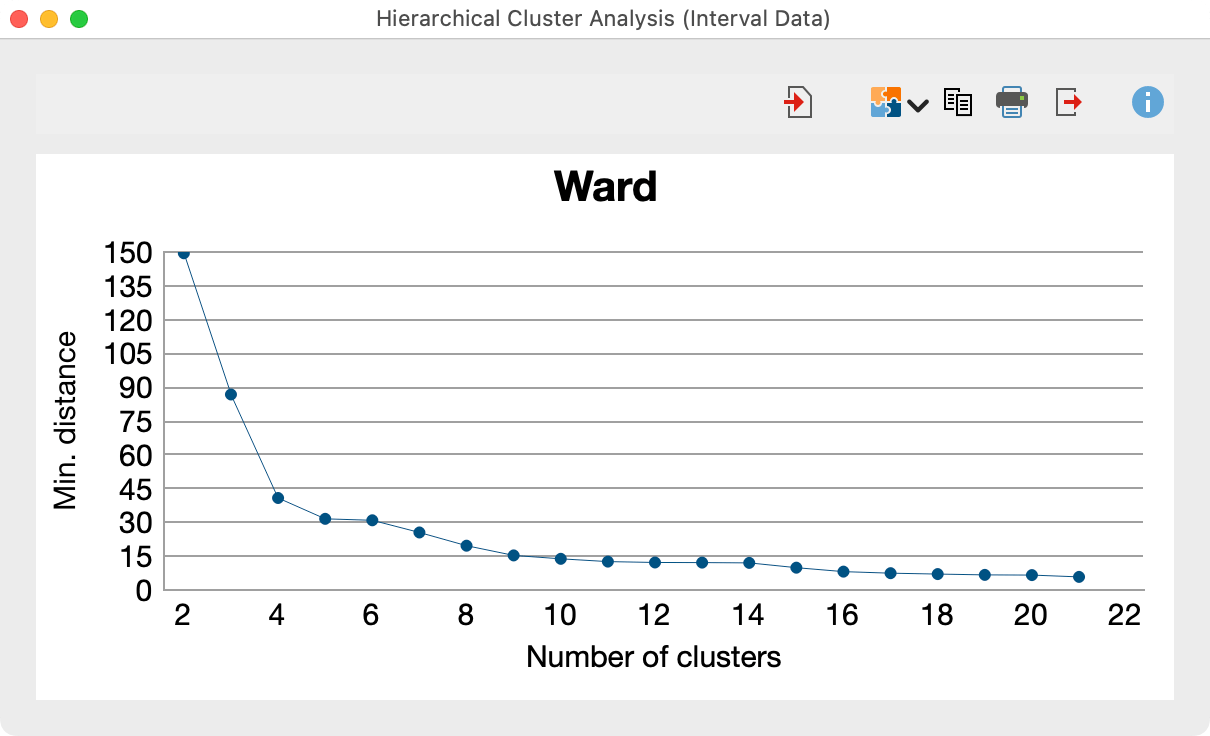
Result: Line chart of the minimum cluster distances
To help you decide on the appropriate number of clusters, you can use the icon in the merge table to call up a line chart of the minimum distances.

Save and export results
All created tables and charts can be saved using the icons in the upper right corner, for example,
- into the Output Viewer of MAXQDA Stats
- or into a MAXQDA QTT worksheet.
The tables and diagrams can also be exported to the clipboard, saved as a file, or printed.
Cluster analysis for dichotomous data
In a cluster analysis for dichotomous data, all variables can be included regardless of their type. If codes from a MAXQDA project are included in the analysis, the analysis checks whether a code has been assigned to a case or not - the frequency of assignment per case is irrelevant.
The cluster analysis for dichotomous data is called via Compare Groups > Hierarchical Cluster Analysis (Dichotomous Data).
The procedure and the result are identical to the cluster analysis for interval data described above with the following exceptions:
- In the options dialog, the value to be counted must be specified for each variable and code. No z-standardization is performed.
- The chart view shows bar charts with the frequencies of the counted value per cluster instead of boxplots.
- The typology table contains absolute and percentage frequencies of the counted value per cluster instead of means and standard deviations.
- The following similarity measures are available instead of distance measures: Simple agreement, Jaccard, Kuckartz & Rädikers’ zeta, Russel & Rao. More information on the coefficients: https://www.maxqda.com/help-mx22/mixed-methods-functions/similarity-analysis-for-documents.
- To determine the distances of two documents, 1 - calculated similarityis used
