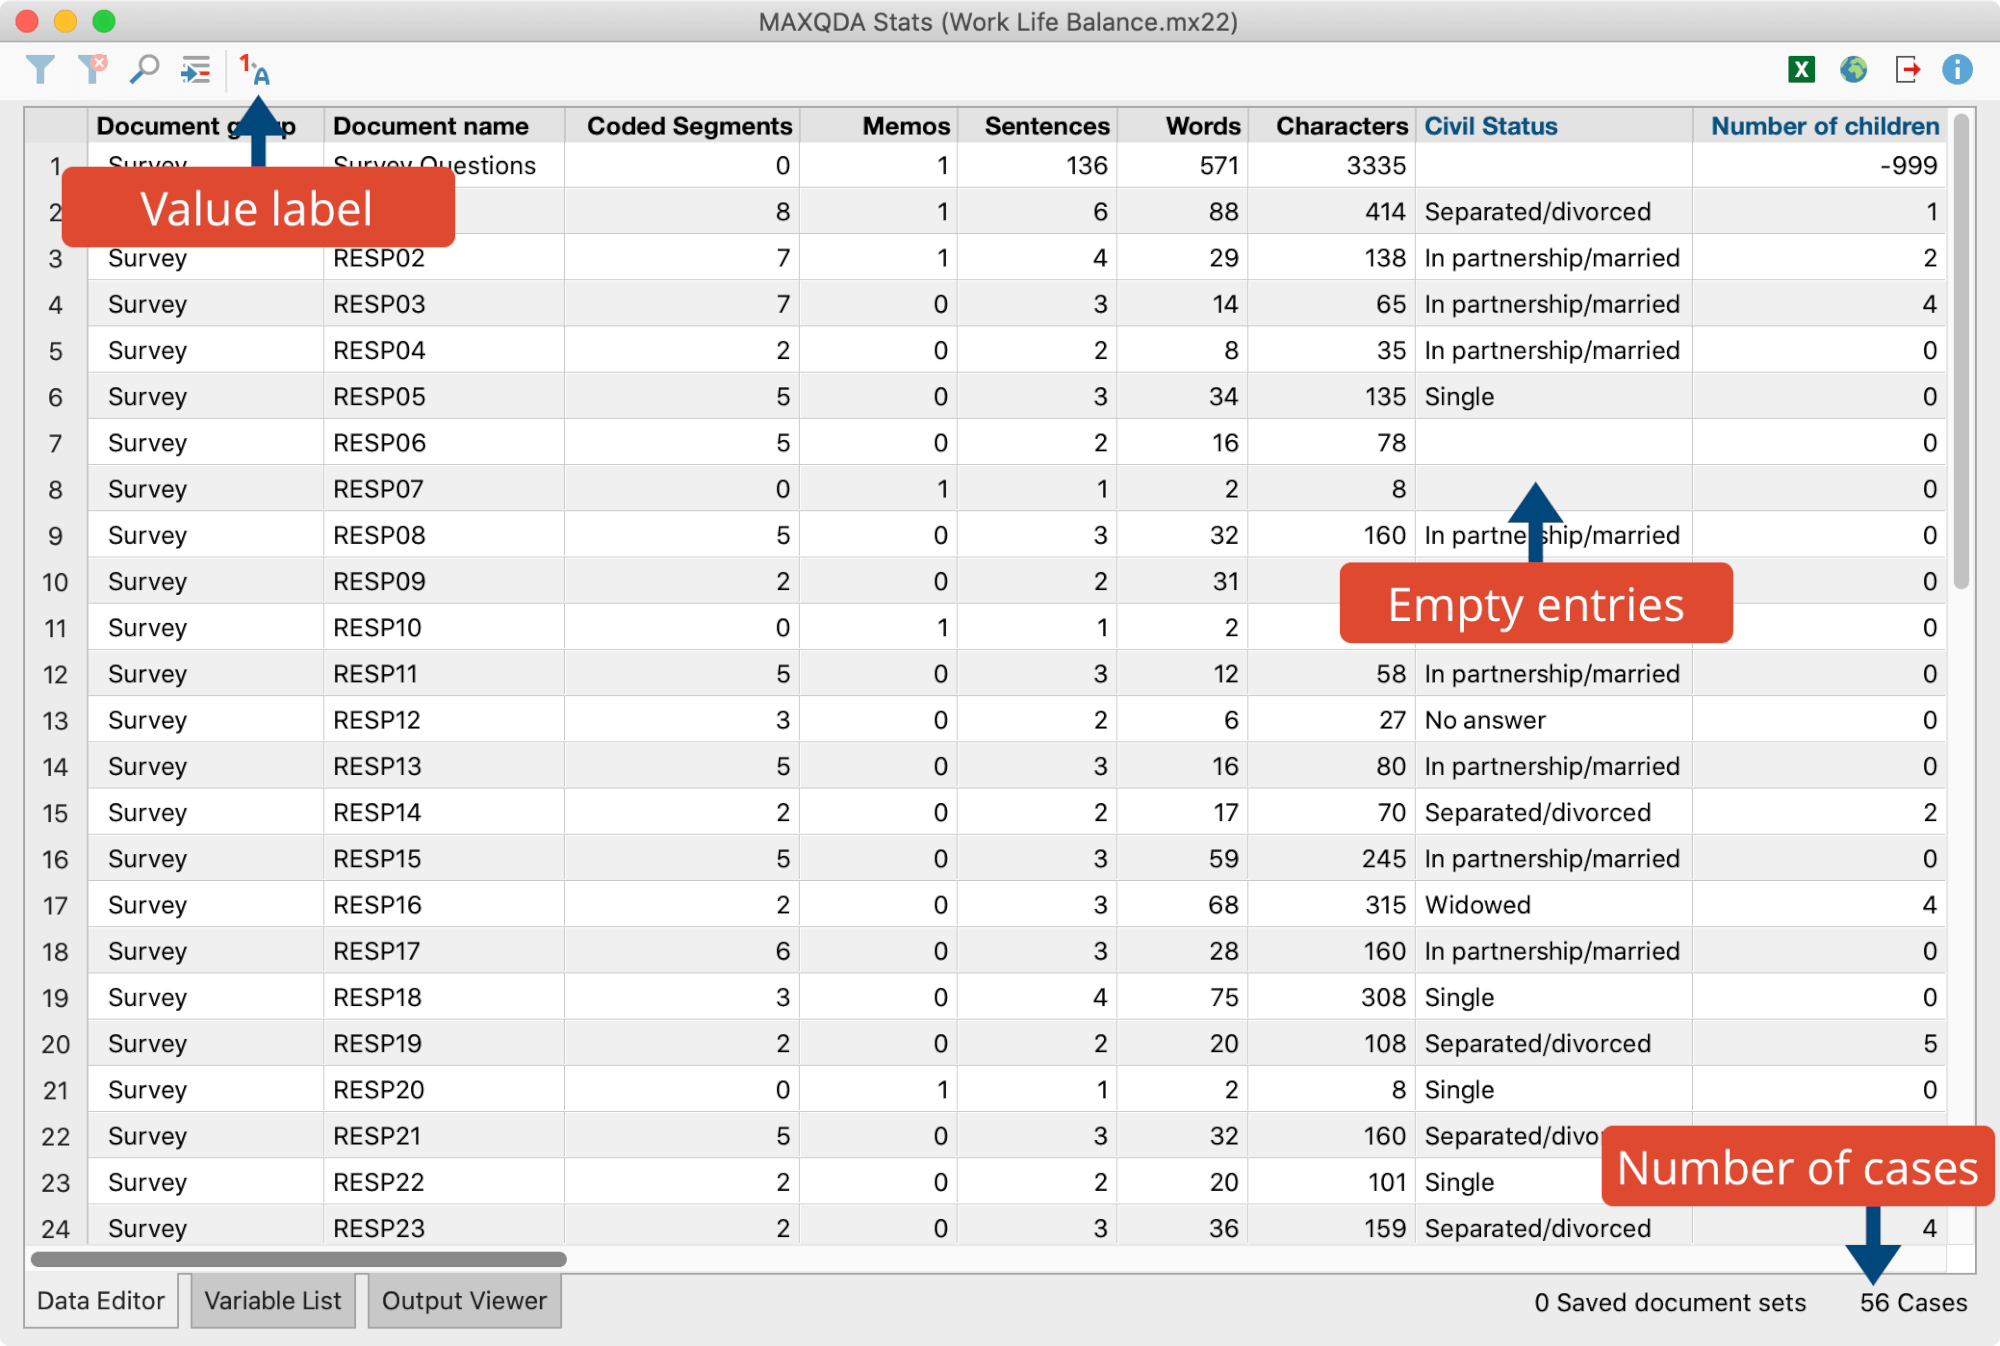
The MAXQDA Stats Data Editor displays the cases in the rows and the variables in the columns. Each case is therefore in a separate line. The following figure shows the Data Editor for a MAXQDA project, which essentially corresponds to the Data Editor for the MAXQDA document variables. The third row provides information on the document “RESP02” which contains 7 coded segments and 1 memo. It refers to a survey respondent that is in a partnership or married and has 2 children.

The first columns in the example figure contain the MAXQDA system variables, such as “Document group”, “Document name”, “Coded segments”, and “Memos”. They are immutable in MAXQDA Stats and column headings are therefore displayed as in MAXQDA in black. The modifiable user variables are displayed in blue.
Individual columns can be hidden by right-clicking on the column header and choosing Hide Column from the context menu. Using the Select columns function, also in the context menu, individual or all columns can be hidden or displayed, just like in MAXQDA.
System-defined missing values
MAXQDA Stats considers any blank fields in the Data Editor as system-defined missing. Unlike in the MAXQDA Data Editor, integer or decimal-type variable fields can also be empty.
Show value labels
The toolbar is located above the Data Editor on the left side.

Using the icon Show value labels ![]() the entered value of the value label will be displayed. This value can be individually defined for each variable in the Variable List. If no label is defined for a value, the value will still be displayed.
the entered value of the value label will be displayed. This value can be individually defined for each variable in the Variable List. If no label is defined for a value, the value will still be displayed.
Sort and search cases
Clicking on a column header in the Data Editor sorts the data in this column; clicking a second time sorts the same column in the reverse order.
The Data Editor in MAXQDA Stats can be searched and filtered, exactly as in MAXQDA. Clicking on the Search ![]() icon in the toolbar above the Data Editor opens a search list in which a search query can be entered, the occurrence of which will be searched in all columns. To search in a single column, right-click on the column header and select Search.
icon in the toolbar above the Data Editor opens a search list in which a search query can be entered, the occurrence of which will be searched in all columns. To search in a single column, right-click on the column header and select Search.
Filter cases
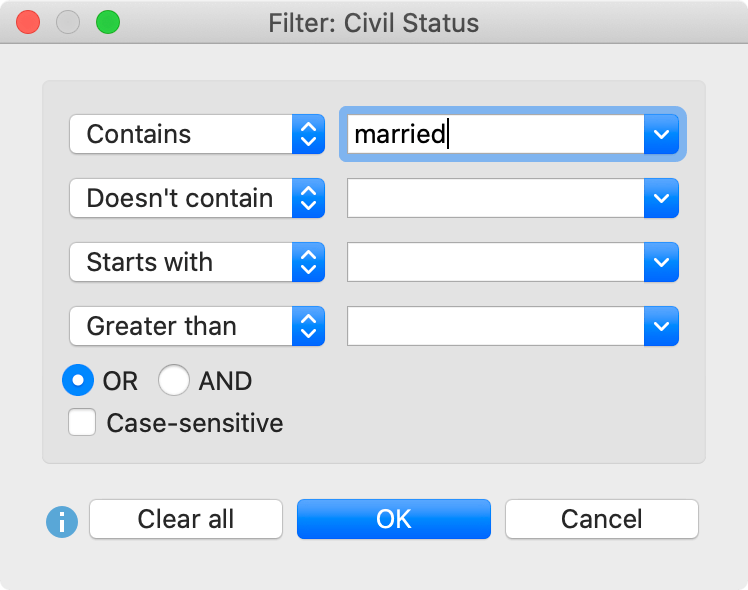
The filter function can similarly be called up for a column as follows:
- Right-click on a column header.
- Select Set Filter.
- In the dialog box, define filter criteria and click OK.

The number of cases currently in the Data Editor can be seen in the bottom right of the status bar. Only these cases are included in the calculations.
To switch the currently set filter on and off, click on the Filter ![]() icon in the toolbar above the Data Editor. To delete all filters, click on the
icon in the toolbar above the Data Editor. To delete all filters, click on the ![]() icon.
icon.
Go to case
To jump to a particular case in a row, click on the ![]() icon in the toolbar above the Data Editor. A small dialog box will appear where you can enter the target row.
icon in the toolbar above the Data Editor. A small dialog box will appear where you can enter the target row.
Insert new cases
When MAXQDA Stats is called up for a MAXQDA project, it is not possible to insert new cases, as this would be synonymous with the insertion of further documents in the MAXQDA project itself. The situation is different when you create or open a new external file. In this instance, it is of course possible to add additional cases to the data set, which can be done as follows:
- Scroll to the bottom of the data set
- A blank row is located in the last row of the Data Editor. As soon as any content is entered in any column, this row will be assigned a consecutive number and another blank row for the next record will appear underneath the previous row.
Delete cases
When you work with an external file in MAXQDA Stats, you can delete individual or multiple cases as follows:
- In the Data Editor, highlight a single case with the mouse, or highlight multiple cases by pressing the Ctrl/cmd key.
- Right-click the highlighted area and select Delete selected cases. Alternatively, you can click on the Delete icon
 in the toolbar above the Data Editor.
Export Data Editor
At the top right of the Data Editor a typical MAXQDA toolbar is located, which contains the following icons for exporting data.
![]() Open as Excel table – When you click on this icon, the current view will be exported and displayed as an Excel file.
Open as Excel table – When you click on this icon, the current view will be exported and displayed as an Excel file.
![]() Open as HTML table – When you click on this icon, the current view will be exported and displayed as a HTML file in the default browser.
Open as HTML table – When you click on this icon, the current view will be exported and displayed as a HTML file in the default browser.
![]() Export – When this function is selected, a file dialog will appear in which you can select from Excel or HTML export formats and specify a file name and location. Value labels that are displayed in MAXQDA will also be exported.
Export – When this function is selected, a file dialog will appear in which you can select from Excel or HTML export formats and specify a file name and location. Value labels that are displayed in MAXQDA will also be exported.
The currently displayed data can be saved as an SPSS file by selecting File > Save As from the main menu.
