MAXQDA Stats supports the creation of a scale, consisting of several items. Before you start building a scale, it may be helpful to check the items for consistent polarity, otherwise the computation may give incorrect results. You can use the function Transform > Recode into other variable to standardize the item polarity.
To build a scale in MAXQDA Stats, select the function Scale > Reliability (Cronbach’s Alpha) from the main menu. A dialog will appear in which you can select all the variables you want to include in the initial scale.
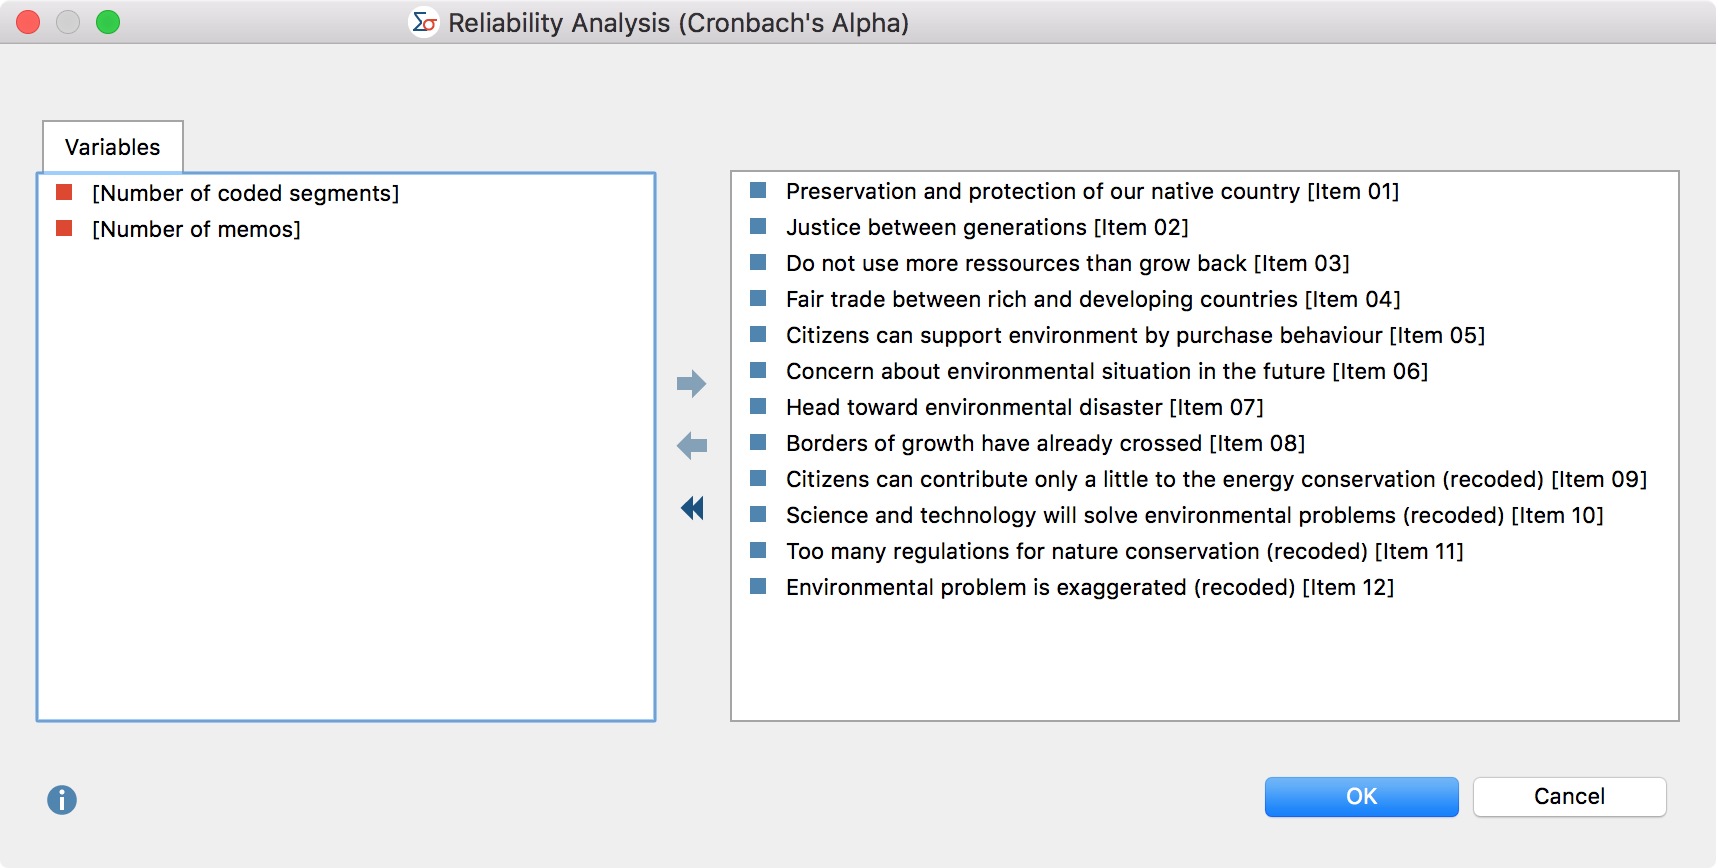
Variables can be selected in several ways:
- Double-click on a variable.
- Drag and drop the variable into the right window pane.
- Select one or multiple variables with the mouse by holding the Ctrl/Cmd key then dragging the selection into the right window pane with the mouse, or click the blue arrow in the middle of the window.
To integrate code frequencies per document into the calculations, switch to the “Codes” tab and select the desired codes. (This option is available only if MAXQDA Stats was launched with the data of a MAXQDA project).
Results table
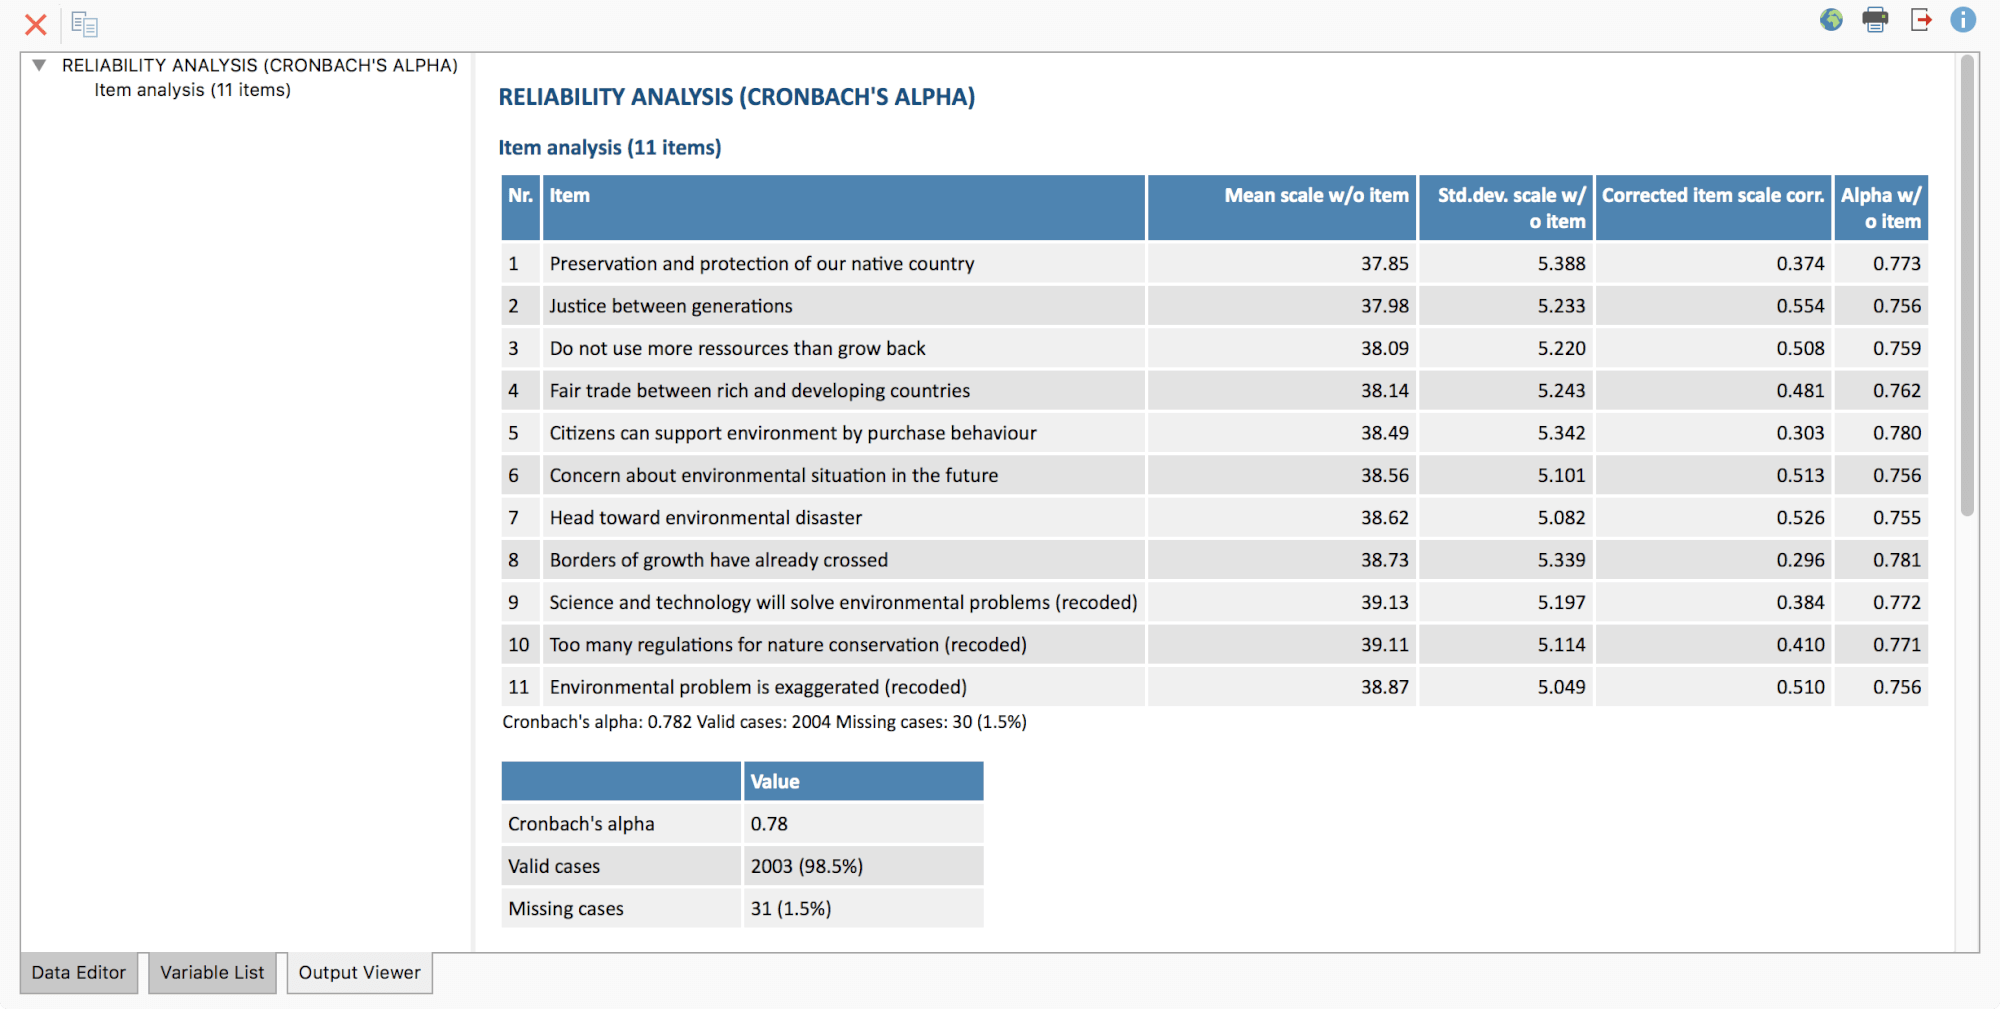
After clicking OK MAXQDA Stats will compute a results table with the following structure:
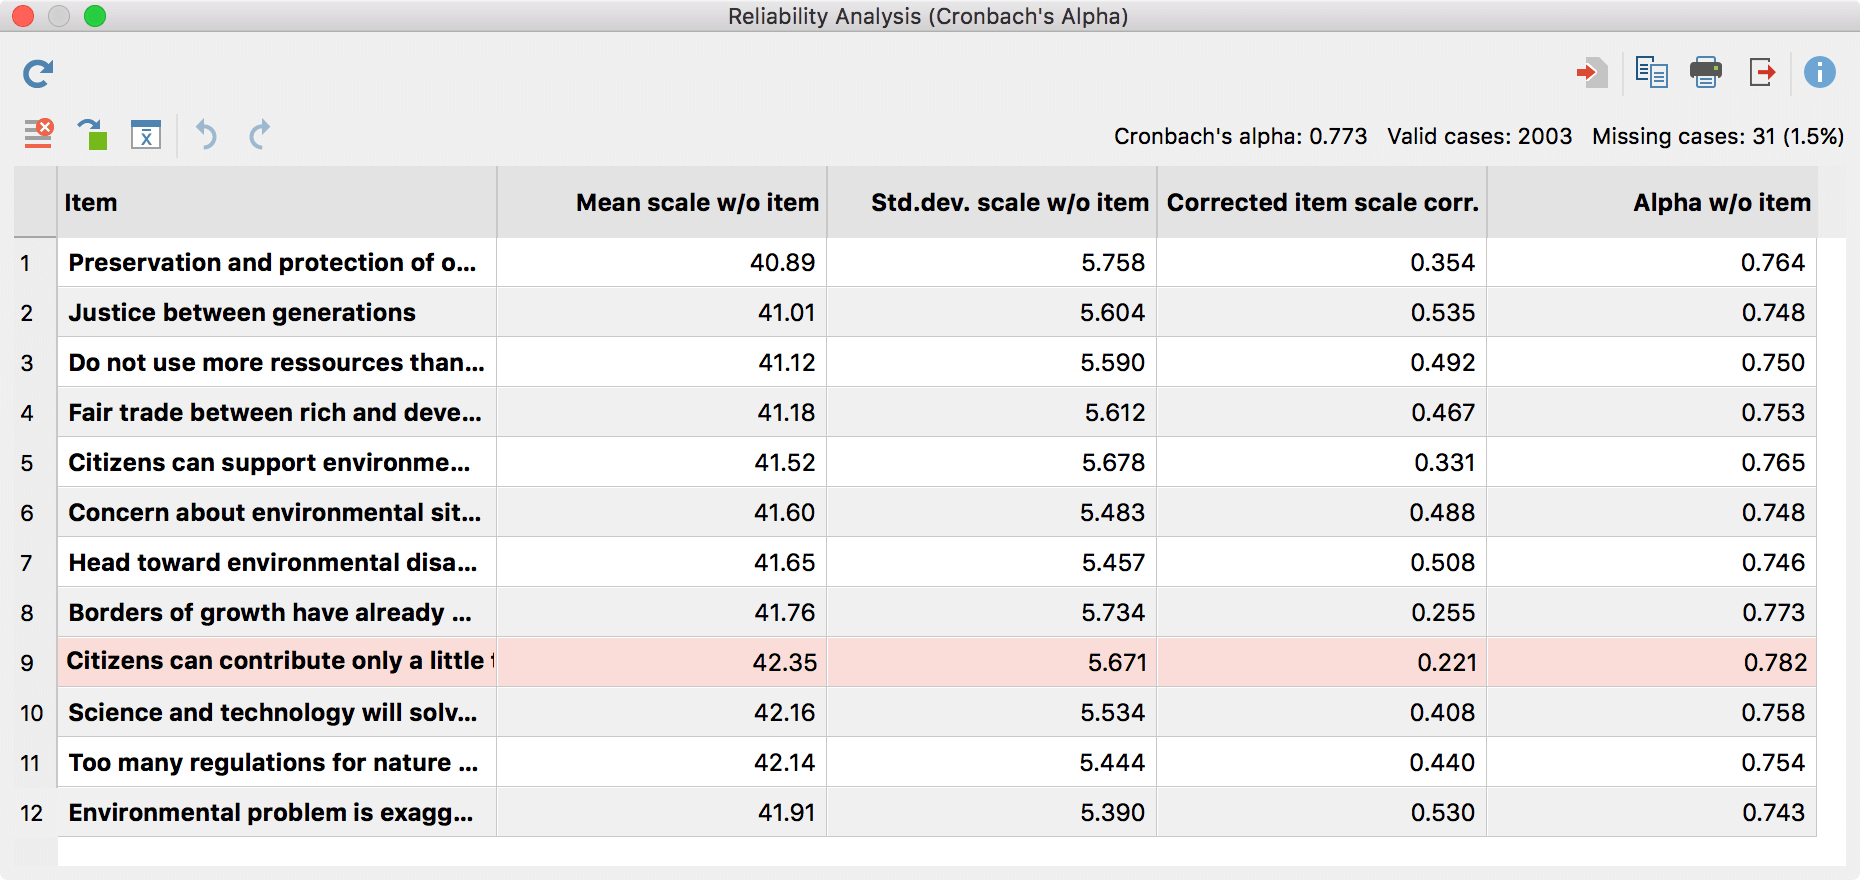
The results table contains the following information:
- Cronbach’s Alpha and the number of Valid and Missing cases are displayed at the top right.
- Item – This column contains the variable label, or if this does not exist, the variable name.
- Mean scale w/o item – The “Mean value of the scale without the item” equates the mean value of the additive scale if the item were removed from the scale.
- Std.dev. scale w/o item – The “Standard deviation of the scale without the item” equates the standard deviation (population) of the additive scale, if the item were removed from the scale.
- Corrected item scale corr. – The “Corrected item scale correlation” measures, how strongly the respective item correlates with the total scale. Usually, items with a very low correlation are not suitable for the final scale and should be removed from the item pool. MAXQDA Stats highlights the item(s) with the lowest correlation always.
- Alpha w/o item – “Cronbach’s Alpha without item” provides information about the height of Alpha if you were to remove the respective item from the scale. For example, for the twelve items above, Cronbach’s Alpha is 0.773. If you removed item no. 9 with the lowest item scale correlation, Alpha would be slightly increased to 0.782.
Overview of toolbar functions
![]() Refresh – recalls the dialog for selection of variables.
Refresh – recalls the dialog for selection of variables.
![]() Insert into output viewer – inserts the currently displayed table in the Output Viewer.
Insert into output viewer – inserts the currently displayed table in the Output Viewer.
![]() Send to QTT worksheet - inserts the current view into a new or an existing QTT worksheet.
Send to QTT worksheet - inserts the current view into a new or an existing QTT worksheet.
![]() Copy – copies the current table or highlighted area in the table in the clipboard, for example for insertion into Word.
Copy – copies the current table or highlighted area in the table in the clipboard, for example for insertion into Word.
![]() Print – prints the currently displayed table.
Print – prints the currently displayed table.
![]() Export – exports the currently displayed table in Excel format, website (HTML) format or RTF format for Word and other word processing programs.
Export – exports the currently displayed table in Excel format, website (HTML) format or RTF format for Word and other word processing programs.
![]() Remove item from scale – the selected items will be removed from the scale and the values of the results table are updated.
Remove item from scale – the selected items will be removed from the scale and the values of the results table are updated.
![]() Build scale and save as new variable – shows a dialog in which you can set a variable name and a label for a new variable that contains either the sum or the mean of the item values for each case.
Build scale and save as new variable – shows a dialog in which you can set a variable name and a label for a new variable that contains either the sum or the mean of the item values for each case.
![]() Descriptive statistics – opens a window containing descriptive values for each item and the total scale build by item summation or item means.
Descriptive statistics – opens a window containing descriptive values for each item and the total scale build by item summation or item means.
![]() Undo changes – step-by-step resetting of changes to a table (deletion and moving of rows).
Undo changes – step-by-step resetting of changes to a table (deletion and moving of rows).
![]() Redo – step-by-step restoring of changes to a table.
Redo – step-by-step restoring of changes to a table.
Interactive optimization of scale by deleting items
In MAXQDA Stats you can remove items from the scale, which leads to an immediate recalculation of all values:
- Click on an item (or several items by holding down Ctrl/⌘-key) you wish to remove.
- Then click on the symbol
 Remove item from scale or right click on the highlighted rows and select Remove from the context menu.
MAXQDA Stats updates the values in the table instantly.
To reintegrate a deleted item into the scale, you can click the Undo symbol ![]() .
.
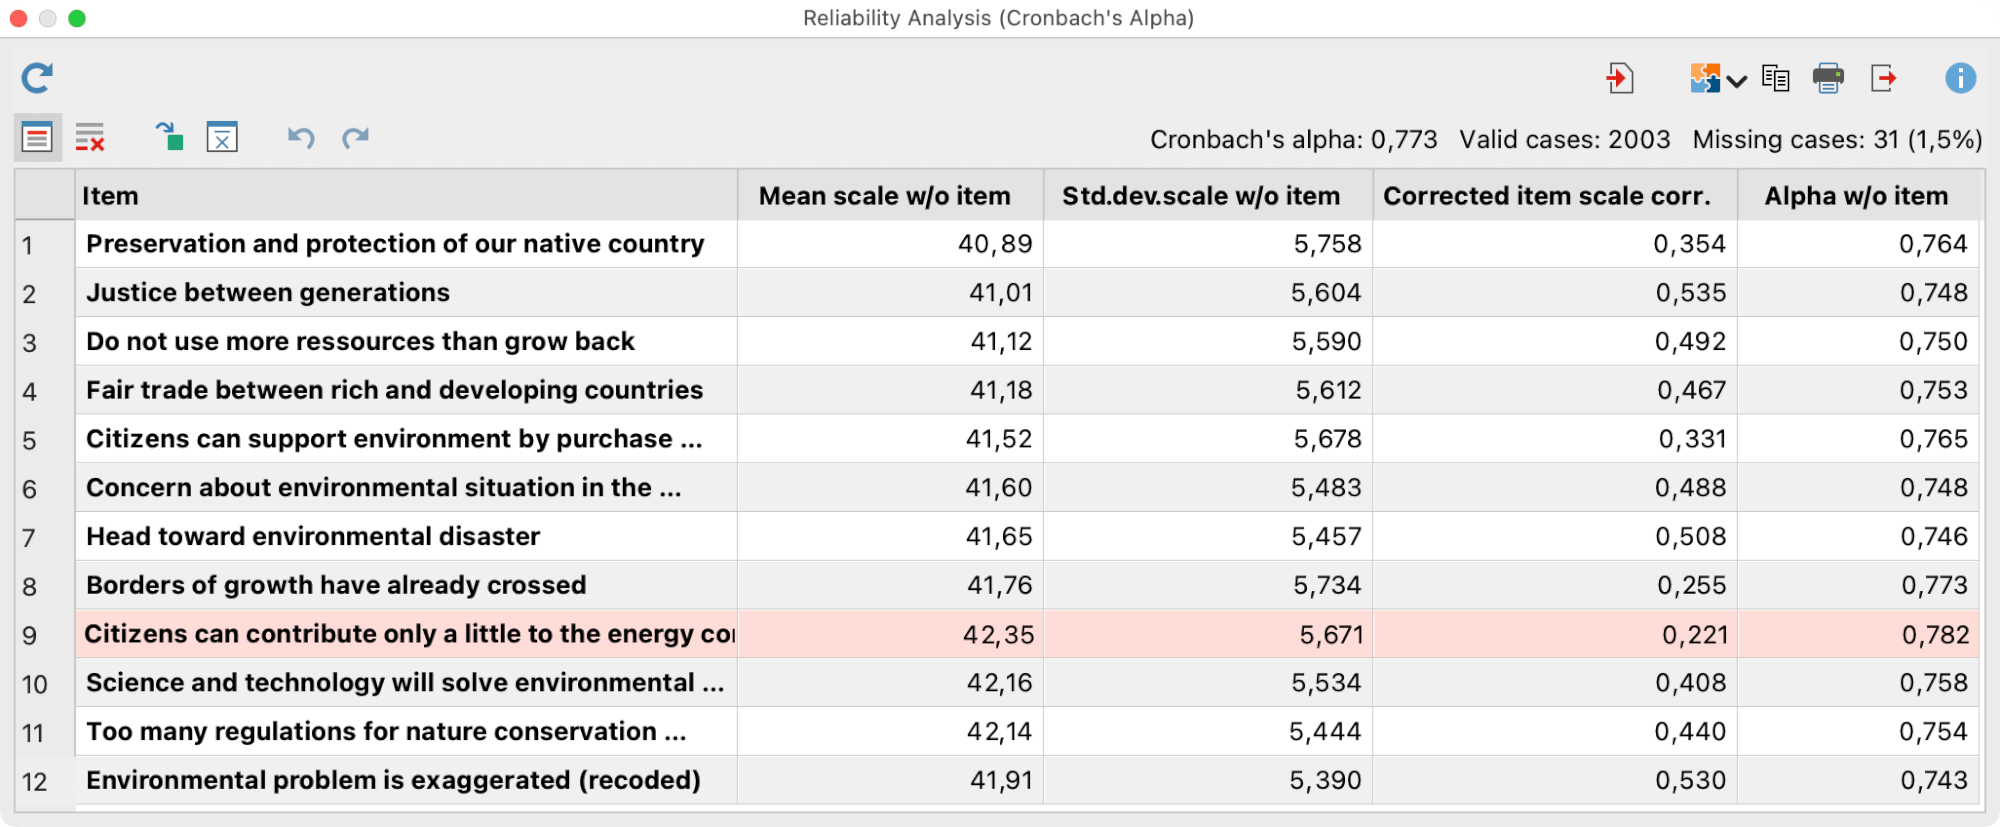
Show descriptive statistics for items and total scale
For evaluation purpose of the frequency distributions, you can get an overview of descriptive statistics for the single items and the total scale build by addition and by mean: click on the symbol Descriptive Statistics ![]() to start a calculation of typical statistical values. A window like the following will appear:
to start a calculation of typical statistical values. A window like the following will appear:
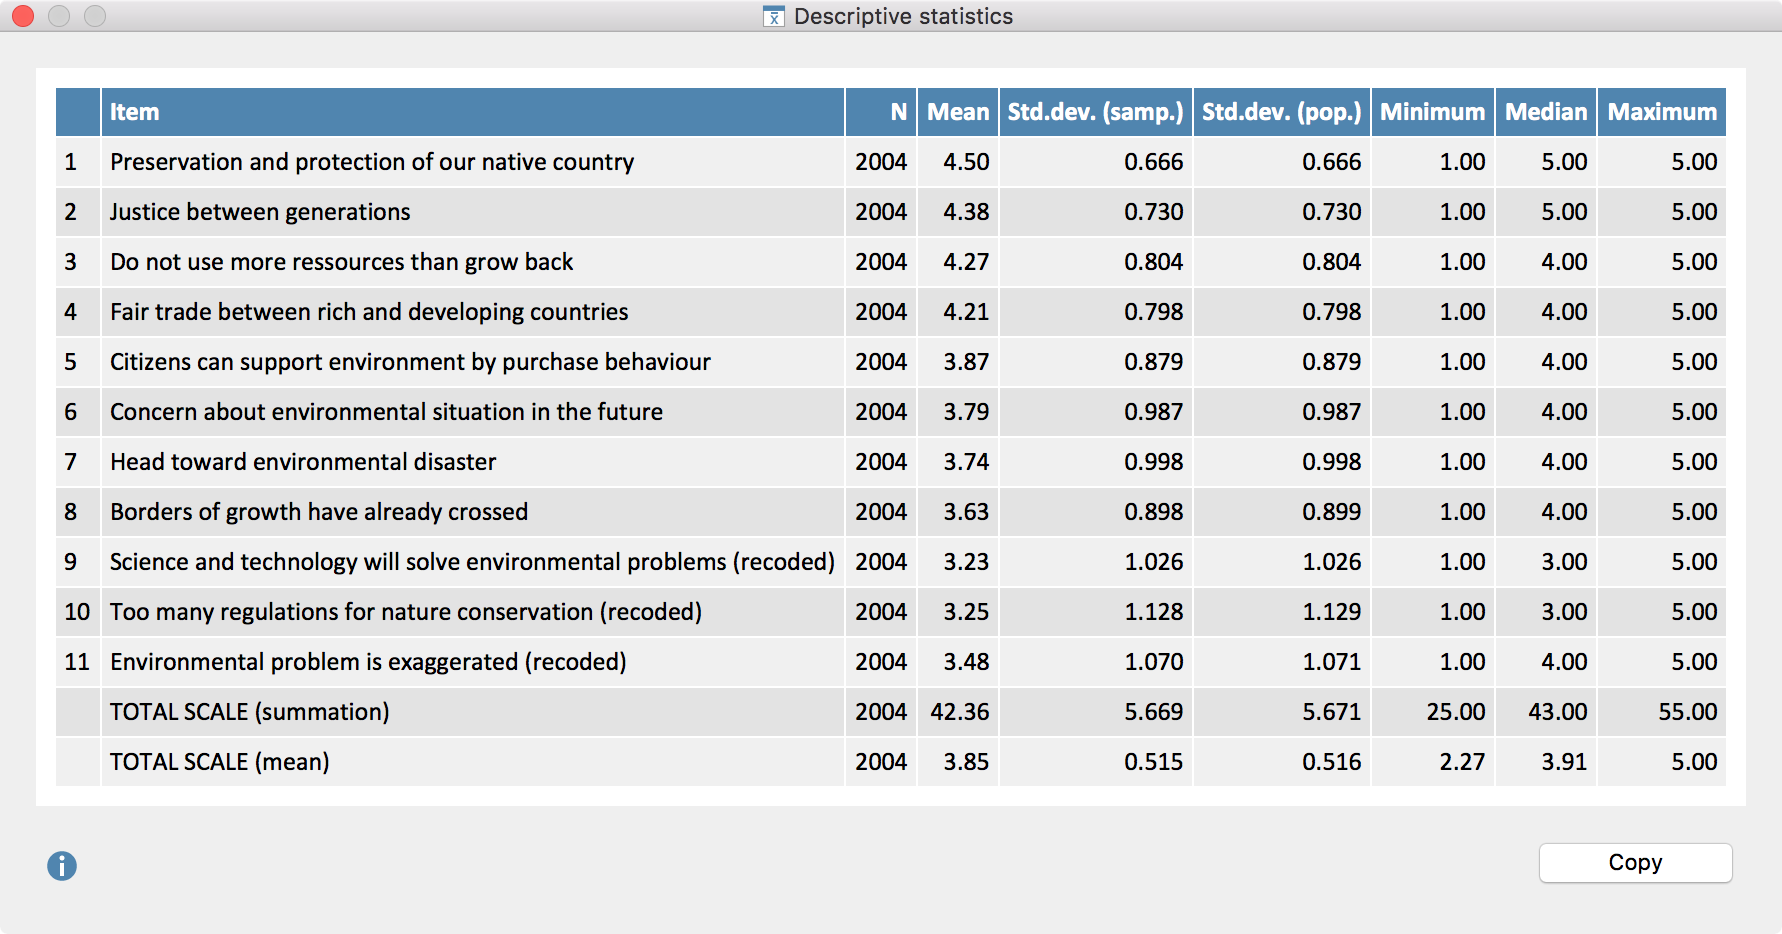
The last two rows contain the values for the total scale. For the row “TOTAL SCALE (summation)” at first a variable will be computed in the background, which contains the sum of each item value for each case. Then the statistical values for this variable will be calculated. For the row “TOTAL SCALE (mean)” a variable is first calculated which contains the mean for each case.
Build scale and save as new variable
MAXQDA Stats offers an easy possibility to combine the items shown in the result table in a scale and save it as a new variable. Click on the symbol Build scale and save as new variable ![]() to start the calculation. A dialog will appear, in which you can enter a variable name and a variable label, and set the kind of calculation.
to start the calculation. A dialog will appear, in which you can enter a variable name and a variable label, and set the kind of calculation.
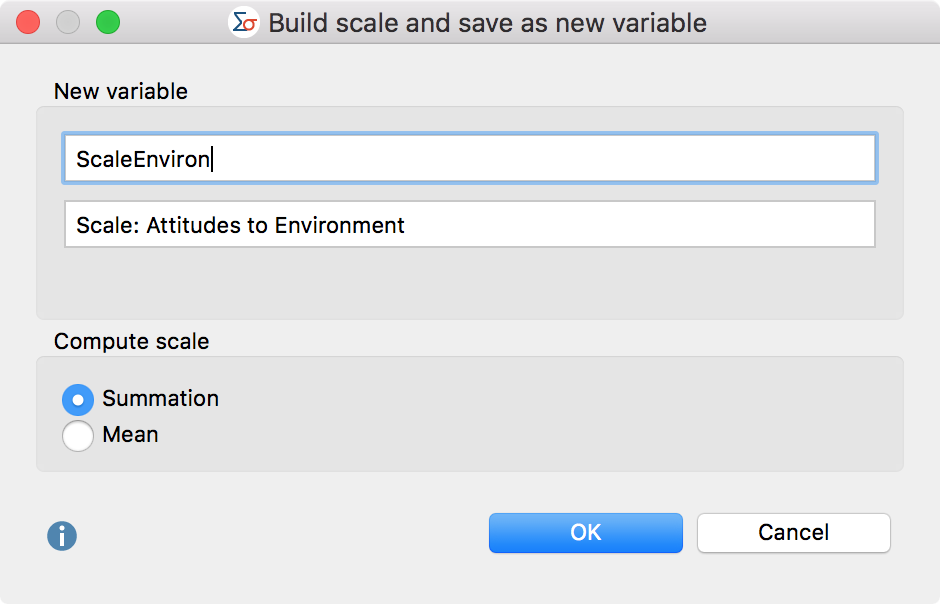
Summation – The sum of all single item values will be calculated for a case.
Mean – The arithmetic mean of all single item values will be calculated for a case.
If a value is missing for an item or the value is defined as a missing value, the newly created variable contains a (system defined) missing value for the respective case.
Transfer results table to the Output Viewer
To transfer the results table containing the computed values for the scale to the Output Viewer, click the Insert into Output Viewer ![]() icon in the toolbar.
icon in the toolbar.
MAXQDA Stats will ask if you also wish to include descriptive statistics in the Output Viewer. If you agree, an additional table will be displayed below the results table.
Transfer results to Questions – Themes – Theories
In the Questions – Themes – Theories window, you can collect and comment on all the important results of your project. Click the ![]() Send to QTT Worksheet icon in the upper right corner to save the current view in a new or existing worksheet.
Send to QTT Worksheet icon in the upper right corner to save the current view in a new or existing worksheet.
Export and print results table
Several options for exporting and printing the results table are available using the following symbols:
![]() Copy to clipboard – copies the entire table or selection to the clipboard, for example in order to paste it directly into Word.
Copy to clipboard – copies the entire table or selection to the clipboard, for example in order to paste it directly into Word.
![]() Print – starts the print process and displays a print preview, in which the settings such as margins, orientation, headers and footers can be applied.
Print – starts the print process and displays a print preview, in which the settings such as margins, orientation, headers and footers can be applied.
![]() Export – exports the table in Excel format, website (HTML) format or RTF format for Word and other word processing programs.
Export – exports the table in Excel format, website (HTML) format or RTF format for Word and other word processing programs.
