MAXQDA Stats can read Excel files of the following structure, which corresponds to that of the Data Editor: The column headers contain the variable names, and the cases form the rows:
ID | Level of education | Years of age | Profession |
1 | low | 26 | Seamstress |
2 | high | 33 | Hairdresser |
3 | medium | 32 | Mechatronics engineer |
4 | medium | 25 | Graphic designer |
… | … | … | … |
The first column (ID) is not required, but it is recommended to include a unique identification in the dataset in order to be able to definitively match the cases, especially if the data will later be analyzed in another program.
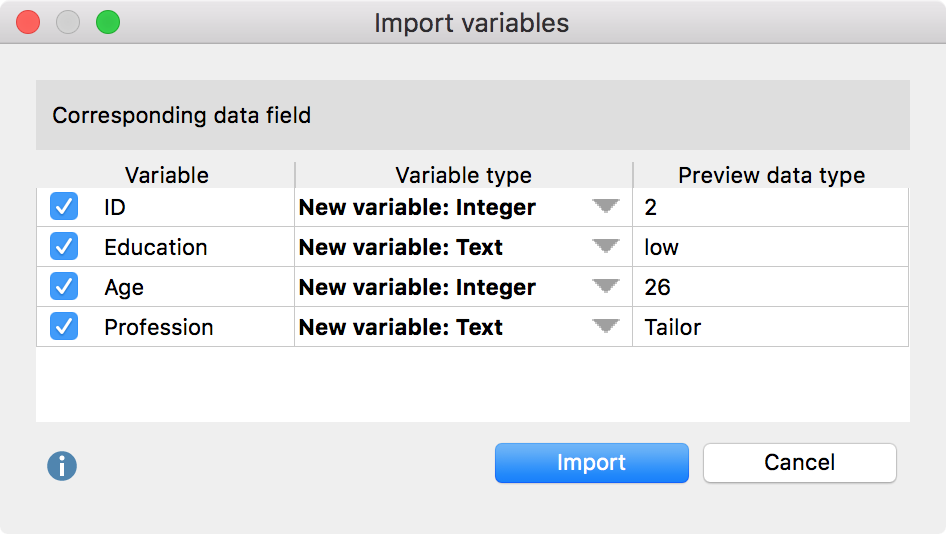
Opening an Excel file is done in the same way as described above for SPSS files, via the MAXQDA main menu function Stats or directly in MAXQDA Stats using the File function. As no information on the variable type is contained in the Excel file, a dialog box will appear in Stats following the selection of the Excel file, in which the variable type can be defined.

Indicate which of the detected variables you wish to import by checking the boxes in the first column. In the “Variable type” column, define the variable types. The data pattern can be used as a helpful indication.
After clicking Import the Excel file will be read and all Stats analysis functions will be available.
Naturally, no information on missing values or value labels will be imported, because this type of information is not included in the Excel file. The measurement level will be set according to the variable type: integer, floating point and date variables will be set at “interval”, whereas text and Boolean variables will be set at “nominal”.
