If you want to display important characteristic values for each factor level click on the icon Descriptive statistics ![]() . A table appears containing information for each factor level and the total number of cases.
. A table appears containing information for each factor level and the total number of cases.
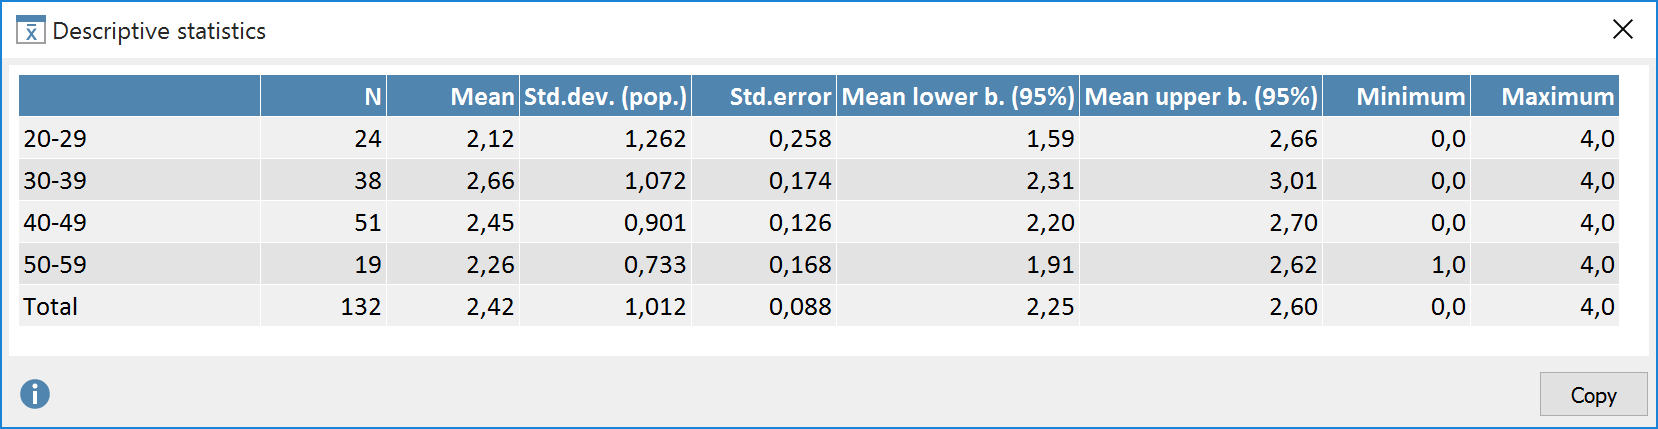
- Column “N” shows the number of valid values for each factor level.
- Column “Mean lower bound (95%)” contains the lower value of the confidence interval on the mean.