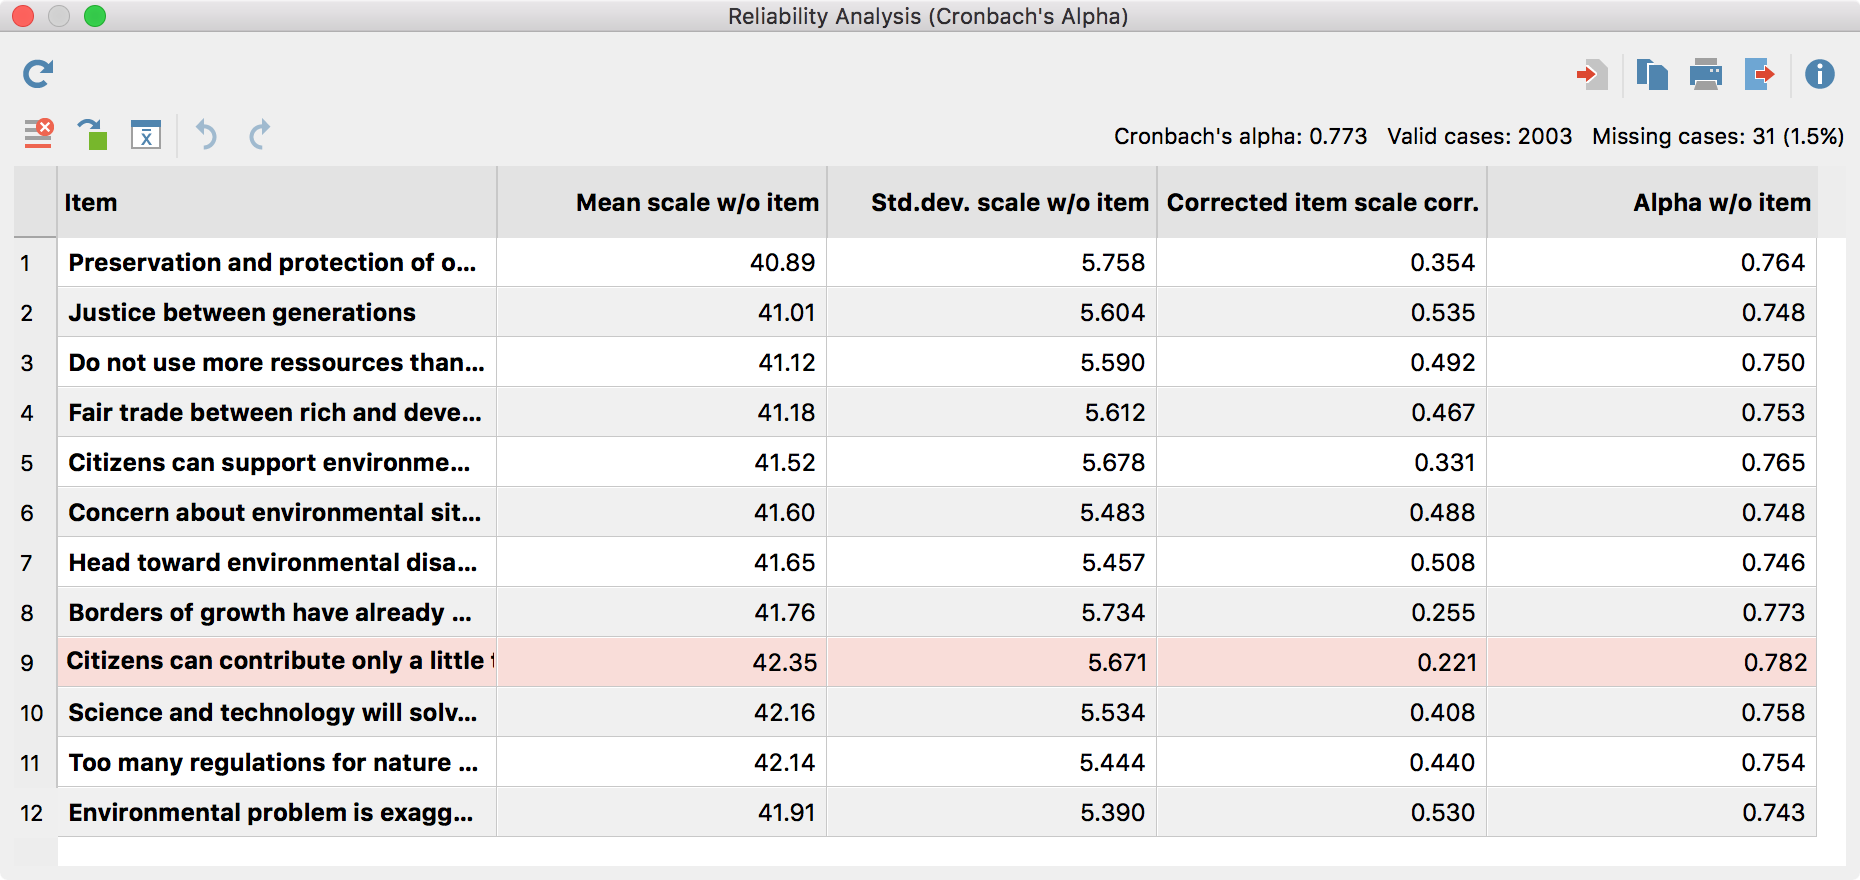
After clicking OK MAXQDA Stats will compute a results table with the following structure:

The results table contains the following information:
- Cronbach’s Alpha and the number of Valid and Missing cases are displayed at the top right.
- Item – This column contains the variable label, or if this does not exist, the variable name.
- Mean scale w/o item – The “Mean value of the scale without the item” equates the mean value of the additive scale if the item were removed from the scale.
- Std.dev. scale w/o item – The “Standard deviation of the scale without the item” equates the standard deviation (population) of the additive scale, if the item were removed from the scale.
- Corrected item scale corr. – The “Corrected item scale correlation” measures, how strongly the respective item correlates with the total scale. Usually, items with a very low correlation are not suitable for the final scale and should be removed from the item pool. MAXQDA Stats highlights the item(s) with the lowest correlation always.
- Alpha w/o item – “Cronbach’s Alpha without item” provides information about the height of Alpha if you were to remove the respective item from the scale. For example, for the twelve items above, Cronbach’s Alpha is 0.773. If you removed item no. 9 with the lowest item scale correlation, Alpha would be slightly increased to 0.782.
Hint: Items with a negative item scale correlation usually have the incorrect polarity which conflicts with the model assumptions for calculation of Cronbach’s Alpha.
