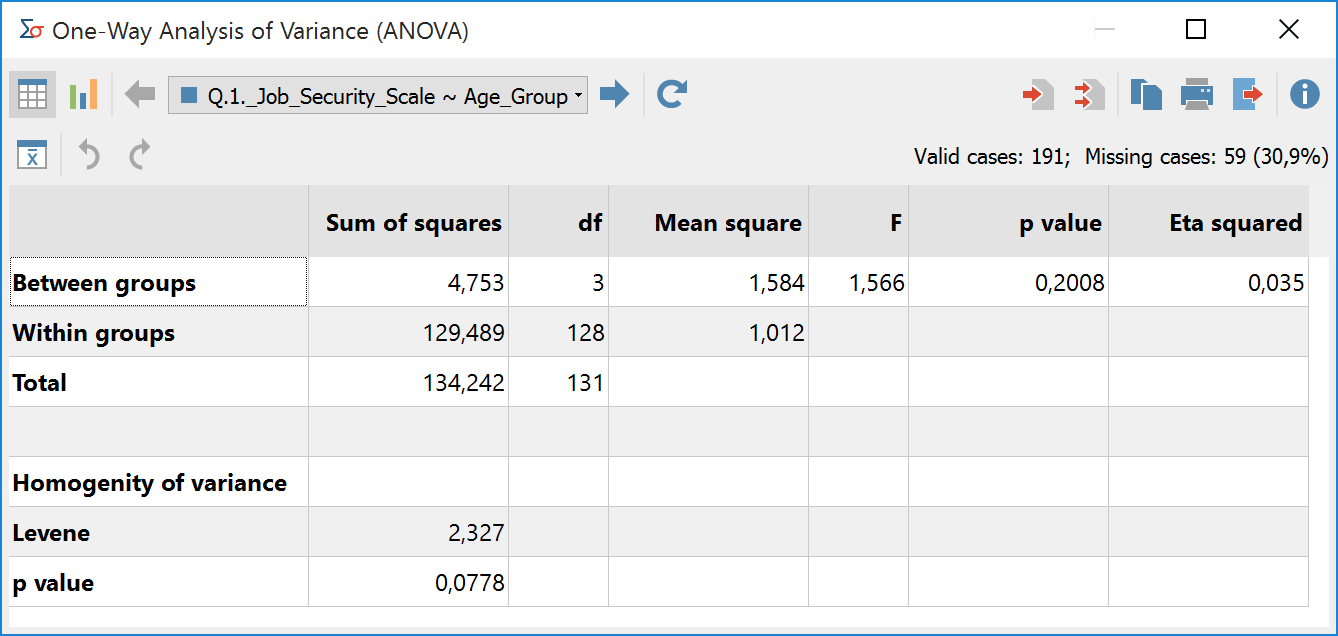
After starting the calculation by clicking OK an analysis of variance is performed for each selected dependent variable. The following results table appears for the first dependent variable. Use the blue arrows and drop down menu on the top of the window to switch to results tables for the other dependent variables.

The number of valid and missing cases for each calculated variance analysis is displayed in the upper right corner. The results table includes all the major results of the variance analysis.
- The column “sum of squares” contains the sum of squares between groups and within groups.
- The column “df” provides information on the number of degrees of freedom and allows conclusions on the number of groups that are defined by the factor. The example shows 3 +1 = 4 groups.
- The “mean squares” can be calculated by dividing the sum of squares by the degrees of freedom. The ratio of mean squares in turn results in the “F-value” whose probability of occurrence can be computed by using the F-distribution and finds expression in the “p-value”.
- “Eta-squared” is a measure of effect size and signifies the variance explained by the factor. The value is between 0 and 1 and can be interpreted as a percentage.
Testing the homogeneity of variances
A prerequisite for the calculation of a variance analysis is the homogeneity of variance within the single factor levels. This can be tested with the Levene test, the results are displayed in the lower part of the table.
Overview of Toolbar Functions
In the upper section of the results window two toolbars are located, which contain the following important functions:
![]() Table view / Chart view – switches between table and chart view for means.
Table view / Chart view – switches between table and chart view for means.
![]() Previous/Next – using the blue arrow or the selection list, switch between the results table for the dependent variables.
Previous/Next – using the blue arrow or the selection list, switch between the results table for the dependent variables.
![]() Refresh – Recalls the dialog window for selecting variables for analysis of variance.
Refresh – Recalls the dialog window for selecting variables for analysis of variance.
![]() Insert into output viewer – inserts the currently displayed table or chart in the Output Viewer.
Insert into output viewer – inserts the currently displayed table or chart in the Output Viewer.
![]() Insert all into output viewer – inserts all created tables or charts in the Output Viewer.
Insert all into output viewer – inserts all created tables or charts in the Output Viewer.
![]() Copy to clipboard – copies the current table, highlighted area in the table, or chart in the clipboard, for example for insertion into Word.
Copy to clipboard – copies the current table, highlighted area in the table, or chart in the clipboard, for example for insertion into Word.
![]() Print – prints the currently displayed table or chart.
Print – prints the currently displayed table or chart.
![]() Export – exports the currently displayed table in Excel format, website (HTML) format or RTF format for Word and other word processing programs; exports the currently displayed chart in PNG, SVG or EMF (only Windows) format.
Export – exports the currently displayed table in Excel format, website (HTML) format or RTF format for Word and other word processing programs; exports the currently displayed chart in PNG, SVG or EMF (only Windows) format.
![]() Descriptive statistics – opens a window containing descriptive values for the groups build by the factor.
Descriptive statistics – opens a window containing descriptive values for the groups build by the factor.
![]() Undo changes – step-by-step resetting of changes to a table (deletion of rows).
Undo changes – step-by-step resetting of changes to a table (deletion of rows).
![]() Redo – step-by-step restoring of changes to a table.
Redo – step-by-step restoring of changes to a table.
