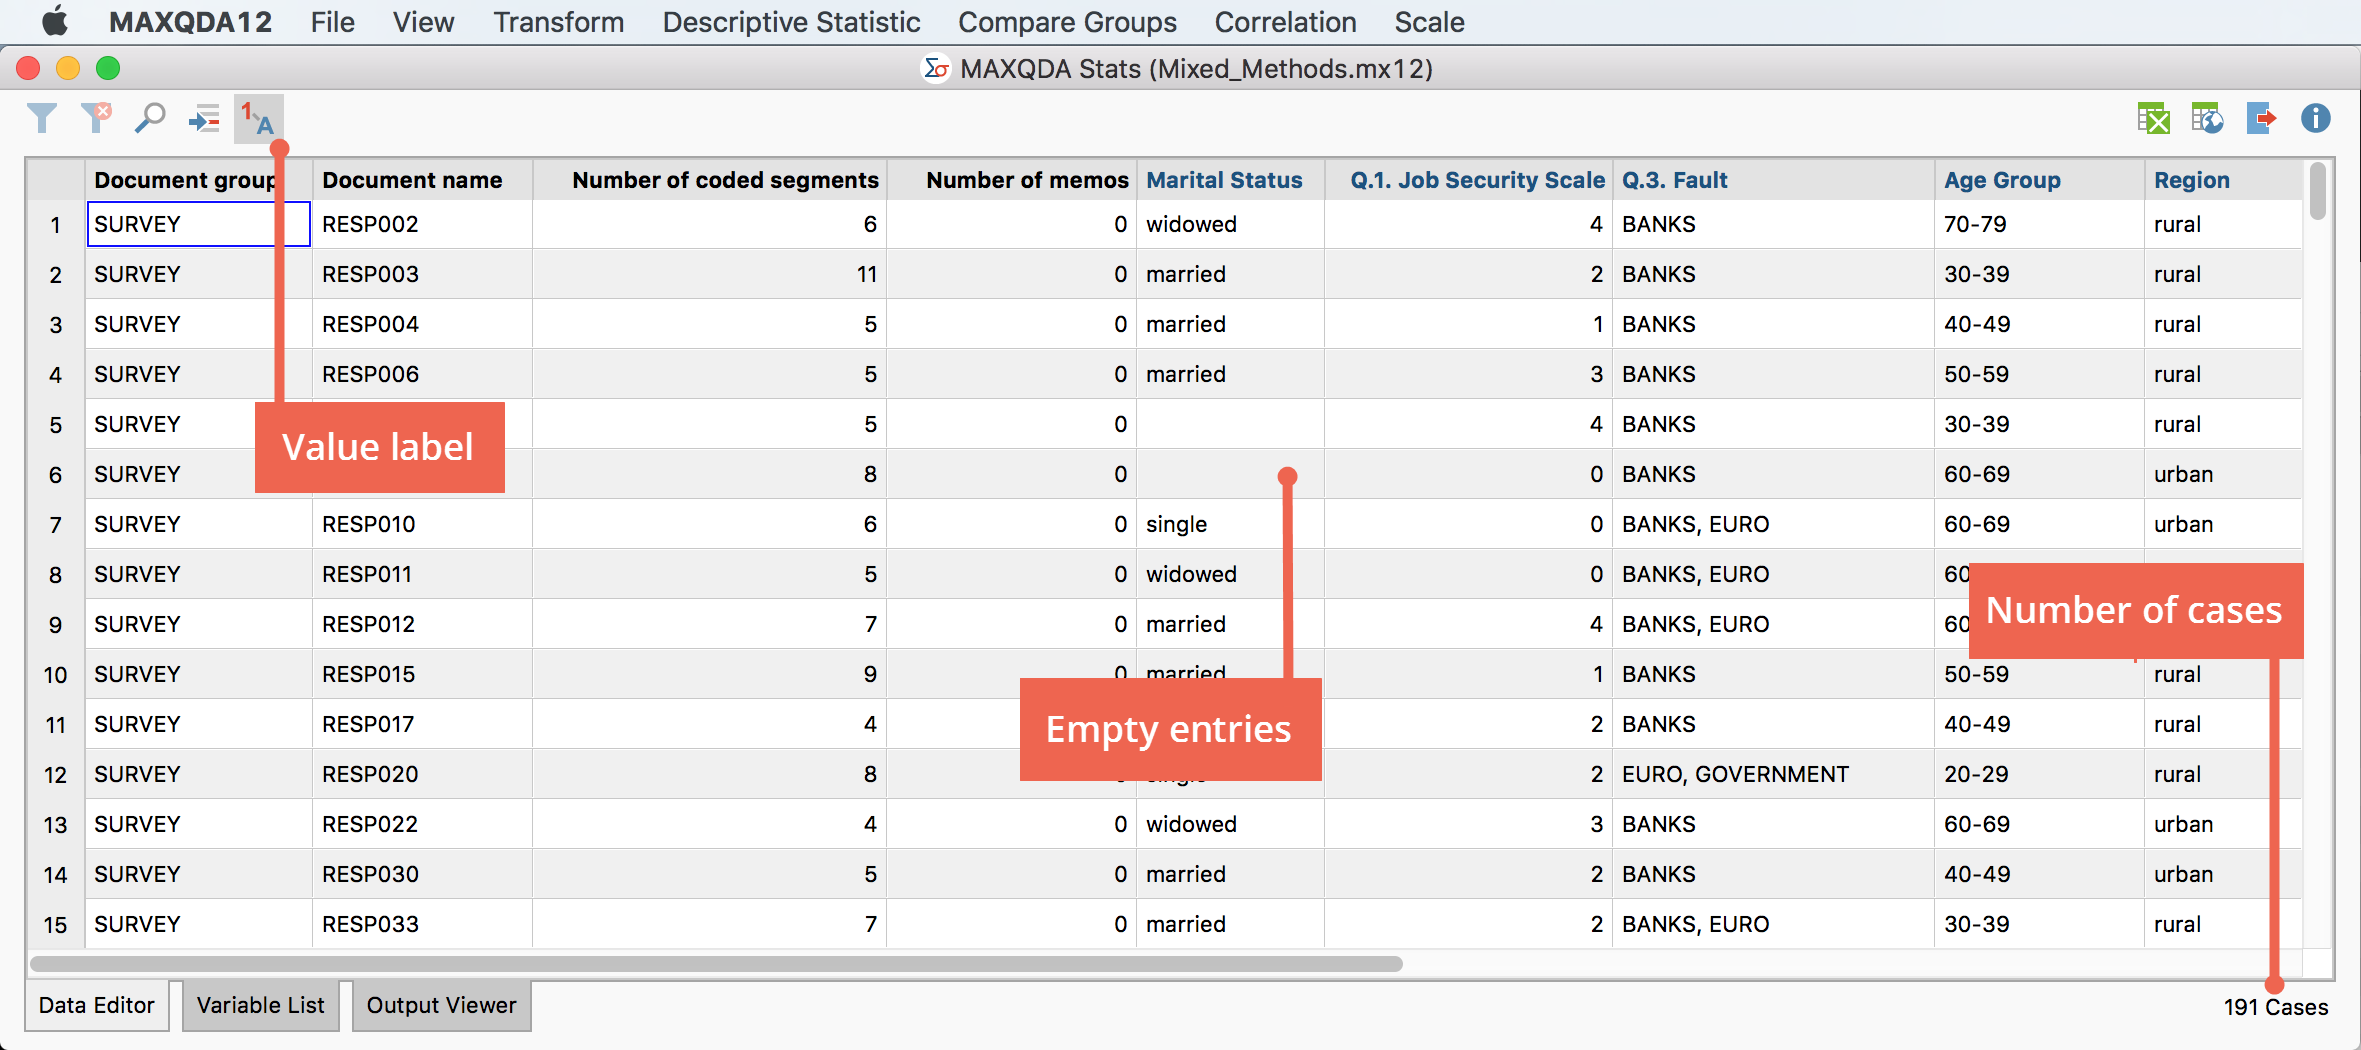
The MAXQDA Stats Data Editor displays the cases in the rows and the variables in the columns. Each case is therefore in a separate line. The following figure shows the Data Editor for a MAXQDA project, which essentially correponds to the Data Editor for the MAXQDA document variables. The first row provides information on the document “RESP002” which contains 6 coded segments and 0 memos. It refers to a survey respondent that is widowed, has a high job security level and is between 70 and 79 years old.

The first four columns in the example figure contain the MAXQDA system variables “Document group”, “Document name”, “Number of coded segments” and “Number of memos”. They are immutable in MAXQDA Stats and column headings are therefore displayed as in MAXQDA in black. The modifiable user variables are displayed in blue.
Individual columns can be hidden by right-clicking on the column header and choosing Hide column from the context menu. Using the Select columns function, also in the context menu, individual or all columns can be hidden or displayed, just like in MAXQDA.
