Correlation analysis is used to examine relationships between variables, in particular the analysis of “the more, the more”- and “the more, the less”-correlations. MAXQDA Stats supports the calculation of bivariate correlations, thus the correlation between two variables.
In order to calculate a correlation with MAXQDA Stats, select one of the following items in the main menu:
- Correlation > Pearson, usually used for interval scale variables or
- Correlation > Spearman, usually used for ordinal scale variables
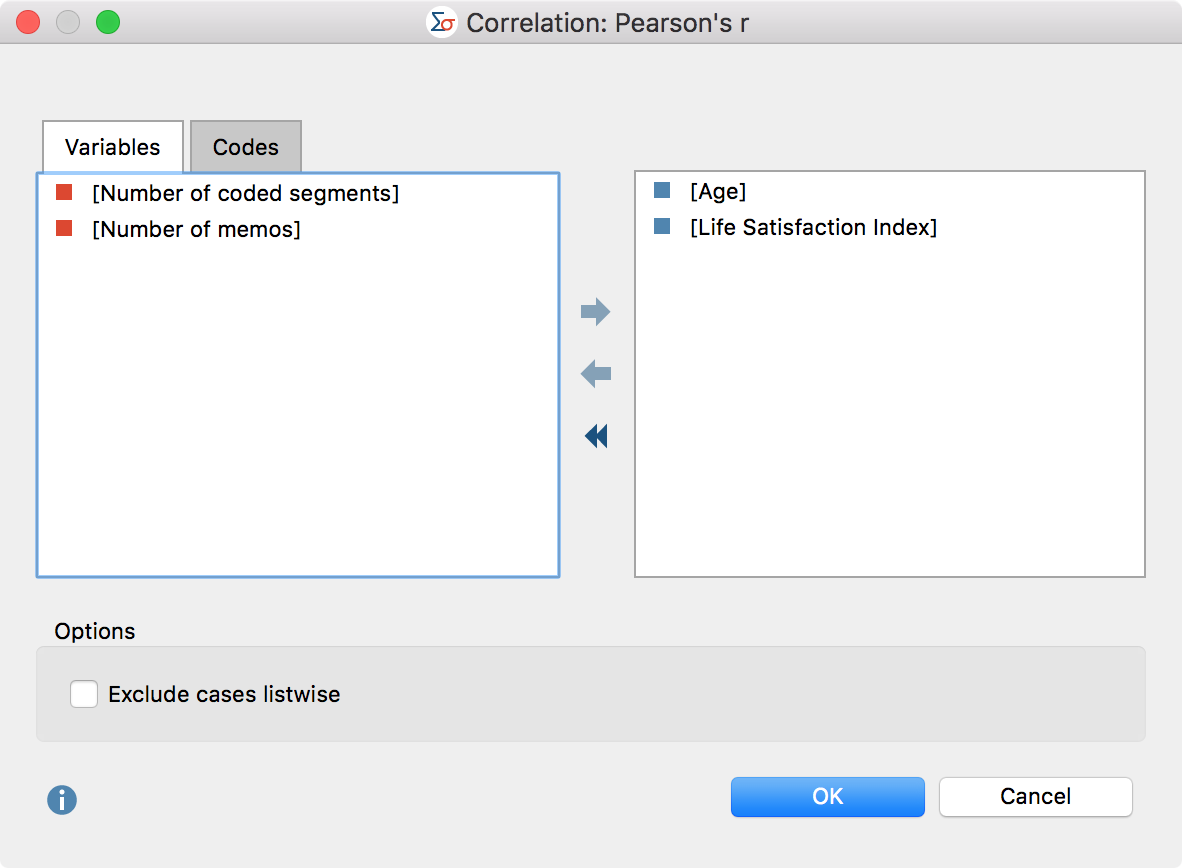
A dialog box appears that allows you to select each variable for which you wish to calculate bivariate correlations.

Variables can be selected in several ways:
- Double-click on a variable.
- Drag and drop the variable into the right window pane.
- Select one or multiple variables with the mouse by holding the Ctrl/Cmd key then dragging the selection into the right window pane with the mouse, or click the blue arrow in the middle of the window.
To integrate code frequencies per document into the computation of correlations, switch to the “Codes” tab and select the desired codes. (This option is available only if MAXQDA Stats was launched with the data of a MAXQDA project).
