What if drones one day took over the work of emergency physicians? If they provided care and extraction directly at the scene of an accident? Sounds like science fiction, but it’s a scenario that is actually being researched. In this blog, MAXQDA expert and healthcare analyst Matthew Loxton shows how MAXQDA 2022’s new workspace, the QTT (Questions, Themes and Theories) can be used to explore an alternative future, using scenario-based analysis (SBA) in strategic foresight as an example.
What is the advantage of QDA software in data analysis?
Before I go into detail about MAXQDA’s QTT, I would like to give you a brief overview of the advantages of working with a QDA software. For us as a team it has proven to be very beneficial and I will tell you why: Software can greatly improve the quality and efficiency of research work in two ways. It can transform data, or it can guide behavior. We are typically more focused on the former, but it is sometimes the latter in which great benefit can be seen.
Review a thousand documents in seconds
Firstly, a qualitative data analysis software like MAXQDA can perform operations on data – it can sort, filter, or transform data in ways that would be impractical or impossible to do manually. In MAXDictio, for example, we can sift through a thousand documents, and rank order 2–5-word phrases by the frequency in which they occurred in the document corpus and see how many occurrences there were, across how many of the documents, and the percentage of the occurrences by document or document group.
We can then transform this into a word cloud in which the size of the font is proportional to the phrase prevalence in the document corpus. To perform this manually would be highly impractical, and to do so on demand with only a day to do it would be impossible.
Likewise, we can use MAXQDA to search for specific words or phrases, autocode them, and retrieve the sentences or paragraphs in which they occurred. To do this manually in a corpus of a thousand documents would take months. With software, this is easy work that can be done accurately and in seconds. This kind of data operation greatly improves efficiency.
Improve your research with the new QTT Workspace
A second way in which qualitative data analysis software can improve efficiency and quality is to shape how we do our work. In this way, the software may not do much transformation or perform many operations on the data, but may prompt and sequence our actions in ways that improve efficiency and quality. For example, the Questions, Themes, and Theories (QTT) feature in MAXQDA 2022 performs few operations or transformations, but it shapes how a researcher works in ways that optimizes time, reduces error, and maximizes the flow of thought. This blog will address how QTT works using an example of scenario-based analysis (SBA) in strategic foresight.
The Research Project
In the SBA approach, our team creates a number of scenarios that describe plausible alternative futures that will be used for strategic planning. The goal is to help leadership to picture the conditions of potential future states, and to inform their thinking and decisions in a way that steers towards a preferred future. So rather than just letting fate deal us a future, we may have some influence on which future we eventually get. Some SBA practitioners focus only on the dialogue and the narrative or the alternate futures, but we like to ensure that the scenarios we propose are not only plausible on their face, but have earned validity through the analysis of evidence, and that every key element of the scenario has provenance that can be traced to a source document or evidence.
In a typical SBA, we might develop four alternate future scenarios – one baseline future in which everything continues along its current trajectory, and three alternatives in which we adjust the poles of the significant forces of change that we have previously identified.
For example, in a “Future of Work in Healthcare” topic, we identified four major forces of change
- Evolution and Adoption of Artificial Intelligence
- Robotics and Drones
- Biologics and nanotechnology
- Fragile Population
QTT as a Scenario Worksheet
We used the QTT function to create a worksheet for each of the plausible alternate futures, so that we could distinguish them from each other, show a supporting body of evidence for any assertions or questions, and develop a unique document that gave the reader an insight into what the world might be like in that scenario. As a means of describing a specific alternate future, we included a published fictional account that depicted a specific scenario in QTT. We used the QTT functionality to address individual questions or features of each alternate future.
In these cases, the QTT helped us to dive deeper into a force of change or emerging feature of a scenario that deserved a deeper look. The QTT guided the formulation of a response to a client question about autonomous care and patient extraction at point of injury in fifteen years from now. Refining this to a coherent research question involved using MAXMaps and Creative Coding to identify the key elements of what autonomous care might look like, and what care ensembles and technology packages this alternate future might involve.
Document as you go
Because the graphics in QTT are collected by means of a simple click of a button during coding and analysis, there was no longer a need to manually create screenshots or exports like we have done in the past. There was no need to import graphics into a report at the end of a project – the report was essentially being populated by simply sending the screens to QTT during each step in the coding and analysis. This “document as you go” process minimized the risk of forgetting documentation elements, and reduced the time needed to find and import them during the reporting phase.
QTT Location and Structure
The QTT function resides under the Analysis tab, and launching it opens a dialogue to create a new QTT worksheet, open an existing one, delete an existing one, or export a worksheet. The first three are self-explanatory, and the export function allows an existing worksheet to be exported as a formatted MS Word document.
The QTT is composed of eight forms – one covering form, and seven tabs
- 1. Covering form
- 2. Related Codes and Themes
- 3. Important Segments
- 4. Summary Tables
- 5. Related Memos
- 6. Visuals & Statistics
- 7. Concept Maps
- 8. Integration of Insights
For our purposes, seven of the forms were applicable, but I will also discuss the unused form. The covering form captures the worksheet Title, Subject, and Research Question(s), and each of the tabs contains graphics and items either sent there during the coding and analysis phase in MAXQDA, or by pasting directly into the tab. Each tab also features a section for the researcher to capture notes or insights related to the graphics.
This allows the researcher to build a reporting narrative that explains, links, and contextualizes each of the form elements in a way that drives towards a unified and coherent report.The QTT worksheet starts with the creations of a name, a description of the topic, and an outline of the research question(s) that will be explored and supported in the worksheet.
Worksheet Title
In our case, we used the worksheet name to describe and identify the alternate future being explored, and the value of the forces of change poles being specified. For example, in our case, “Autonomous Care and Extraction at Point of Injury” describes the general thought that the client expressed.
Subject-topic of study
To formulate the subject requires that we get closer to a formal language that describes the technical aspect of the client’s question, and forms the basis for creating a realistic and grounded research question. For example, in this case, we used the brain storming done with MAXMaps to sketch our first scenario and used this as our QTT Subject – “Scenario: Near-ECMO level drone-delivered autonomous hemostasis and extraction in the 15-year time horizon” (ECMO stands for “extracorporeal membrane oxygenation” in which blood is pumped through a device to infuse oxygen and back into the body).
Research Question
The QTT “Research Question” section is a place to describe the specific questions that the study will address, and is a forcing function to encourage the researcher to reflect and record what they intend to answer. This can be adjusted in an iterative manner should any of the other tabs result in a shift in perspective or understanding. In our case, we expanded this section to include a dialogue with the client. Since the output of the QTT process will be a client-readable document, we used the section to introduce the QTT process to the client.
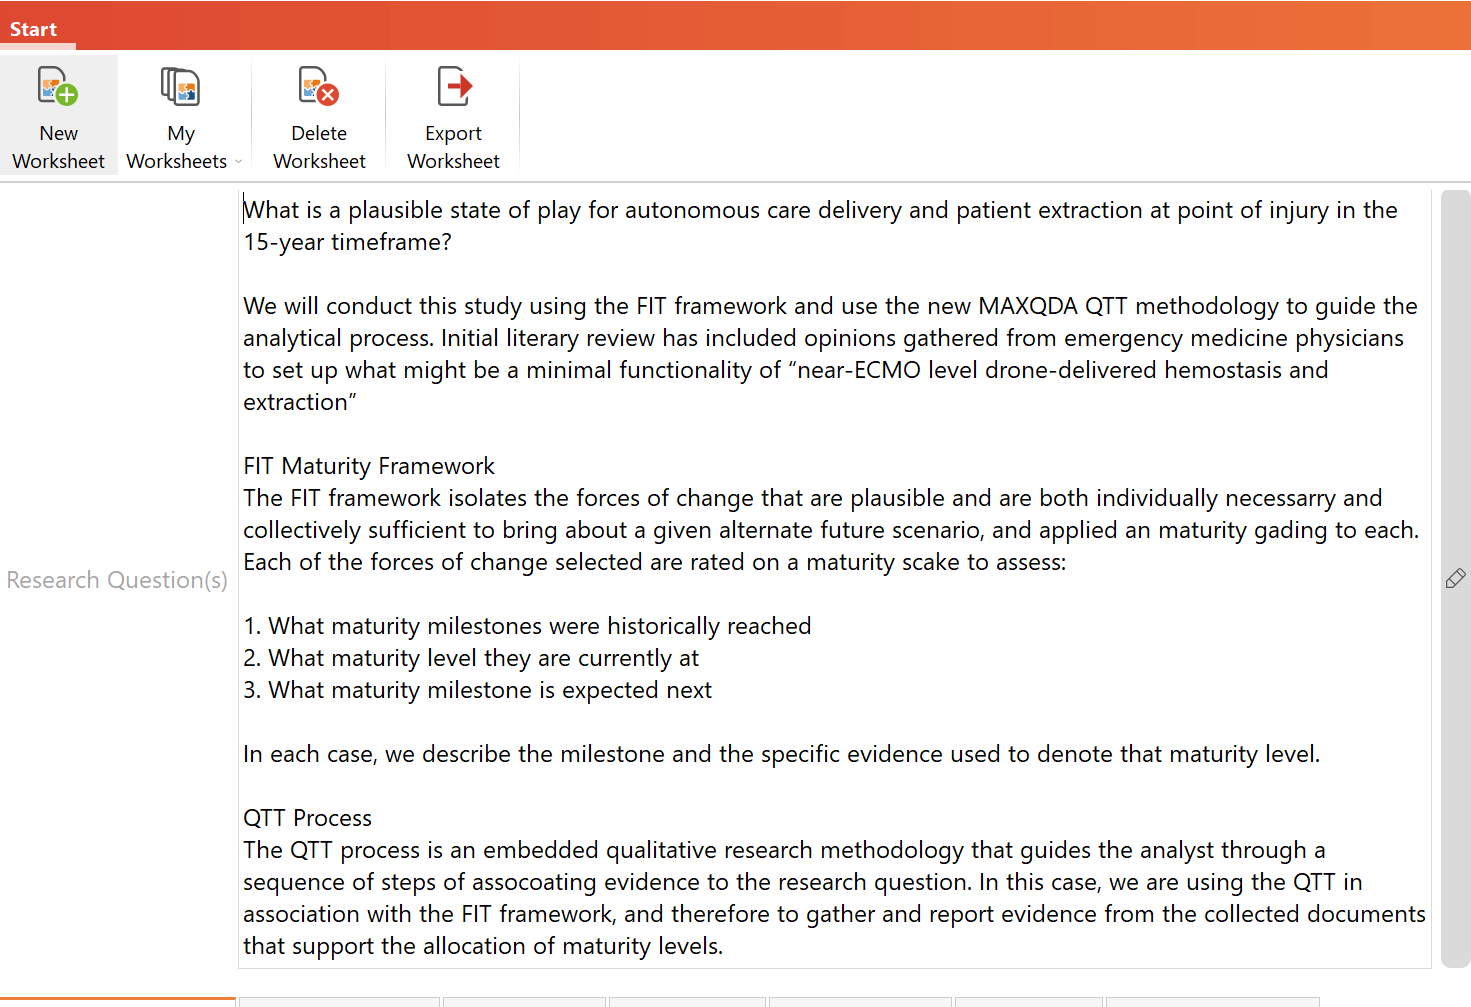
Figure 1: Research Question discussion
Codes and Themes
In the code section of this tab, the salient codes and any collective theme can be discussed, and the relevant codes revealed. Typically, this will be a subset of the overall code system, and contain only those codes that support the theme being highlighted, or which serve as examples in the discussion. In our case, we showed a small subset of a large code system – those that directly spoke to the theme of providing care at point of injury. In the process of including or trimming codes in this tab, we could feel how QTT was nudging us to focus on the research question, and to be selective in what codes were speaking to the theme.
The “Insights” section of the tab allows discussion and contextualization of the codes in terms of the research question. We used this section to describe how the codes were selected or derived, what they reveal about the structure of the research question, and to describe the scenario. We pasted in the content of the fictional short story and further discussed how the codes represented forces of change and specific conditions that were necessary for the scenario, or which arose as a result of the scenario.
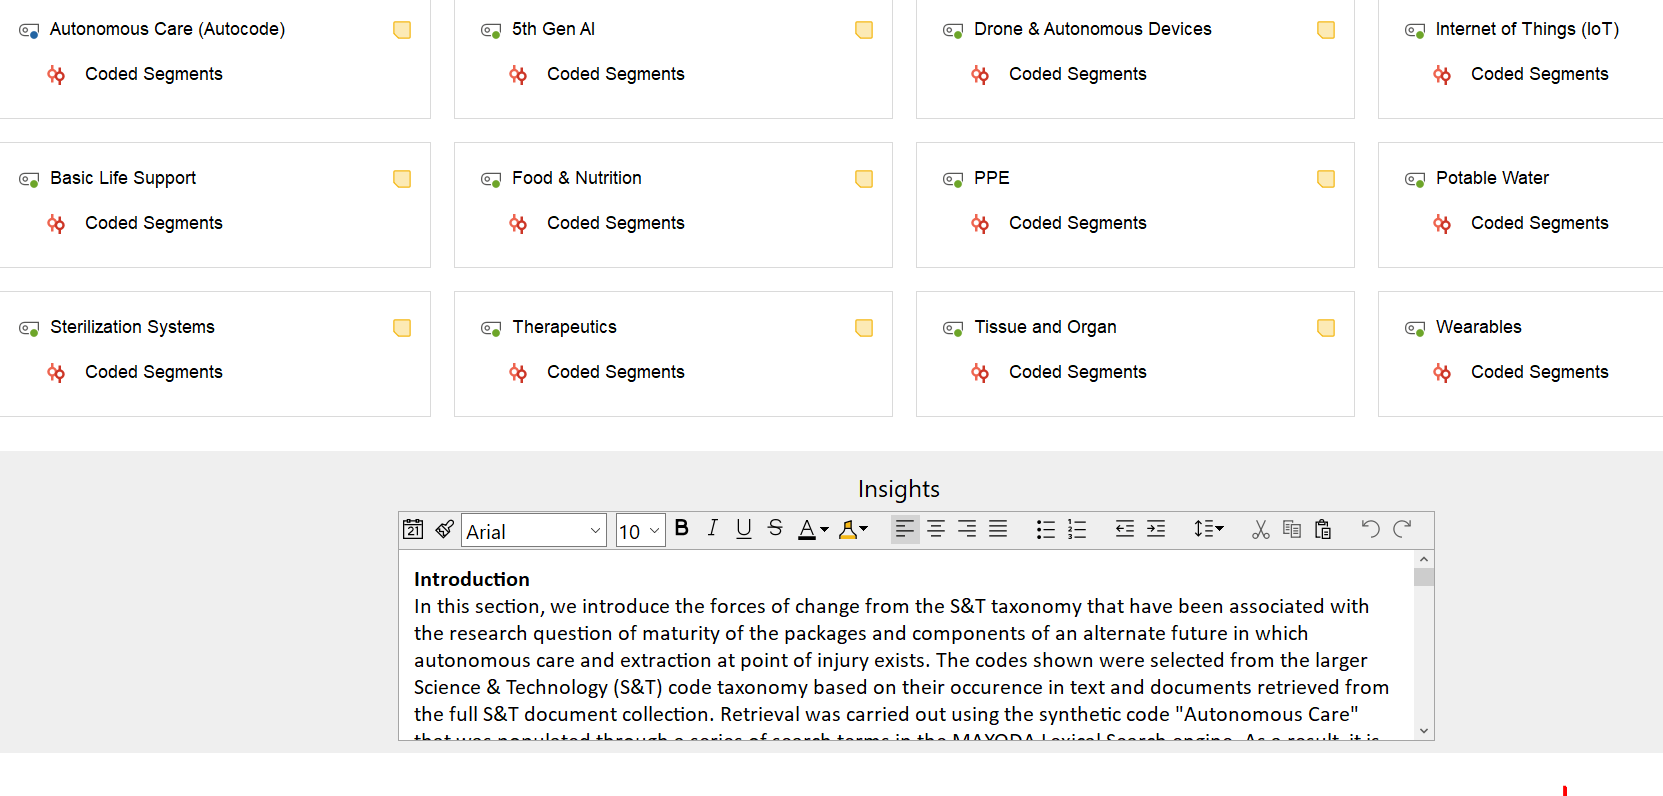
Figure 2: Codes and Themes
Important Segments
The “Important segments” tab provides a way to pull the “voice of the document” into the analysis. We used this tab to show coded segments that spoke directly to elements of our scenario, and which supported the alternate world view that we had selected. The “Insights” section of the tab allows the researcher to contextualize, explore, and highlight the voice of the document, to support their analysis. In our case, we used the segments to support elements of the scenario we had described, and highlighted specific parts of the segments to demonstrate a grounding of evidence for the scenario.
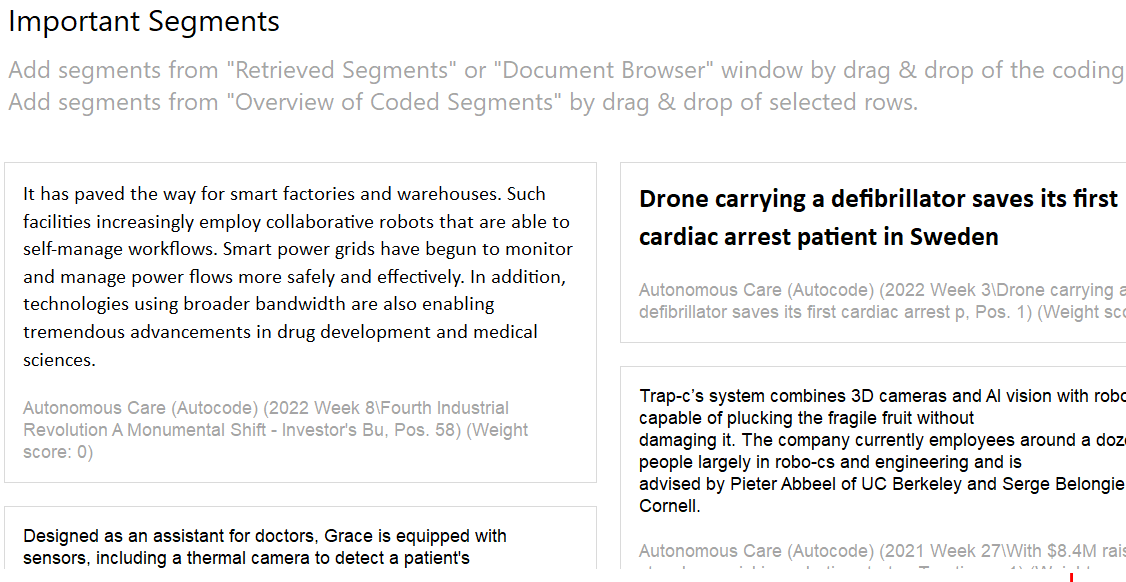
Figure 3: Important Segments
Summary Tables
The “Summary tables” tab provides an opportunity to depict and discuss the any statistics or tables, perhaps derived during mixed-methods analysis. In our case, this tab was not relevant to the discussion of a fictitious scenario or a proposed alternate future, but could later play a role if we wished to quantify any elements of the forces of change or scenario that were used.
Memos
The “Memos” tab provides a way to select memos relevant to the research question, and to support a discussion and analysis that places memo contents into context, or uses them in answering a research question. We used this tab to list the definitions of the codes used, and to explain how the codes in that context related to the scenario and the forces of change.
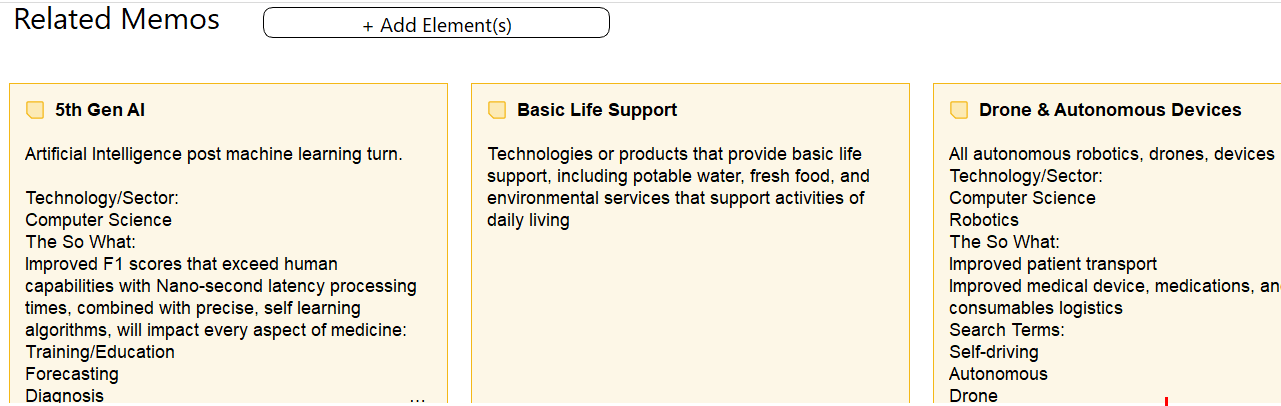
Figure 4: Related Memos
Visuals
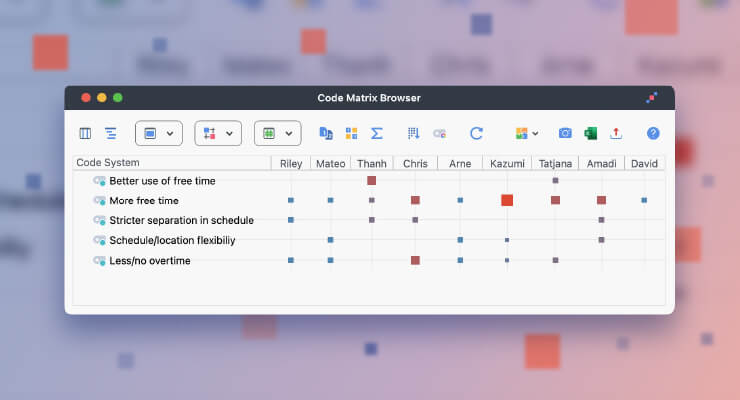
The “Visuals” tab provides a way to use graphs, maps, or other MAXQDA products to support answers to the research questions, or to supplement analysis. We used the tab to show a Word Cloud derived from the document system, and to show what phrases were common themes in the documents. In the “Insights” section for the graphic, we discussed the phrases in the cloud that were expected, and whether they supported or did not support our scenario. We also discussed surprises in what the Word Cloud revealed about common themes in the documents. The tab also gave us the opportunity to show a heat-map version of the Code Relations Browser graphic and to discuss how several elements or forces of change were coinciding and interacting. This provided a powerful way to show the client the interplay of more than one force of change that might lead to the chosen scenario.
In retrospect, we could have made greater use of this tab. Since external images can be included, there is an opportunity to expand the discussion, perhaps to talk about what further research might focus on, or issues that are impactful but tangential to the main study. For example, we could also have provided mock-up images to further augment the depiction of our scenario. From a process improvement perspective, using QTT helped us to identify several small adjustments that we could make in future projects, as well as highlighting opportunities that we could use to improve or projects in future.
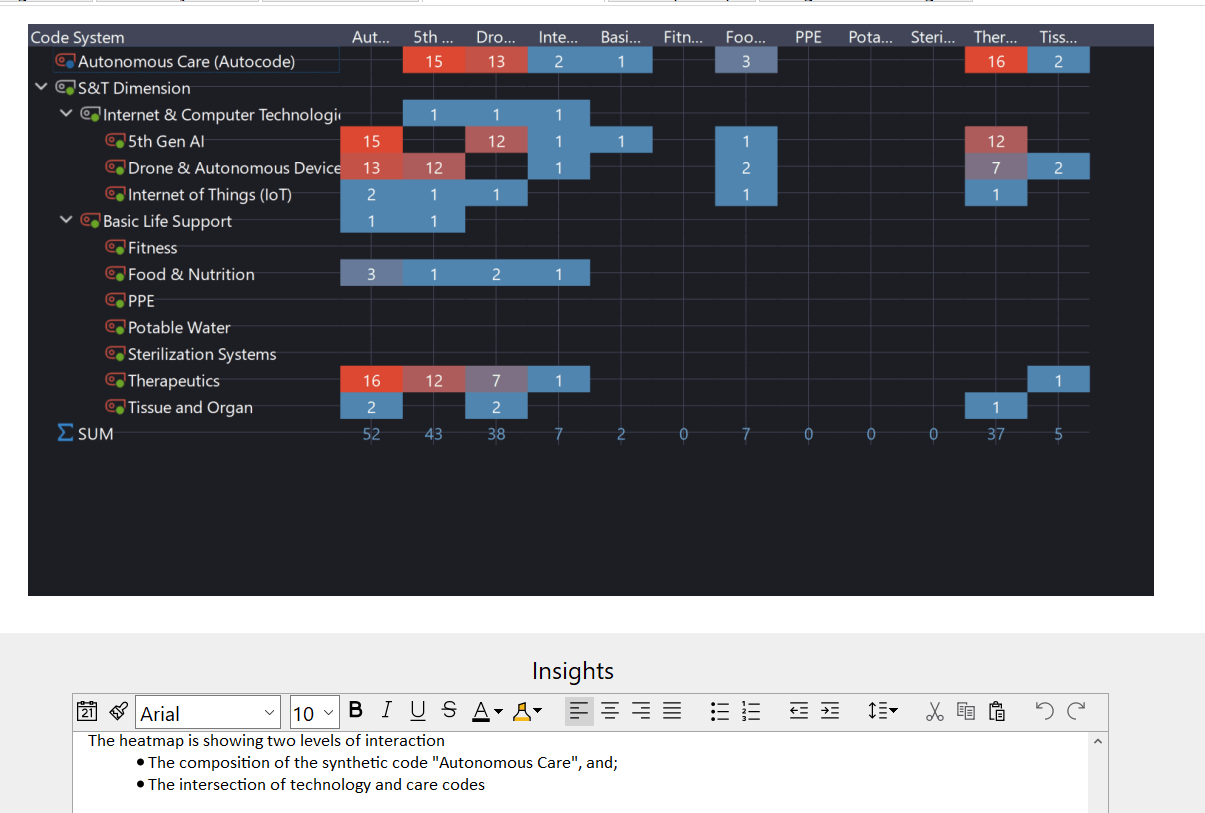
Figure 5: Supporting Visuals
Concept Maps
The “Concept Maps” tab offers the opportunity to use the outputs of Creative Coding or MAXMaps to provide the reader with a visual depiction of the core themes and arguments in the project, and provides the researcher with a useful way to anchor arguments, explanations, or analysis.
We used the tab to show and discuss the relationships between codes, between themes and codes, and between codes and forces of change. It also gave us a platform to depict and discuss the concept of a “maturity model” that was core to our development of alternate future scenarios, but which was external to the MAXQDA project itself. This ability to pull in an external supporting concept and discuss it in relationship with the elements derived from within MAXQDA, proved to be a powerful and effective way to describe the concepts to our client.
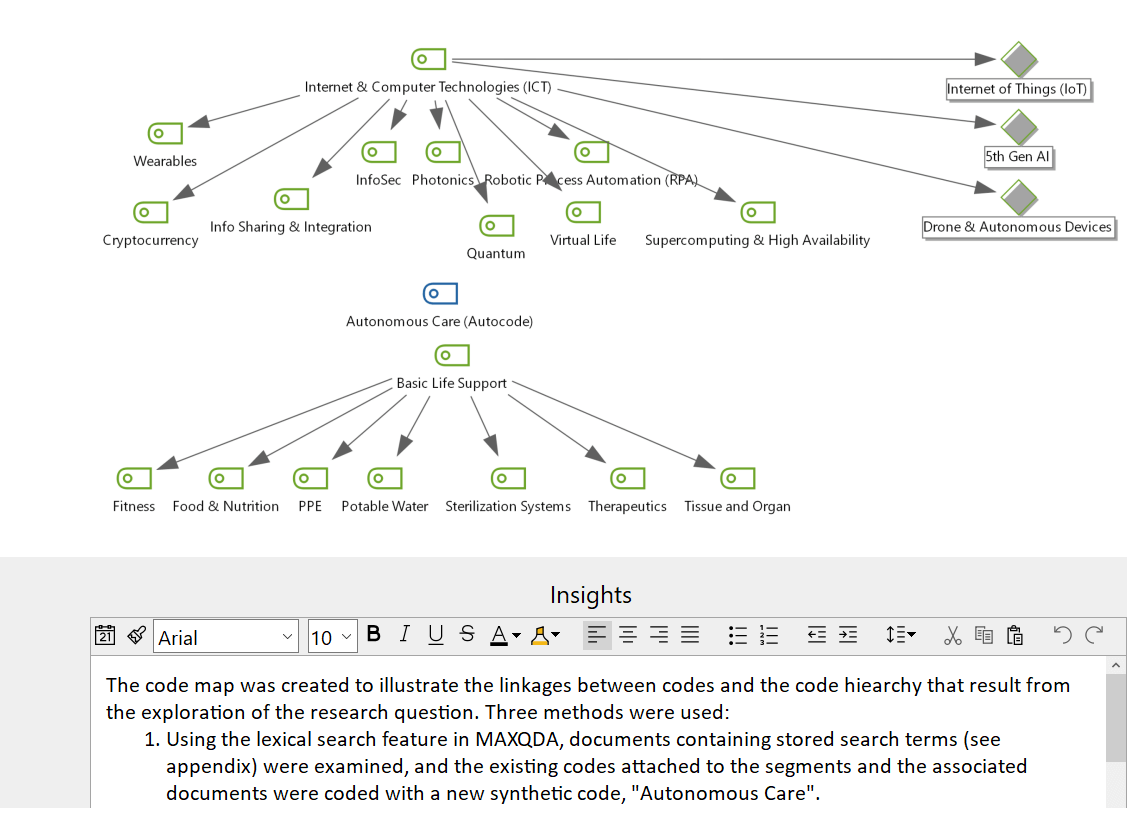
Figure 6: Concept Maps
Integration
The “Integration” tab brings together the insights, conclusions, and theories that have been developed in the QTT process, and gives the researcher a platform for discharging the research questions and offering explanation.
We used this tab extensively to weave together the various elements, forces of change, and scenario implications, and to describe a future in which providing care at the point of injury through autonomous robotics and AI was plausible, and well supported by existing evidence and technologies.
In our case, the contents of the integration tab were moved in the Word document export, and we provided our insights and conclusions in the front of the document to suit the client preference for “bottom line upfront” (BLUF), and then have the rest of the document provide the justification and support for the conclusion.
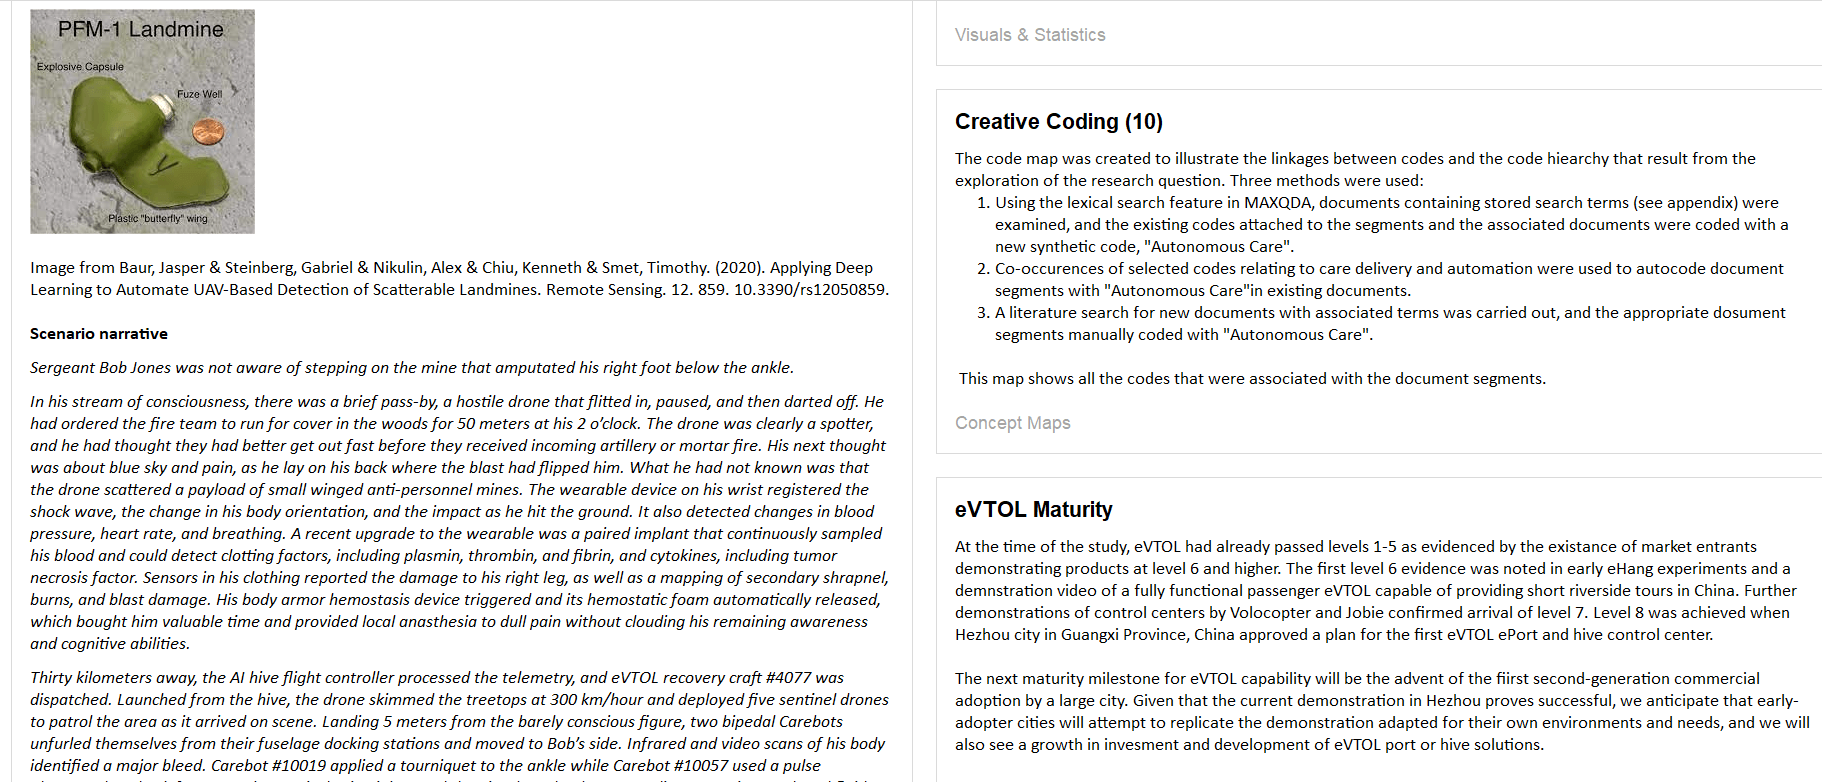
Figure 7: Integration
Conclusion: Improving Efficiency, Quality and Processes
The QTT structure and functionality acts as a guide that shapes and nudges the research and reporting processes in a way that improves the quality and comprehensiveness of reporting, and makes the transition from analysis to reporting more efficient. We were able to use QTT in an effective way to improve the quality of analysis, and take much of the effort out of reporting by making reporting largely an output of the process, rather than something done after the process. As a result of using QTT in a live project, we identified several changes to our normal processes that could result in improved efficiency and high quality of content. Therefore, QTT also functions as a process improvement tool.
About the Author
Matthew Loxton is a Senior Healthcare Analyst with the ISO 9001 registered consulting firm WBB Inc, performing process improvement (PI), quality improvement (QI), and measurement & evaluation (M&E) engagements with healthcare systems and medical facilities. Matthew uses a mixture of Knowledge Management and Lean Six Sigma to improve Health IT deployment and administrative and clinical workflow. Further whitepapers can be viewed on the WBB Healthcare page.
Matthew Loxton also trains others in the use of MAXQDA. You can find his contact info in his “MAXQDA certified trainer” profile.
 Matthew Loxton is a Senior Healthcare Analyst with the ISO 9001 registered consulting firm WBB Inc, performing process improvement (PI), quality improvement (QI), and measurement & evaluation (M&E) engagements with healthcare systems and medical facilities. Matthew uses a mixture of Knowledge Management and Lean Six Sigma to improve Health IT deployment and administrative and clinical workflow. Further whitepapers can be viewed on the WBB Healthcare page.