MAXQDA supports all types of data – text documents, tables, media files, even data from social media networks. Learn how to analyze images in MAXQDA 2018: from importing and displaying them, to coding and visualizing your results!
Analyze Images with MAXQDA 2018
Each of the images analyzed in this article is a snapshot from a project submitted to the #PictureYourResearch MAXQDA Photo Contest.
Step 1: Importing Images into MAXQDA 2018
Images are often an essential part of qualitative and mixed methods research projects. Some researchers keep a photo diary to keep track of their progress or take screenshots of important online data, while others conducting fieldwork analyze photo data as empirical evidence. One of the advantages of using MAXQDA to analyze images and other multimedia data is that no matter what kind of camera or image-capture tool you use, you won’t need to convert your image data files because MAXQDA supports images in PNG, TIF, JPG, GIF, SVG, and BMP formats!
So to start off, let’s get started with importing your images into your MAXQDA project:
- Go to the Import tab in the top left-hand corner in MAXQDA and click on the leftmost icon Documents.
- A dialog window will appear, where you can select the files (in this case images) that you wish to import. If you press and hold the Ctrl (for Windows) or cmd (for Mac) key when selecting images, you can select and import multiple files at the same time.
- All the files will be inserted into your MAXQDA project and displayed in the “Document System” window, where you can order them in a document group if you wish.
You can also choose to import your images by dragging and dropping them into your Document System, by clicking the Import Documents icon in the “Document System” window toolbar, by right-clicking the root folder in the Document System, or you can import images by using the keyboard shortcut Ctrl+D (for Windows) or cmd+D (for Mac).
Step 2: Saving Images
Images are saved in the project file by default. You can change or even delete the source file and this won’t affect the file in the project. Vice versa, all of your subsequent work in MAXQDA won’t change the source file.
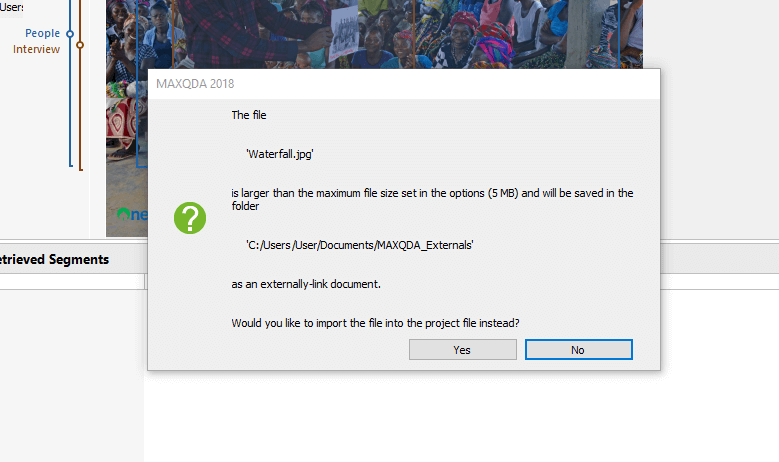
If you import large images, a dialog box will appear, in which you can choose to save them externally
The standard maximum file size is set to 5 MB per image. If the file you are trying to save is larger than 5 MB, MAXQDA will automatically generate a folder “MAXQDA_Externals” and offer to save the image in this folder. You can change the maximum file size and the folder for externally stored files in the Preferences menu.
Step 3: Analyzing Images
When you double-click an image, it will be displayed in MAXQDA’s “Document Browser” window – just like any other file you have imported into your project. The great thing about analyzing your images with MAXQDA 2018 is that there are several additional analysis tools for image files available as well!
Take a closer look
You can adjust your vantage point when analyzing image files to get the best possible analysis viewpoint: zoom in or out on the image, display it in the original size, or fit it to the window!
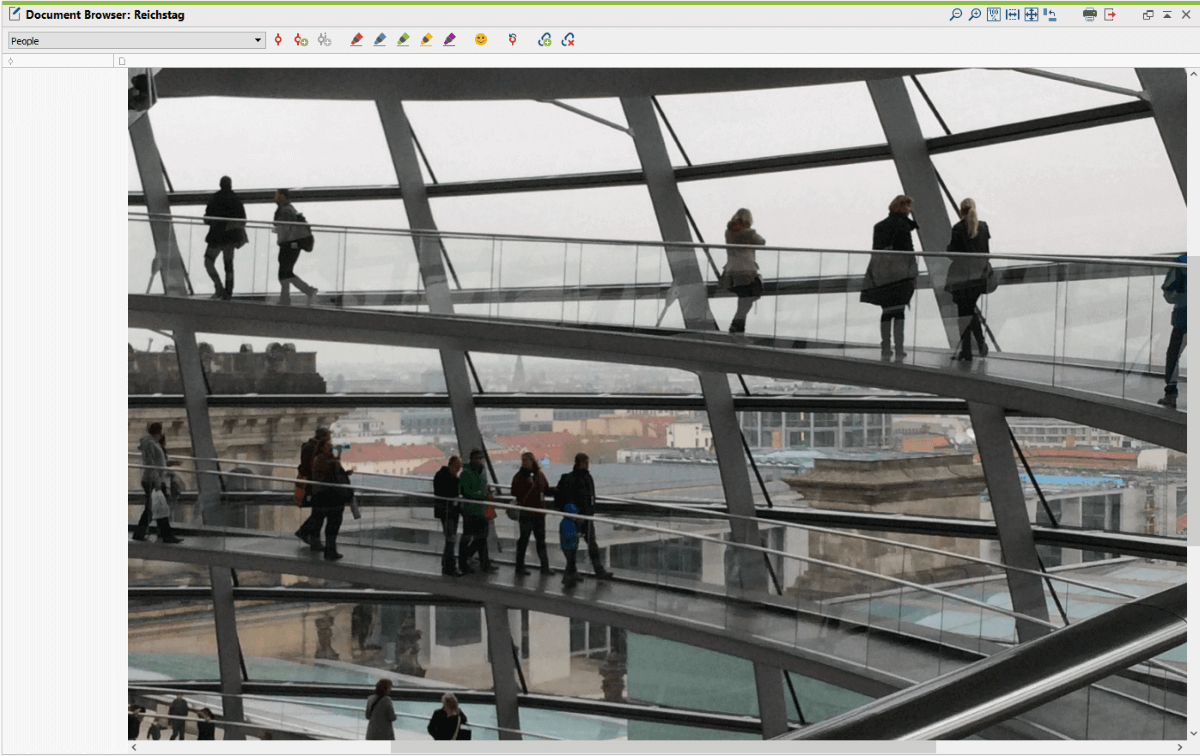
Zoomed-in image “The specificity of the dynamics of regional parliaments structures”, Berlin, Germany, 2014. Photo by Ekaterina Marmilova
You can also rotate your image clockwise if you wish, but you probably won’t need to do this because the images imported from digital cameras and mobile phones will automatically be correctly rotated by MAXQDA, making it easier to get started with the analysis right away.
Code Images
Now that you’ve successfully integrated your images into your MAXQDA project, it is time to start your image data analysis. First and foremost, we recommend taking a look at your “Code System” window to start developing a basic coding structure.
You might already have a set Code System in place from your previous work with other document formats, or you may just want to begin with a few broad codes relating to your research hypothesis and questions. How you organize your Code System is completely up to you and will most likely be guided by your project’s theoretical framework.
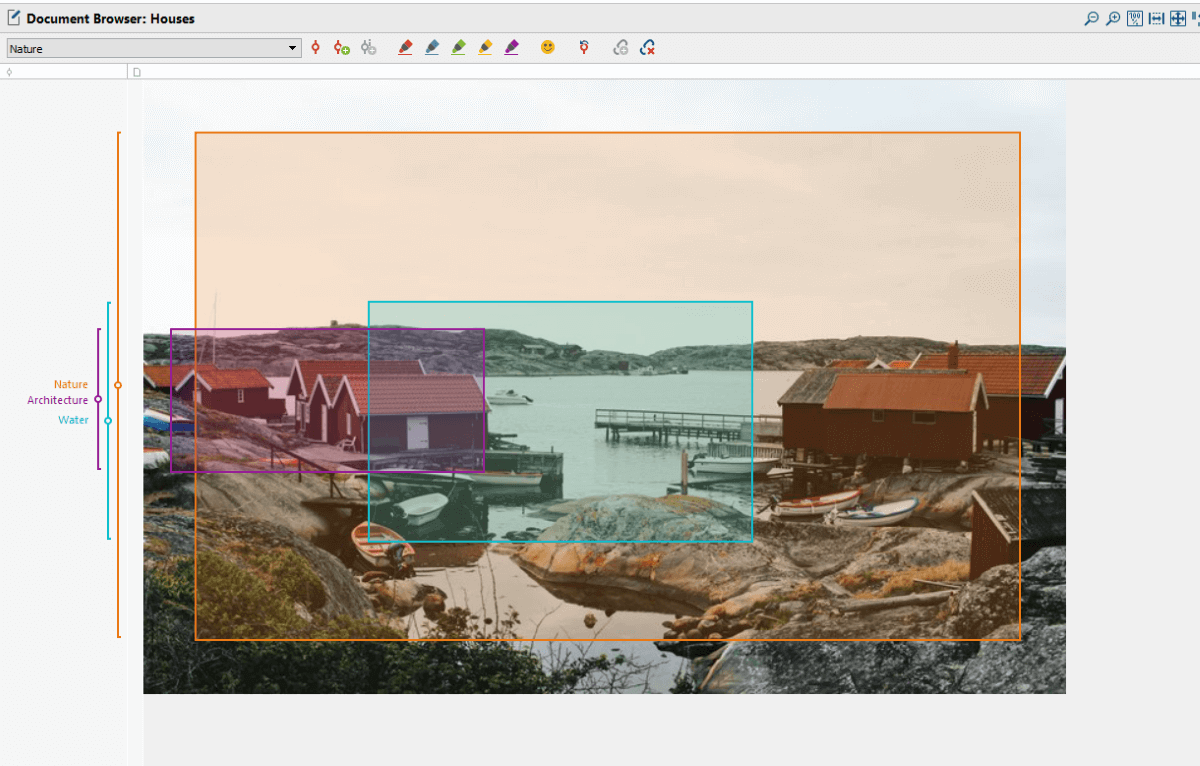
Coded image “Simplicity and pleasure“, Käringön, Sweden, 2018. Photo by Margarita Bunakova
Now it’s time to start coding your images: because MAXQDA supports all data types, you can code segments of your images just as you would code text segments! Simply use your mouse to select the particular area of the image you want to code. You then have 3 main options for assigning a code to the image segment:
- You don’t have to keep the left button of the mouse pressed: the selected area will stay highlighted and you can drag and drop a code from the Code System on it.
- You can also do the reverse and drag and drop the image segment onto a code in your Code System.
- Or right-click the highlighted image segment and choose the option “Code With New Code”.
Please note: The only MAXQDA coding function that is not available for images is the in-vivo coding function, because you clearly can’t use an image segment as a text-based code name. But don’t worry, there are other creative ways to code your images!
Coding with Emoticodes
You can use MAXQDA’s emoticode function to code quickly and easily with emoticons and symbols. You will find the icon for the emoticodes tool in the Document Browser toolbar.
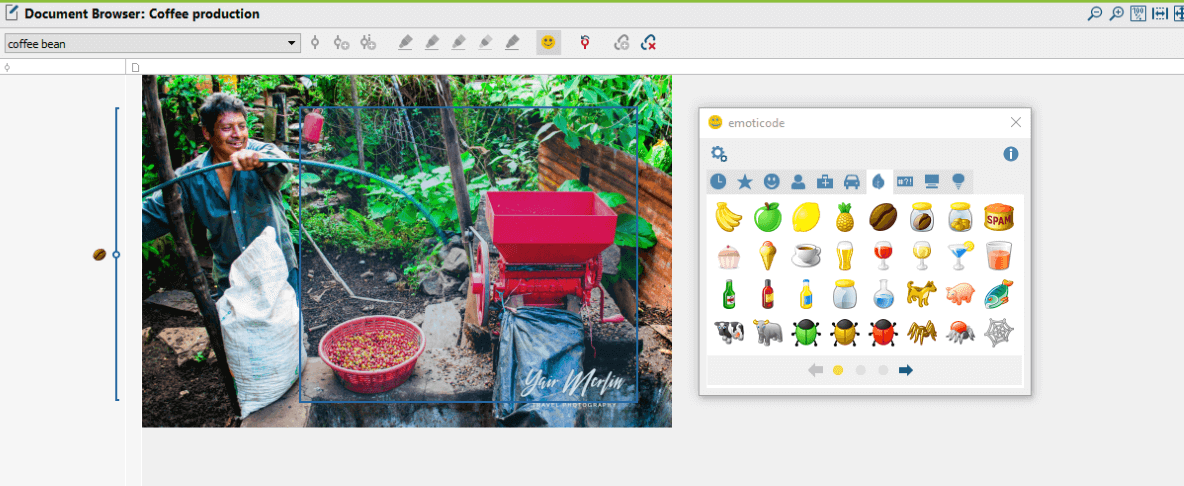
Image coded with emoticode. “Sustainable coffee is an issue of social justice”, Bellavista, Chiapas, México, 2016. Photo by Yair Merlín-Uribe
For example, we have coded this image of a coffee grower with the coffee bean emoticode. Emoticodes are fun and easy tools for conveying meaning throughout your data analysis work.
Color Coding
Just like with the text documents, you can use MAXQDA’s color coding function to analyze images. You can choose from 5 colors located in the “Document Browser” toolbar. The 5 colors (red, blue, green, yellow, magenta) are the ones that are most frequently used for highlighters in real life, which is why color coding is often called “highlighting”.
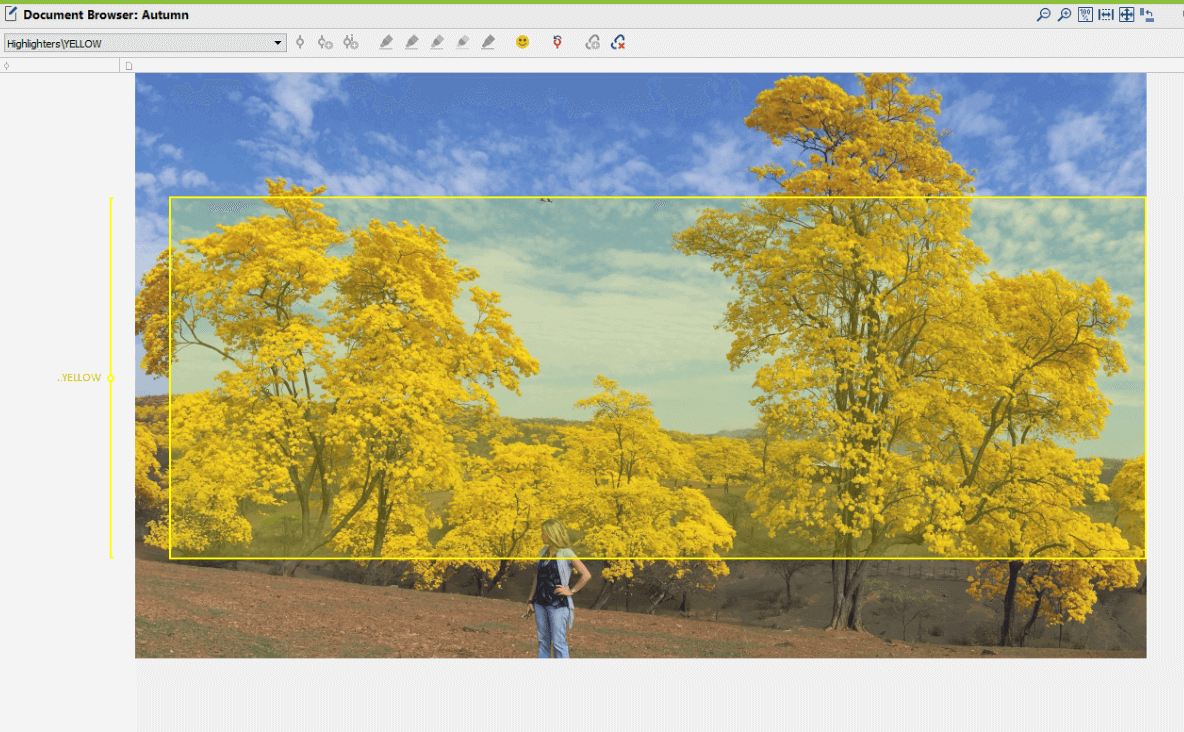
Color-coded image “Guayacanes flower“, Mangahurco, Loja, 2014. Photo by Maria del Carmen Zenck
Originally, this function was created to mark particularly interesting passages when reading through the text for the first time. This technique is very useful in the early stages of the analysis. However, you can also use color coding differently when working with pictures. For example, you can code the colors on the picture with the corresponding code color or simply mark the color that dominates on the picture. This technique can be very useful in historical or artistic-based research, such as photography or cinema studies, where the meaning of the color is often an object of the research.
Tip: Add Memos to Images
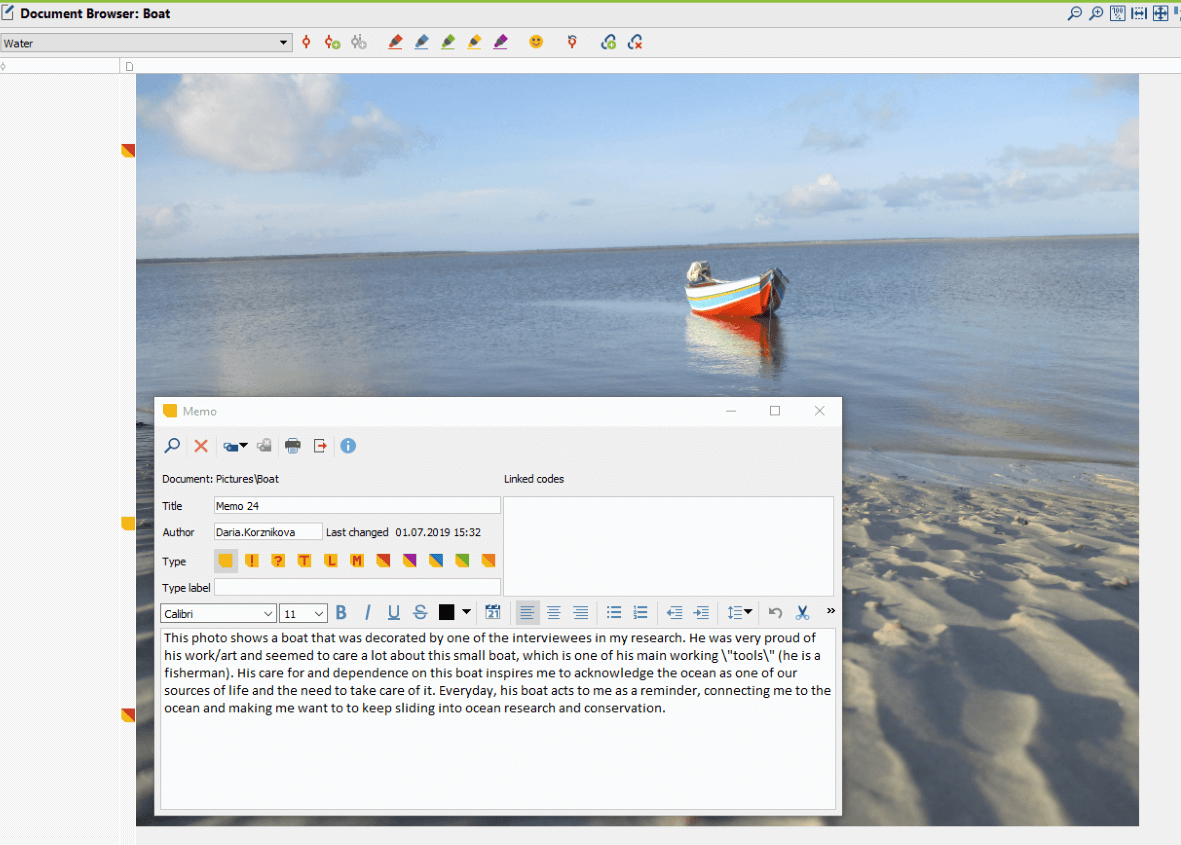
An image with an opened memo window. “Sliding into the Ocean”, Quatipuru-mirim, Pará, Brasil, 2017. Photo by Rebecca Borges
Think of memos as Post-It notes. You can attach a memo to a particular area of the image, the image as a whole, or add several different types of memos to one image. To do so, simply double-click with the left mouse button on the memo icon and the memo dialog window will appear. There are 10 different types of memo symbols available in MAXQDA and how you use them is up to you. Those using Grounded Theory, for example, might choose to use the visualization with a “T” to represent theoretical memos, the visualization with an “M” for methods memos, etc. We also highly recommend using memos to communicate information when working in teams.
Step 4: Retrieving Coded Image Segments
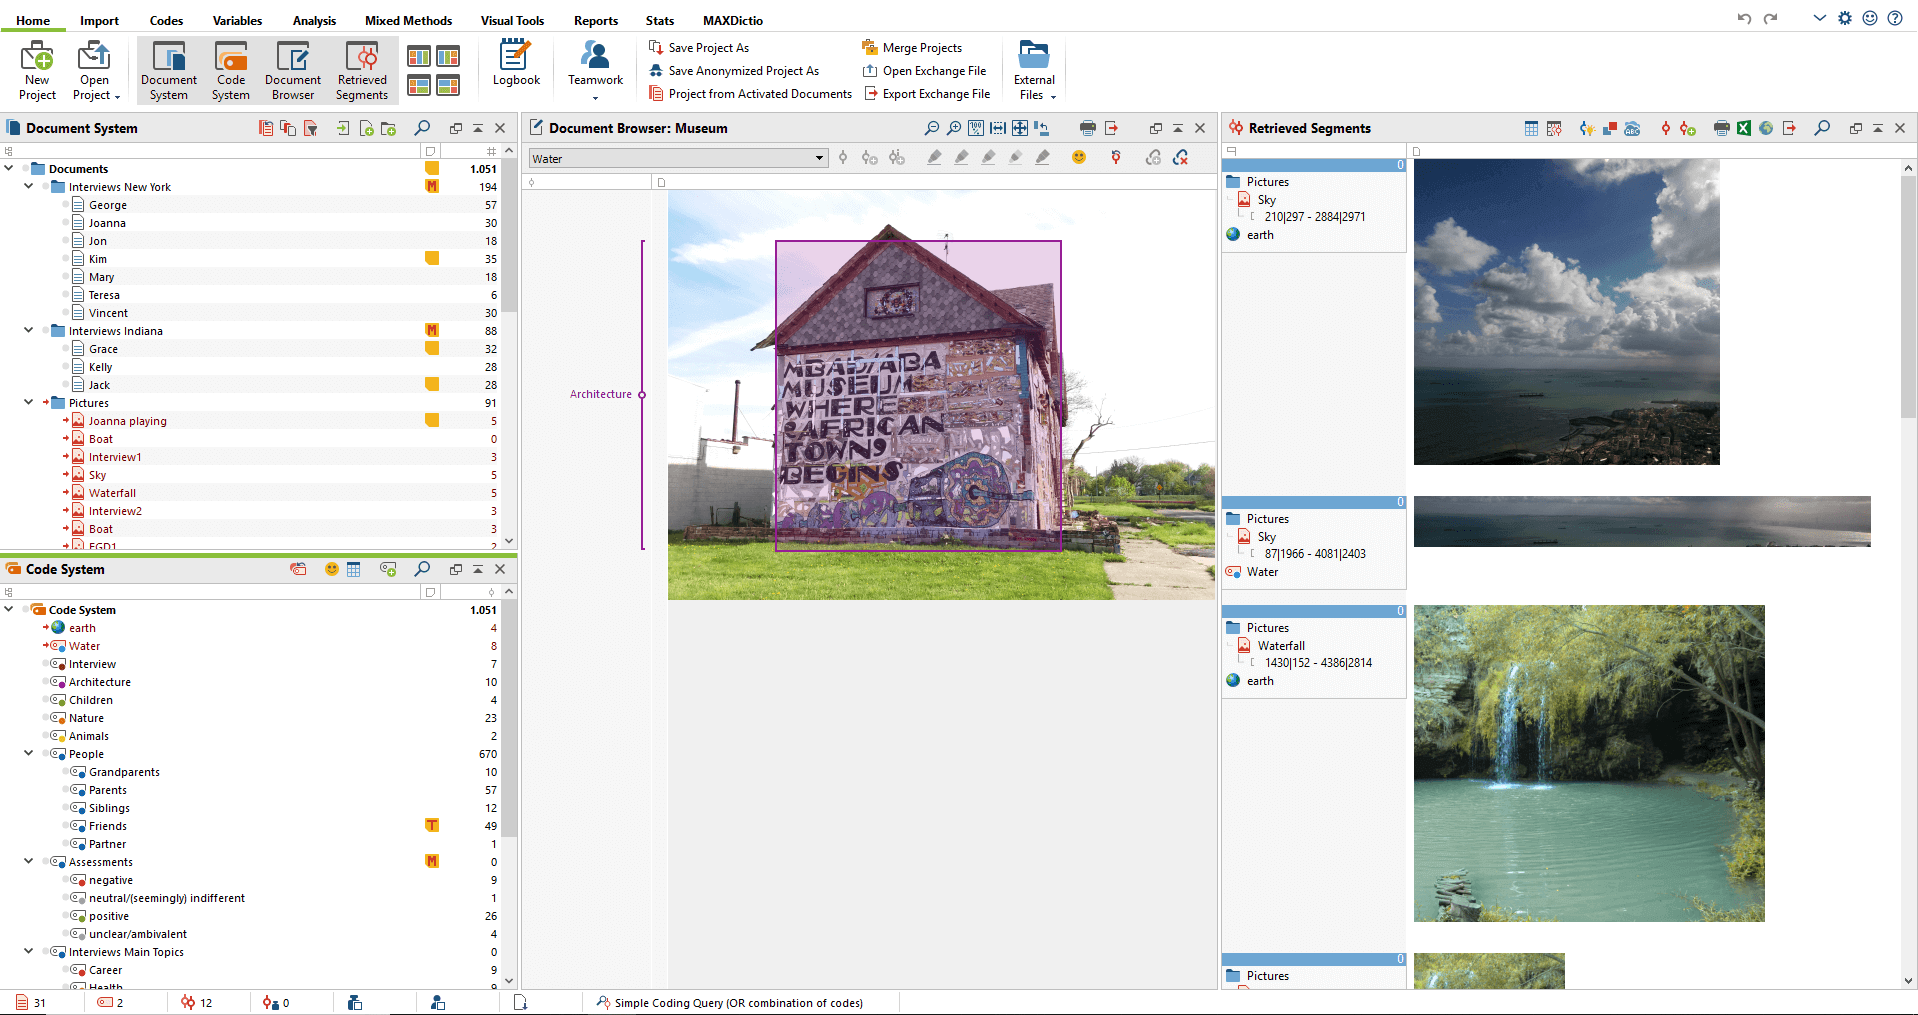
Same as with the text documents, you can retrieve coded segments of an image when analyzing your coded data. Simply activate the images in the “Document System” and the codes in the “Code System” you want to see. The image segments you analyzed will automatically appear in MAXQDA’s “Retrieved Segments” window.
When retrieving coded segments, also known as retrieval, MAXQDA helps you call up all segments that have been coded with the same code. Next to each retrieved segment, you will find an infobox about each retrieved segment and a memo column, displaying any memos that were attached to the retrieved section of the document. An easy way to get an overview of your retrieved segments is to open the Overview of Retrieved Segments by clicking the icon in the toolbar at the top of the “Retrieved Segments” window.
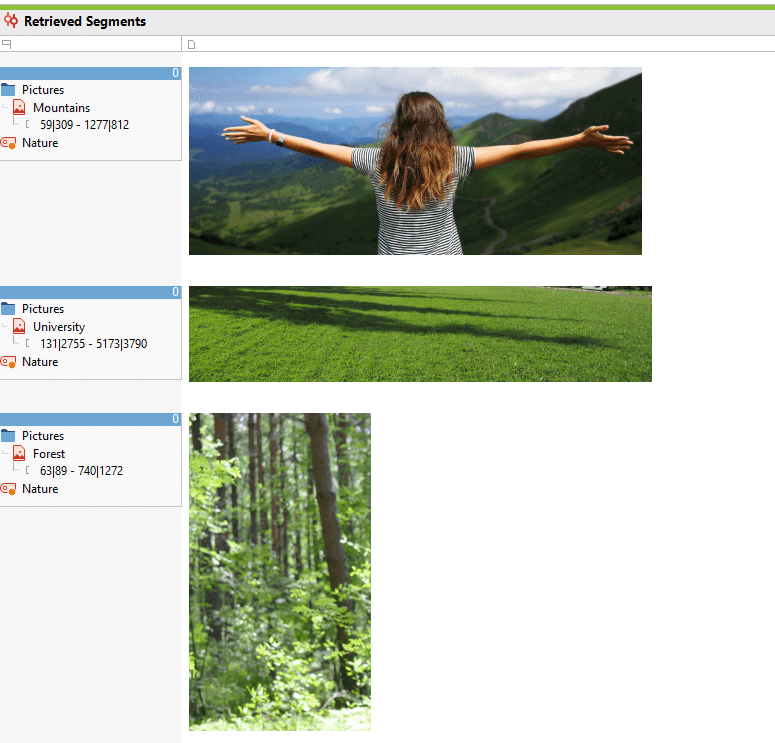
The “Retrieved Segments” window with the coded segments of the pictures
You can also always go back to the original document from a coded segment in the “Retrieved Segments” window by clicking anywhere on the infobox containing the source. The image will be opened in the “Document Browser” and positioned exactly where the coded segment is, and highlighting it so that you can immediately assign a new category without having to highlight it again. If you want to adjust the edges of the image segment you coded, simply click and drag the corners.
Export Image Segments
If you want to export your analysis results, simply click the Export retrieved segments icon to get an overview of your work in Word, Excel, or as an HTML-formatted web page, for example.
Step 5: Visualizing the Analysis Results
Some MAXQDA visual tools cannot be used to analyze image codes. For example, MAXQDA’s Document Portrait and Codeline tools require that data be presented in a sequence, which is the case for text, video, or audio data, but not for an image. That said, there are still several options for visualizing your image data analysis with MAXQDA. Here are a few options that we recommend:
Code Matrix Browser
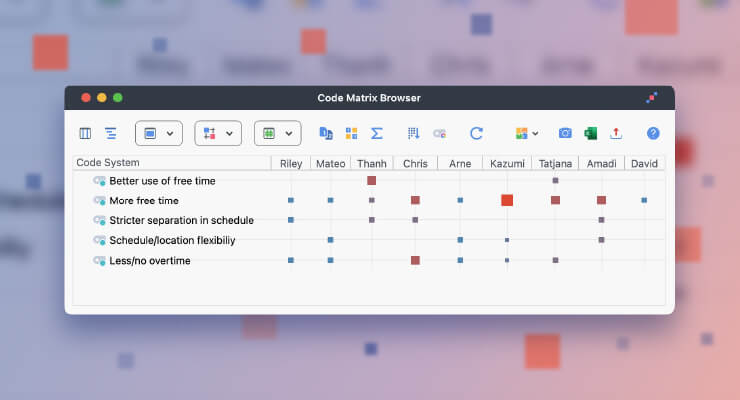
MAXQDA’s Code Matrix Browser allows you to visualize how codes are distributed across all of your different files. The matrix will provide you an overview of how often a specific code was assigned to each image.
Code Matrix Browser with codes displayed as circles
The size and color of the clusters in the matrix will show you how many image segments in each image have been assigned each particular code and subcode. The larger the cluster, the greater the number of segments that were assigned this code or category in this document. If you want to go back to see the segment being analyzed, just double-click the symbol, and the segments that have been assigned a particular code can be retrieved immediately. You can also export the matrix as an image to easily add your visualization to a paper or PowerPoint slide.
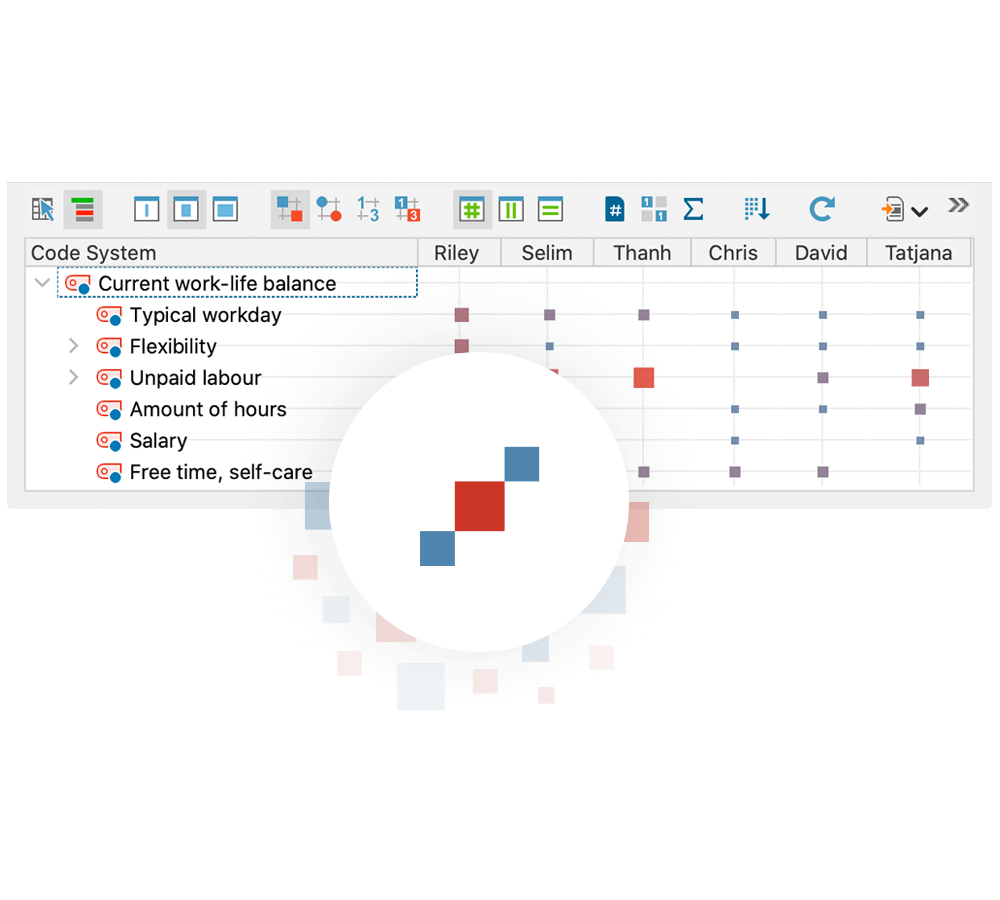
Code Relations Browser
Another great visual tool that is similar to the Code Matrix Browser and that is suited perfectly to image analysis is MAXQDA’s Code Relations Browser. It allows you to visualize the relationships between codes and see which codes frequently occur together.
Each symbol in the matrix represents the number of intersections of the two codes. The larger the symbol, the larger the number of intersections. Please keep in mind that with the Complex Coding Query and Code Relations Browser, the “Near” function for image segments always returns a result of 0.
Code Map
You can also visualize your work with the help of the Code Map. As the name suggests, the codes will be displayed on a map in a separate dialog window. Each circle symbolizes a code, with the distances between two codes representing how similarly the codes have been applied in the data material. The more two codes overlap the closer they are placed together on the map.
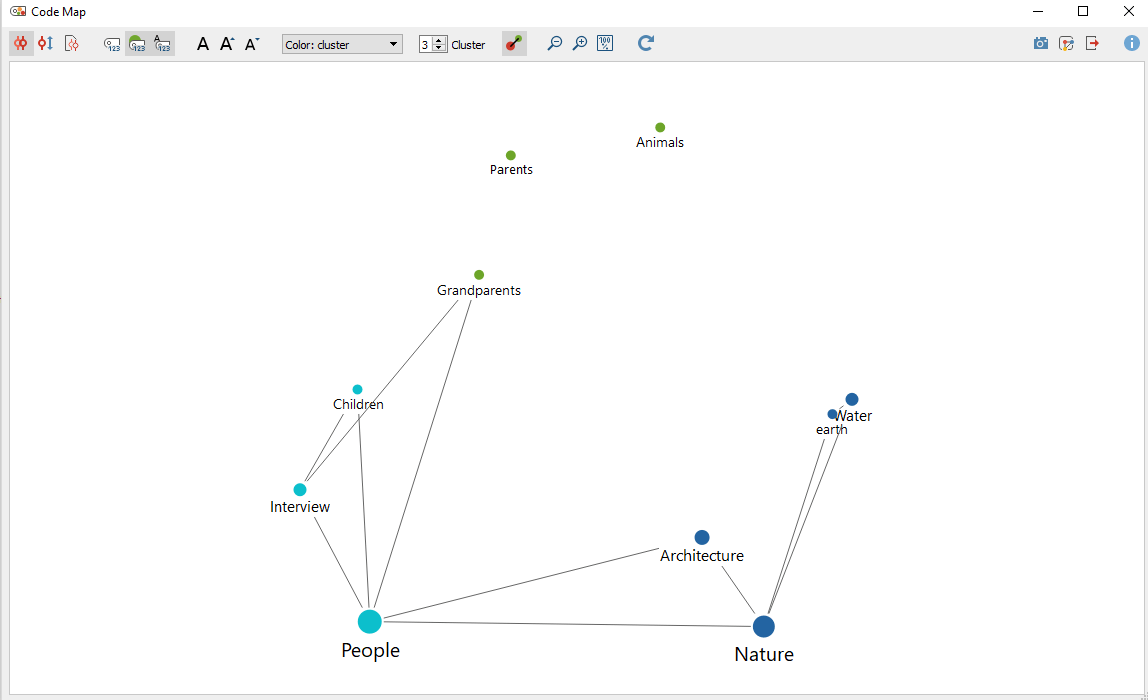
Code Map with relations between the codes shown as lines
The map is completely customizable – how you think your data should be visualized is up to you! In our example project above, the option “Show relations as lines” has been selected so that the connections between the codes are visualized more graphically. Optionally, the connecting lines can be displayed as thinner or thicker the more coincidences there are between two codes. As a further option, we chose to use larger circles to show that more code assignments have been made with that code and we used colors to highlight groupings. You can also integrate images and coded image segments into your own interactive concept map using MAXQDA’s MAXMaps feature.
To sum up, the possibilities are endless. With MAXQDA, qualitative research doesn’t always involve text-based evidence as the main object of analysis. As we all know, a picture can sometimes say more than a thousand words!
MAXQDA Photo Contest 2019 – #PictureYourResearch
Do you also use images in your research? Do you have exciting pictures from the field, lab, or office that you’d like to share with the world? At VERBI Software, we’re curious about what your personal research journey looks like and we are convinced that behind every MAXQDA project there is a story worth sharing. #PictureYourResearch – Share your unique perspective with the global MAXQDA community! Submit a photo from your research project for your chance to win by September 9th, 2019 here:
Submit a photo for your chance to win!