For our last MAXQDA Research Blog post of the year, we’re continuing our tradition of spreading Christmas cheer with a final Tip of the Month – The Holiday Edition! This step-by-step guide will walk you through how to analyze audio files with MAXQDA, and to get in the spirit we’ll be analyzing the five most popular classic English-language Christmas carols which are now in the public domain.

Step 1: Importing the Data
As always, the first step in creating your MAXQDA project is to import your data – in this case, the Christmas carols – you want to analyze. As with all audio data, Christmas carols can come in different file formats. Let’s take a look at some of the options you have when analyzing songs in MAXQDA.
1.1 Analyze Auditory Aspects using an Audio File
If you are interested in the melody or pronunciation of the lyrics or other auditory aspects, we recommend importing the song as a sound recording (.mp3 or .wav file). Simply drag and drop your audio file into your “Document System” window or click the Import tab and select Audio (the icon with the musical notes).
You can then use MAXQDA’s Multimedia Browser to play the song and code sound snippets (see Step 2). You can even add memos to sound snippets to keep track of your ideas while coding!
1.2 Analyze Performance Aspects using a Video File
The Multimedia Browser can also be used to analyze videos, for example, if you want to compare performances of the same song between multiple artists or to investigate the evolution of Christmas-related song performances. Check out last year’s Christmas Edition Tip of the Month for a step-by-step video analysis guide:
How to Analyze Videos with MAXQDA
1.3 Analyze Lyrical Aspects using a Text Document
If you’re interested in analyzing a song’s lyrics or you’ve found a new song with interesting modifications to the original/classic lyrics, you can import the text document or PDF into MAXQDA and begin coding from there. If you only have the audio file, we recommend transcribing the text using MAXQDA’s Transcription Mode.
That’s right, you can quickly and easily transcribe your audio data directly in MAXQDA – no need to use multiple programs! Song lyrics, just like interview transcripts, can then be analyzed as text documents in MAXQDA.

Transcribe documents directly in MAXQDA
Step 2: Coding the Data
First things first: decide whether you’d like to create your codes ahead of time in the “Code System” window or if you’d like to code directly from the data, for example, if you are using a methodological framework that calls for in-vivo coding, such as Grounded Theory.
2.1 Creating Codes
If you know beforehand which themes you want to focus on during your analysis, we recommend defining your Code System as a first step.
Let’s take a look at our Christmas carols. Let’s say we expect most of the carols to reference religious figures. In that case we could create a parent code called “Religious figures” and then add the subcodes “God” & “Jesus” to start off with. If we come across other religious figures, we can always add further subcodes along the way or we can refine the code system in later rounds of coding.

Save time with the one-click subcode feature
2.2 Coding Segments from the Audio File
Next, decide if you would like to code the audio file directly or create a transcript of the recording. When working with interviews, for example, we recommend transcribing your interviews with timestamps, so that you can link and then go back to the audio segment you transcribed with just one click!
If you wish to code your recording directly, open your audio file to get started. Right-click on the audio file you wish to code and select “Open audio file” to launch the Multimedia Browser. You can now play and pause your audio using F4 and F5 on your keyboard (Windows) or the space bar (Mac).
Using your mouse, simply click on the section of audio you wish to start the code on and then drag the mouse to the end of the segment you are interested in. You can then drag the highlighted segment onto a code or vice-versa, you can drag a code onto the segment if you have pre-made codes.
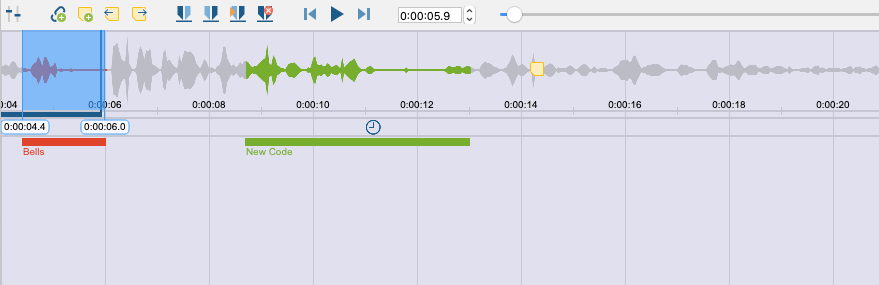
Coding audio segments in the Multimedia Browser
A code will appear under the time segment you have chosen (see the screenshot below) and you will be able to instantly find this piece of the audio file in MAXQDA’s “Retrieved Segments” window, just like any other coded segment in your project.
To create a new code from the data, right-click and select ‘Code with a New Code’. If you are unfamiliar with coding in Qualitative Data Analysis, or you would like a refresher, check out this 5-minute tutorial:
How to Code Your Data with MAXQDA 2020
Step 3: Organize the Code System with Creative Coding
Once you have completed your first round of coding, you may notice that you have a lot of codes that overlap, are too similar, or may need to be organized hierarchically before proceeding. A good way to organize your code system freely is to use MAXQDA’s Creative Coding feature. You can launch the Creative Coding mode in the main menu’s Codes tab.

The large number of codes created during the open coding stage
can be organized using MAXQDA’s Creative Coding function
An organized coding system will facilitate further analysis, especially if you have a lot of codes after the first round. To start organizing, drag and drop the codes you want to work with from your Code System onto the creative coding map (see screenshot above).
3.1 Create a Hierarchical Code Structure
Next, click Start Organizing Codes in the top left-hand side of the screen and use the Link (Define as Subcode) arrow tool to connect a parent code to a subcode (see screenshot below). You can also create additional codes if you need them. When you are done, MAXQDA will automatically apply the new hierarchical structure you created with the arrows to your code system!
")
Newly organized Code System
3.2 Merging Codes as Needed
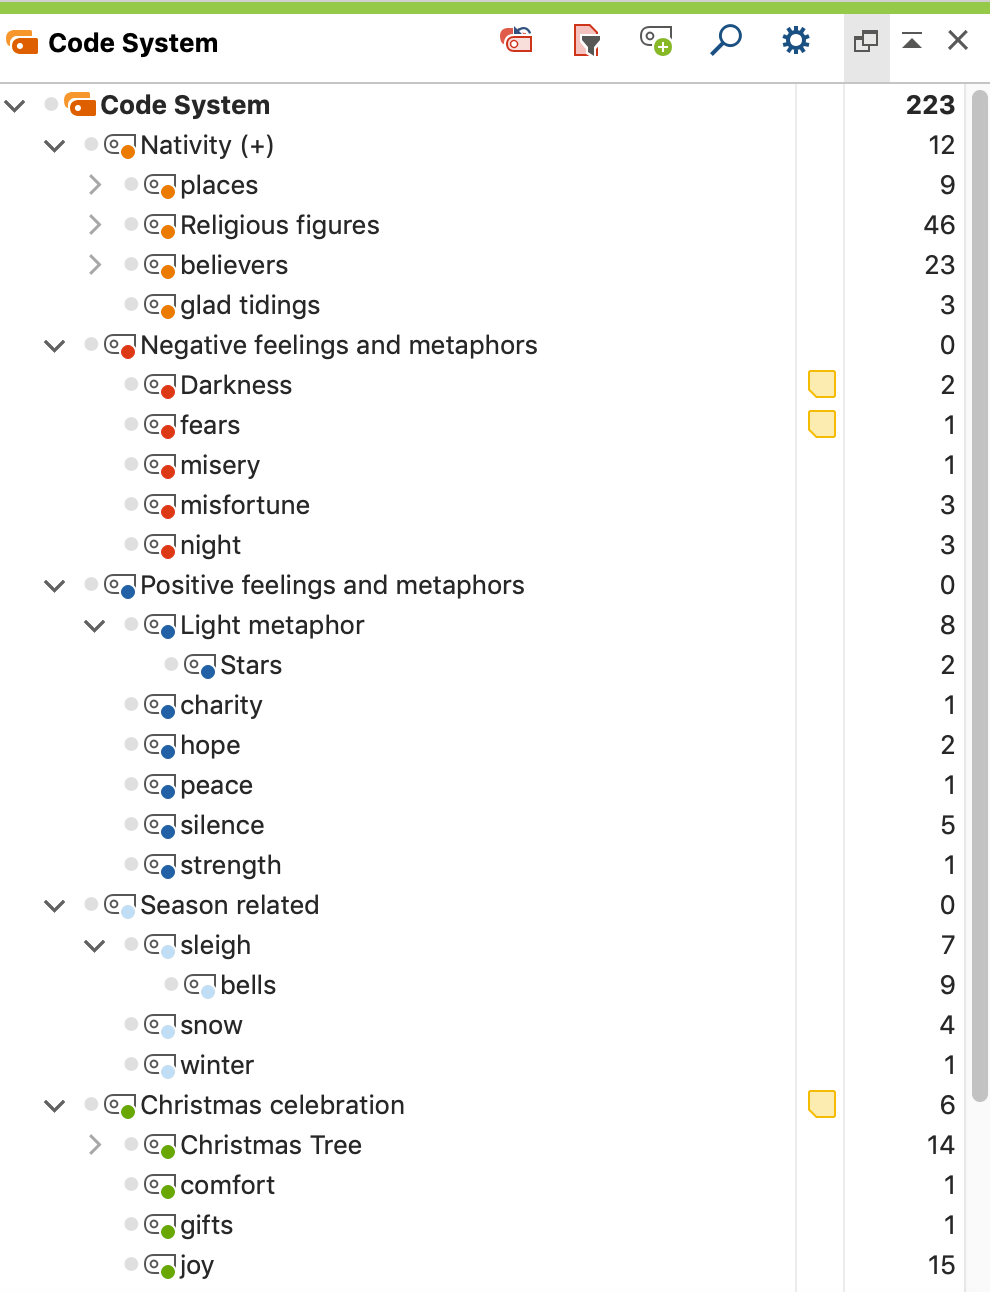
It looks like we accidentally created a few codes that have the same meaning. Let’s slim down our code system by combining codes with overlapping meanings. As you can see in the upper right corner of our Creative Coding workspace, the codes “Nativity” and “Biblical Christmas Story” are very similar.
We are going to merge these two codes in the Code System by dragging and dropping the one we want to absorb onto the one we want to keep. You can see that codes have been merged by the plus in parentheses next to the code’s name (see the first code in the Code System screenshot above).

Step 4: Visualize Your Data with MAXMaps
MAXMaps is MAXQDA’s tool for building concept maps where you can visually represent all the elements in your project (codes, documents, memos, coded segments, etc.) and their relation to each other. With the release of MAXQDA 2020, MAXMaps 3.0 was launched with several improvements to existing functions, six new models, expanded formatting options, a new interactive model builder, a redesigned Map Organizer, and new objects!
Open MAXMaps by clicking on the first icon in the Visual Tools tab in the main menu. In MAXMaps you can choose whether you want to freely design a map from scratch or want to use one of the numerous model templates available. Each model template is a unique tool made for quickly visualizing specific perspectives on the data. Since there are so many different models, we will only present a few of them, but make sure to check out our Online Manual to learn more:
Learn more about
MAXMaps Model Templates
4.1 Single-Case Model
MAXMaps’ Single-Case Model displays all relevant data attached to a document, such as memos, codes, and coded segments. With MAXQDA’s newly developed Interactive Model Builder (the left sidebar in the screenshot below), you can now test what the existing options will change in your map before applying them! Of course, you can still modify your map at any time after adding changes as well (e.g. changing colors, enlarge font or icons, add images, and so on).

Example of a Single-Case Model with coded segments
Let’s look at one of our Christmas carols we coded earlier. We can conclude from this Single-Case Model that most of our coded song segments are related to the Nativity story (colored orange in our example project). Other themes, such as negative metaphors (e.g. darkness, night), positive metaphors (e.g. stars, light), or modern Christmas celebrations are not as relevant to the song “O Little Town of Bethlehem”.
A contrasting case is the German Christmas song “O Christmas Tree”. When you examine this case to the previous song using a Single-Case Model Comparison map, we see that “O Christmas Tree” mainly focuses on aspects related to the celebration of Christmas (codes shown in green in the screenshot below), such as (obviously) the Christmas tree, music, and joy.

Comparing the Christmas carols as Single-Case Models
4.2 Two-Cases Model
A more direct approach to comparing documents in MAXMaps 3.0 is by using the Two-Cases model template. Visualize the extent to which codes occur in both documents or only in one of the documents more quickly and easily than ever before!

Two-Cases Model Comparing the Christmas carols
As before, we can easily see that besides “faith”, no “religious” codes have been assigned to “O Christmas tree” which is not surprising, due to the fact that the Christmas tree tradition was originally a pagan tradition. On the other side, both songs share some codes, such as “faith” and “hope”. From this model, we can observe that the songs share only positive aspects from Christmas traditions.
Step 5: Present Your Analysis with Code Models
In contrast to case models that focus on a document, MAXQDA’s Code Models spotlight a specific code. Code Models are excellent tools that you can use to present your analysis steps to your colleagues visually so that they can get a more in-depth understanding of your analysis process.
For example, during the coding phase of our Christmas carol analysis, we noticed that our selected Christmas carols differed in how often they mentioned Jesus and in what names they used. We would like to present that finding now using MAXMaps.
5.1 Code Distribution Model
First, we are going to use one of the new models MAXQDA 2020 offers called the Code Distribution Model. This model visualizes how a specific code is distributed across your documents.
We want to find out how the code “Jesus” is distributed over our Christmas carols, so we will drag and drop the code “Jesus” onto the map and select the options “Label line with code frequency” from the interactive model builder. We can now immediately see which Christmas carol mentions “Jesus” the most (see screenshot below).

Code Distribution Model
As we can see, from the document icon’s size and the number on the line, the song “O come all ye faithful” mentioned “Jesus” by far the most (20 times).
5.2 Code-Subcodes-Segments Model
Now let’s dig a little deeper and find out which names exactly were used to when mentioning Jesus. Since we included the different names for Jesus as subcodes, we can use the Code-Subcodes-Segments Model to see how these subcodes are distributed over the selected Christmas carols.

Code-Subcodes-Segments Model for the code “Jesus”
As we can infer from this map, the three songs which mentioned Jesus in their lyrics used a total of 12 different names. When presenting this finding, a map is helpful because you can clearly see here that surprisingly, none of the names are shared by two or more songs.
Furthermore, the song “Silent night, holy night” uses 5 different names, of which only two are used twice as opposed to “O come all ye faithful” which, although it mentions Jesus the most, is less creative in coming up with different names. The high code frequency is mainly driven by the subcode “Him” which is used in the chorus and thus is repeated quite often.
5.3 Create a Free Map
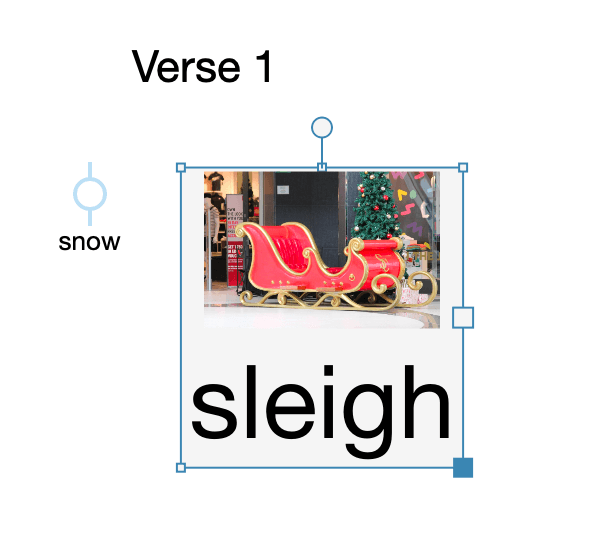
In this last section of this year’s Christmas blog, we want to show you how to let your creativity run free and design a map from scratch. Since we haven’t looked at the song “Jingle Bells” yet so far, this is going to be our topic.
You can personalize your map and make it more interesting when presenting data by using images instead of the predefined symbols (see screenshot below). You can also include images that are not related to a certain MAXQDA object by clicking the corresponding button in the Insert tab.
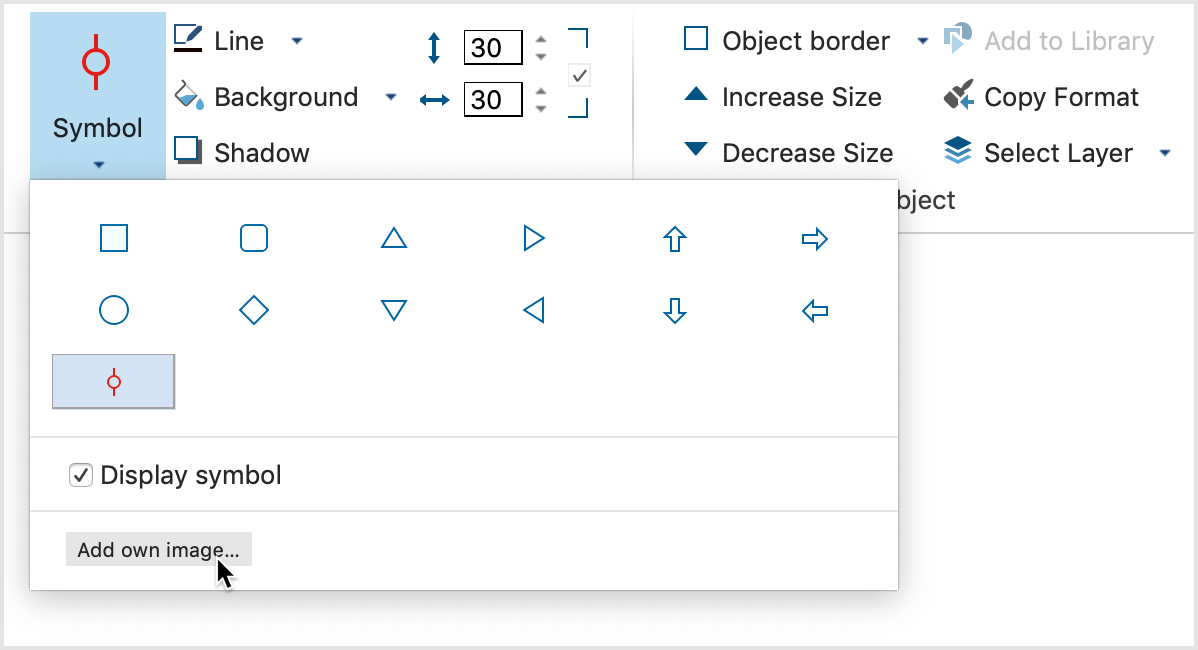
Use your own image as an object’s symbol
Now that we have multiple images on our map, we want them to overlap. To do so, we need to add layers to our map. Layers in MAXMaps are similar to layers in image editing software such as Photoshop or Gimp – objects in a higher layer overcast objects in lower layers.
The Layer function can be activated by clicking the “Layer” icon in the Start tab. This will open a window in which the existing layers are listed and new layers can be added. To move an object to another layer, select the object then click on “Select layer” in the “Format” tab and choose one layer.

Bells and Musical Notes in the Object Library
Another useful feature in MAXMaps is the object library (see screenshot above). In the object library, you can store objects which you want to use multiple times. By doing so you have quick access to the same shape in the future.
To store an object in the library, right-click on it and select the corresponding entry from the context menu. If you want to re-use the object just drag and drop the object from the library (left-side) on your map. Did we mention that everything on the map is interactive? Want to hear that specific segment from the audio file again? Just double click to go right back to your data origin! Then, when you have finished designing your map, simply export your map as an image file to add it to your presentation!
Conclusion – Happy Holidays from MAXQDA
There are so many possibilities for analyzing and visualizing your audio data in MAXQDA 2020. The best way to really get to know them is to create your own MAXQDA project – you can test MAXQDA for free for 14 days with no obligation!
Now that we have “Jingle Bells” stuck in our heads, we would like to sign off by wishing you a very happy holiday season and a wonderful start to the new year. Thank you for reading the MAXQDA Research Blog this year we hope that you will continue to be a part of our community in 2020.
If you would like to learn more about specific MAXQDA functions and meet us in person, don’t forget to register for the MAXQDA International Conference (MQIC) 2020, taking place in Berlin from February 26th – 28th, 2020. We hope to see you there soon!