Guest article by Professional MAXQDA Trainer Dr. Leandro Mahalem de Lima.
Modern climate sciences are not the only sources of evidence-based worries about the ongoing consequences of anthropogenic climate change. Among traditional peoples across different parts of the world, such concerns are expected to emerge as a result of the observation of discrete local changes in long-standing routines, affecting primary food production.
My research project on climate change perceptions focuses on two small-scale indigenous communities in the confluence zone of three major rivers (Arapiuns, Tapajos, Amazon) in the Central Brazilian Amazonia. The Arapiuns and Tapajos food production is primarily based on fishing, hunting, and slash-and-burn horticulture.
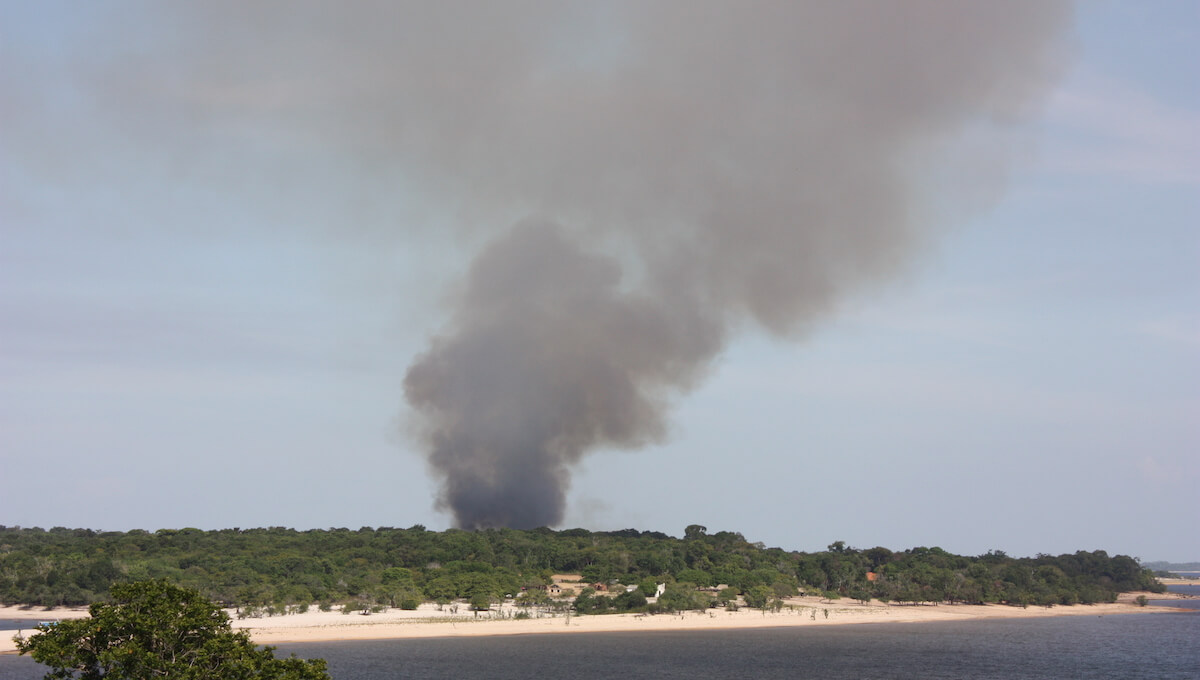
A lake, a community during summertime, and a burning garden (De Lima, 2012)
I explore a common blended methodological protocol developed and explored by a group of ethnographers working in different continents. Preliminary analyses are now available in the volume Cultural Models of Nature: Primary Food Producers and Climate Change (Routledge, 2019), edited by Giovanni Bennardo.
Analyzing and mapping interview data
This post is my second on the MAXQDA Research Blog sharing how I explored MAXQDA’s functionalities to analyze linguistic data I documented during my fieldwork in 2015 – at the word, sentence, and discourse level.
Previously (more here), I used word frequency analyses to synthesize and map a set of 35 salient categories underlying the content of a small exploratory sample of 18 semi-structured interviews.
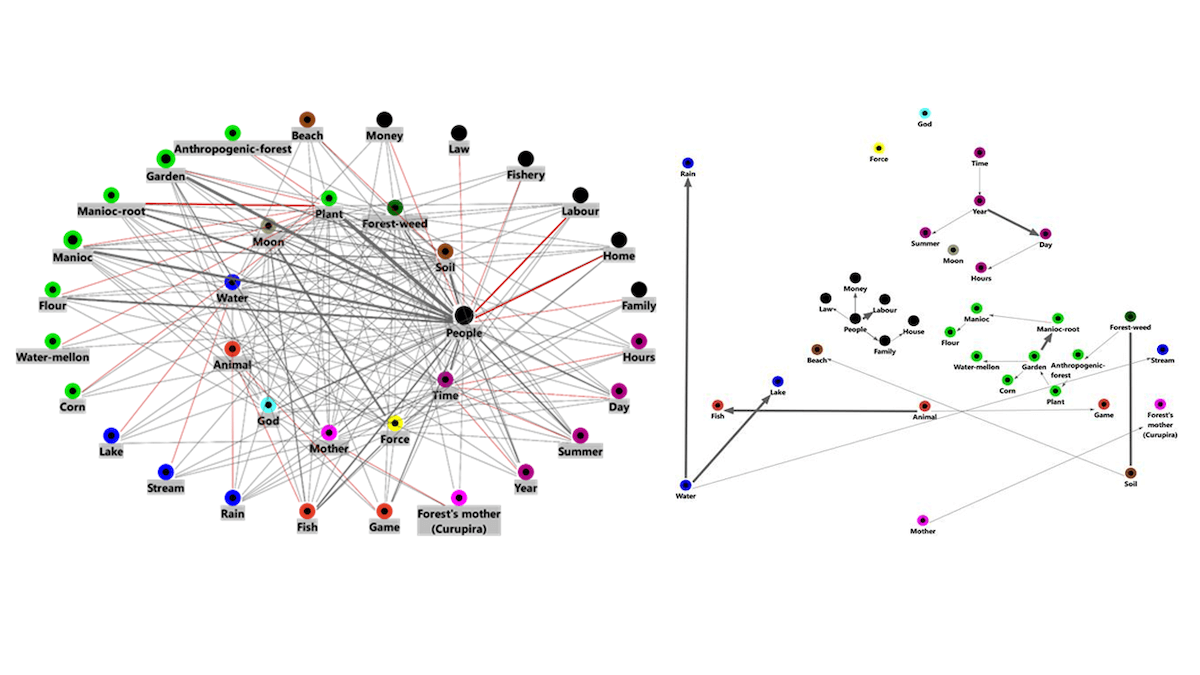
Figure 1: Mapping frequent words in interviews using MAXQDA’s MAXMaps feature
In this post, I will describe how I used MAXQDA to analyze and map instances when individual respondents raised the theme of climate warming, evidencing patterns, and variable factors that cut across multiple cases.
De Lima’s First MAXQDA Article
Indirect thematic approach in interviews
It is important to highlight that in the semi-structured interview protocol I adopted, participants were prompted to talk about routines and problems related to food production. Concrete issues are covered as and when they are raised by the participants. Even though not directly asked about, it was remarkable that many mentioned, at some point, that the local climate is warming up.
Once these commentaries are scattered throughout the interviews, computer-assisted qualitative data analysis software (CAQDAS) is a useful way to:
- retrieve specific statements;
- establish thematic sets of propositions, using various coding strategies;
- analyze coded segments, using mixed methods and visual tools.
Lemmatizing keywords to retrieve a theme
In linguistics, a “lemma” is the dictionary form of a set of words (e.g. see), whereas its declinations are named “lexemes” (e.g. seeing, saw). In content analysis, “lemmatization” – combining different forms of a word – can be a very useful tool to look up ways specific concepts are enunciated.
With MAXQDA’s MAXDictio feature, you can lemmatize Word Frequencies and Word Combinations in various languages, including Portuguese:
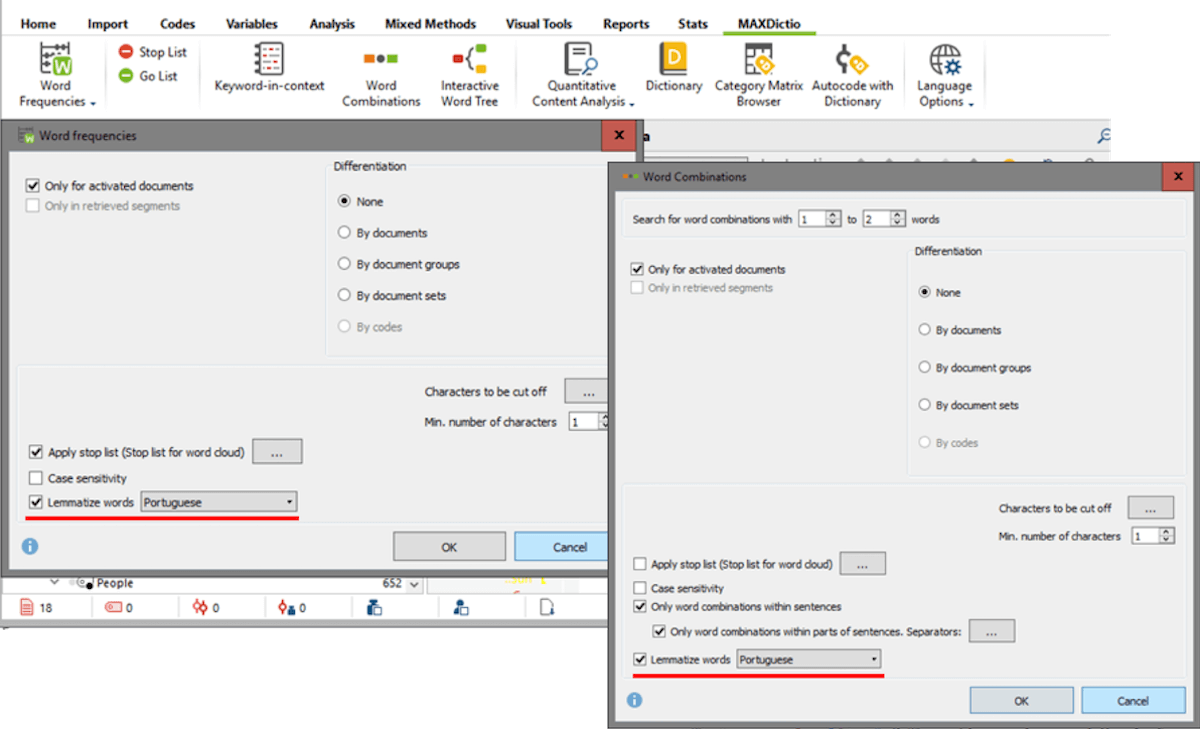
Figure 2: MAXDictio’s Word frequency and Word Combination menu with options to lemmatize words
While searching for warming problems, for example, I used the lemmatized word function to access and codify all variations of words used to express this idea. In the lemma list, I identified 04 lemmas (plus 05 lexemes) that attended such criteria: quentar (quente), esquentar (esquentava, esquente, esquenta, esquentou), quentura, calor.
There are two easy ways to combine these lemmas on the list:
- drag and drop one word into another to sum them up, and then select the summed lemma by double-clicking it to code all phrases on which summed lemma variations appear; or
- transform lemmas into codes one-by-one, and then copy and paste one code onto another in MAXQDA’s “Code System” window.
Although it is a bit more time consuming, the second option might be better if you are interested in documenting and describing all your coding phases in detail. Either way, the resulting code list for Warm is formed by 69 automatically coded sentences; the primary set on which sentences about climate change are likely to occur.
From coded categories to content analysis
To proceed from here to a content analysis approach, you can simply double-click on a code (e.g. Warm) to open its corresponding segments in MAXQDA’s “Retrieved Segments” window. Or, alternatively, you can refine the retrieval criteria using two complementary mixed methods functions designed to correlate coded segments and variable values (e.g. gender, age, schooling) attributed to individuals. MAXQDA’s Crosstab function opens a table with numerical values, whereas the Interactive Quote Matrix allows you to review your coded segments in full length.
At this stage in the analysis, I would like to know if and how each interviewee addressed the theme of climate change. So, I used their names as variable values:
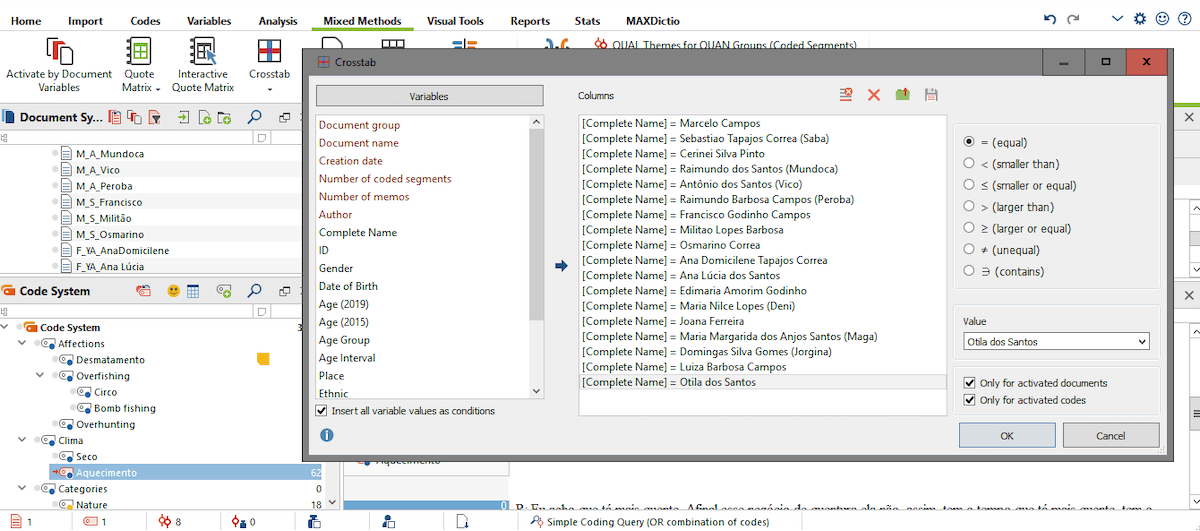
Figure 3: MAXQDA’s Crosstab function
To select all names at once, select the option Insert all variable values as conditions.
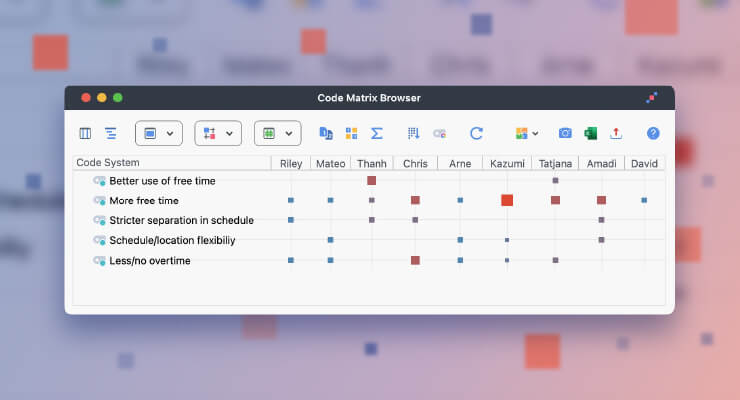
The Interactive Quote Matrix is quite effective for this kind of thematic analysis. Once I had identified the phrases I wanted to focus on, it was time to get back to the original text to refine my codes manually.
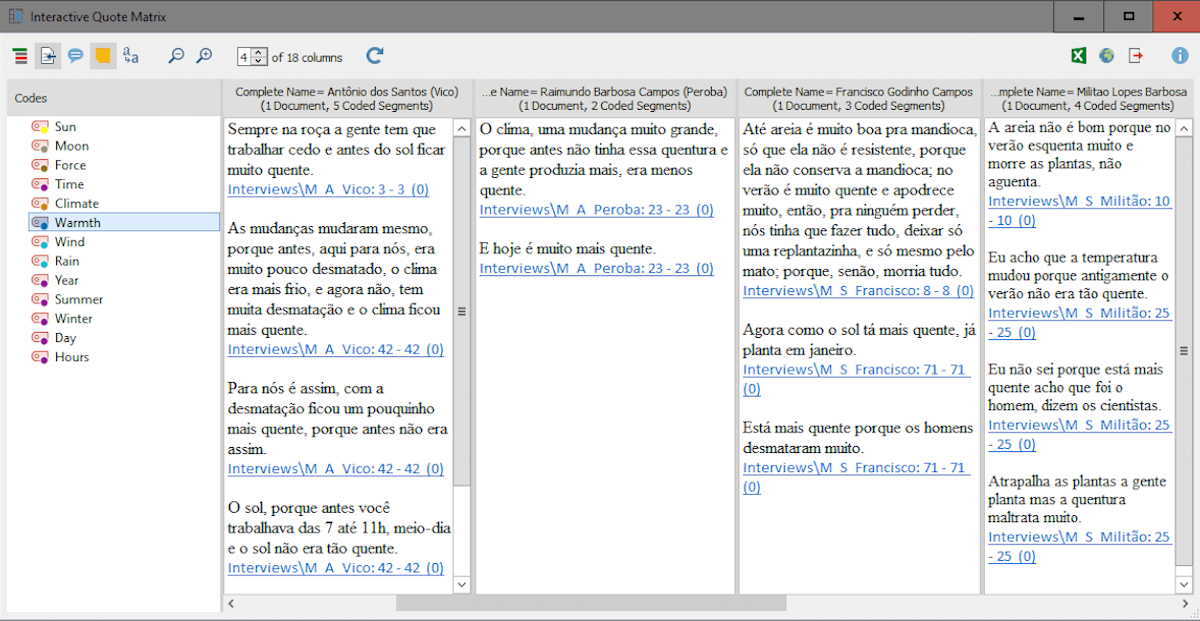
Figure 4: Interactive Quote Matrix function with automatically coded phrases related to “warming”
By right-clicking on the segments, you can easily get back to the original texts.
Using this methodological strategy, I assembled 20 text segments in a new code group I created under the name “Climate change propositions”. Content analysis also evidenced the need to create subcodes for two opposing views:
- Climate is warmer because of destruction caused by humans, mainly deforestation;
- Climate varies periodically and unpredictably, by force of nature and god’s will.
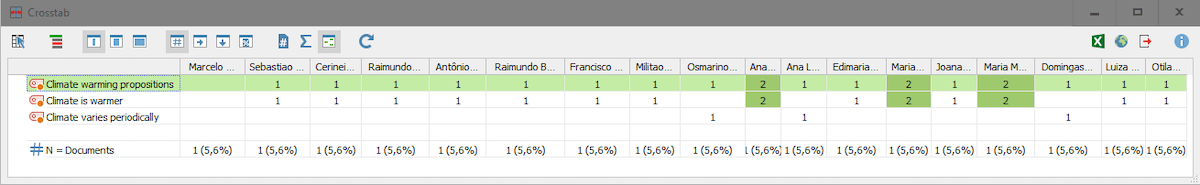
Figure 5: Climate change propositions across individuals
The crosstab, above, shows that all but one male talked about climate change and that three females raised the issue twice. A word frequency comparison (see first post) between this young male and the three ‘numerically salient’ women offers some interesting evidence:
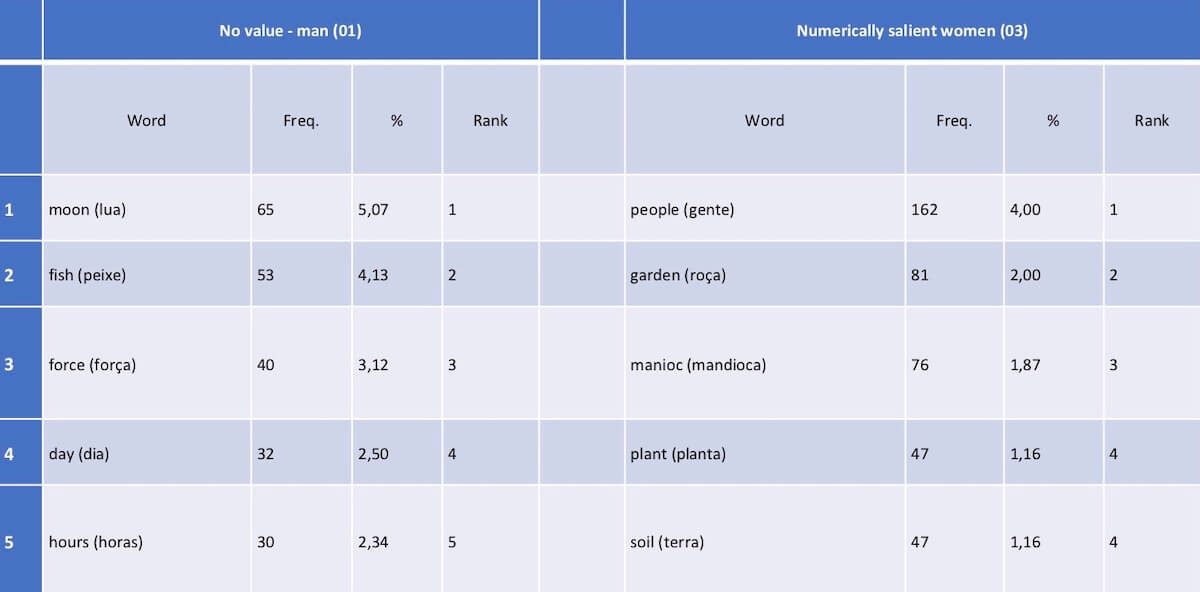
Figure 6: Frequent word comparison produced in Excel with lists exported from MAXQDA 2018
You may notice that the fisherman talked about the moon and fish, while the women focused on plants and gardens. This contrast suggests that, among participants, climate change is more connected to soils and gardening issues, than it is to fisheries.
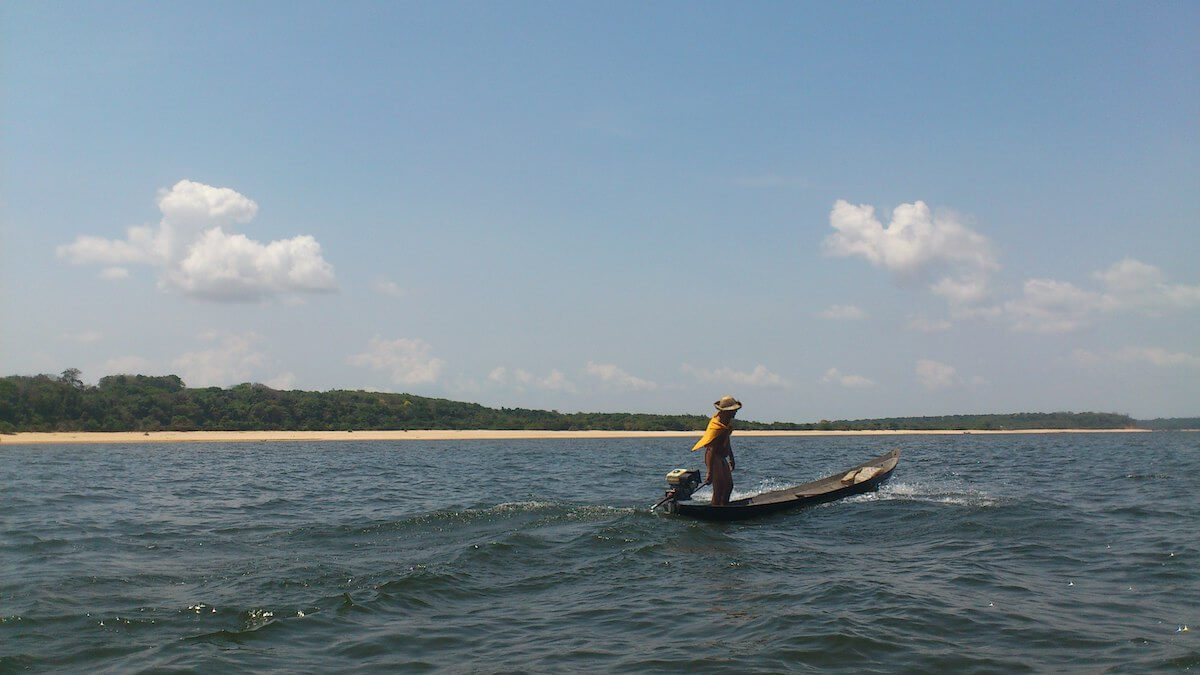
Fisherman on a boat in the Arapiuns river (De Lima, 2012)
Quantifying evaluative opinions on climate change
It is important to note that by generating a crosstab with quantities of coded segments per individual (as above), you do not get the percentage of individuals who think climate warming is the result of human behavior (or not). To get these results, you need to transform the ‘number of coded segments’ into ‘evaluative categories’, with single values or judgments attached to individuals (or other entities).
Document Variables Video Tutorial
To do this, I right-clicked on the code ‘Climate change perceptions’ and transformed it into a Categorical Document Variable. To verify the results, I opened the Data Editor for Document Variables, in the Variables menu:
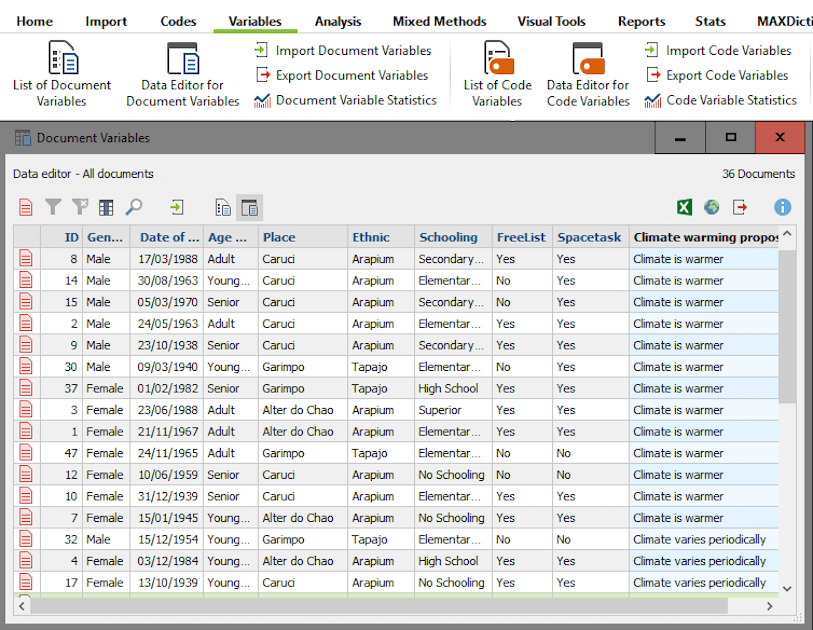
Figure 7: Data Editor for Document Variables
Then to display the results on a table per frequency, percentage and valid percentage (which excludes missing values), I used the function Document Variable Statistics, in the Variables menu:
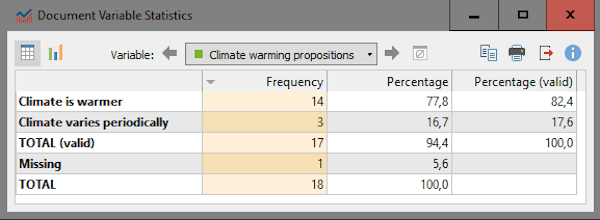
Figure 8: Document Variable Statistics table
Figures 8 and 9 reveal that 77%-80% of the Arapium and the Tapajo believe that the climate is warming because of humans. Although the sample is a small exploratory one, the numbers are quite impressive, considering that participants were not asked to talk about that issue directly and raised the problem on their own.
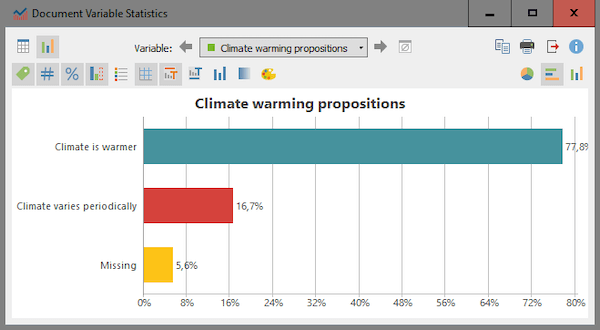
Figure 9: Document Variable Statistics chart
Visualizing causal relations and code interconnections in a set of propositions
Mapping code co-occurrences within the content of the 20 propositions concerning the issue of climate change is a good way to observe underlying contrasts and causal relations. To do this, we need to bring the set of 35 shared categories I presented in the previous post back into perspective, to unpack specific domains and elaborate multilayered designs.
To represent the specificities of participants’ propositions on climate change, I expanded the category system using 04 of the 10 most frequently used words within the set that were not part of the list: sun, climate, warm, deforestation. Finally, I went to MAXMaps to visualize code co-occurrences.
- First, I created a New Map.
- Then, I dragged into the blank image the code “Climate change propositions”.
- By right-clicking on it, I chose to include the two contrasting statements about that issue;
- After that, I chose to import co-occurring codes for these two statements, by right-clicking on each of them;
- Finally, I freely organized the distribution of codes in the blank space, arriving at the following model:
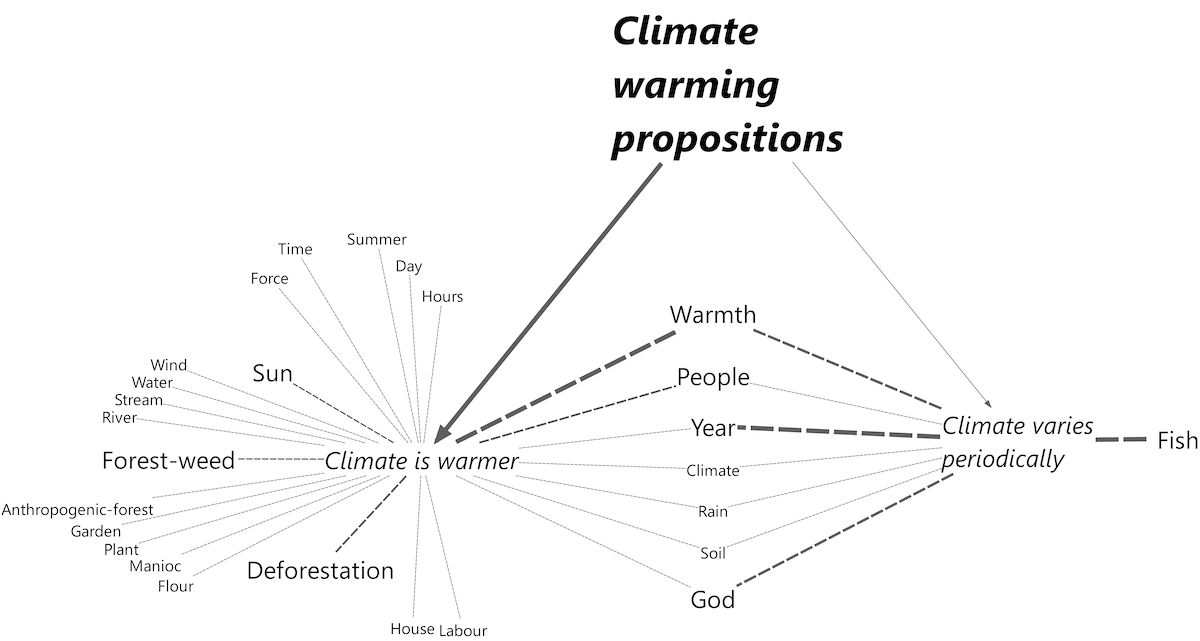
Figure 10: MAXMap of code co-occurrences in climate change propositions
The model shows that, among participants, climate change is perceived as caused by deforestation, with consequences directly felt in planting and gardening activities. Those who talked about climate change, and do not consider humans responsible for it, tend to highlight god’s will. In this contextual framework, fish display no connection to climate change perceptions, even though they are salient in propositions to the contrary.
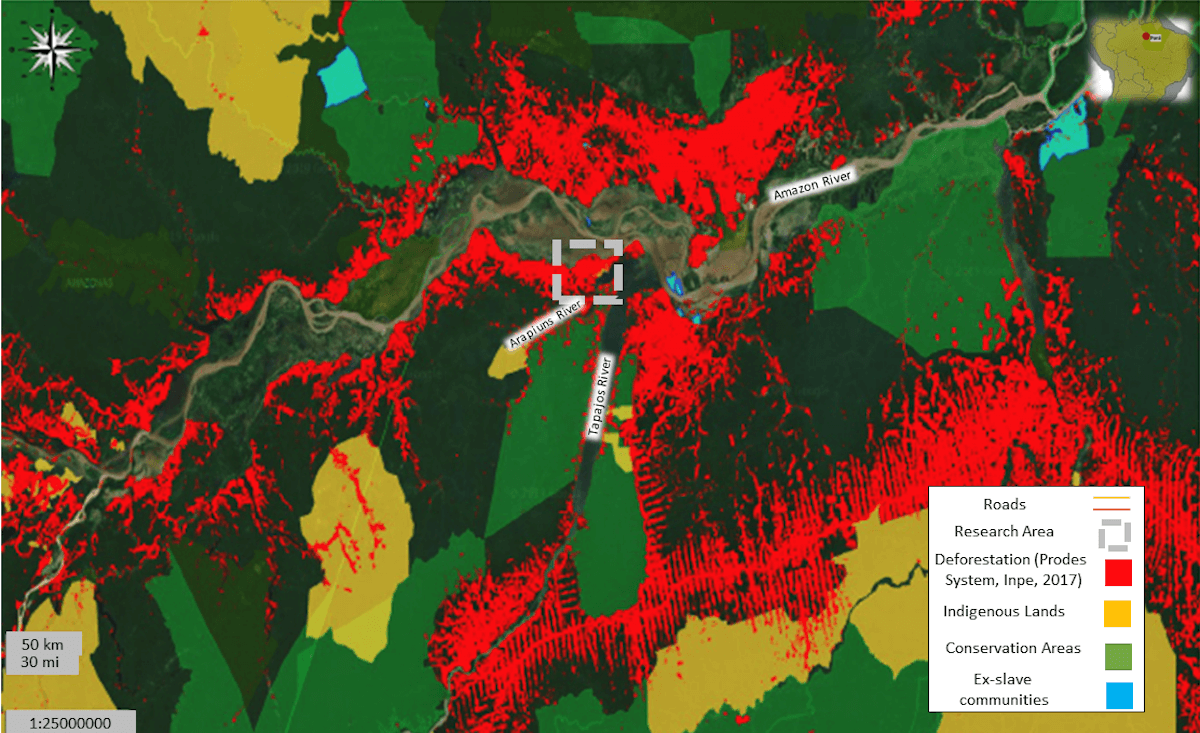
Deforestation in the research area (Extracted from: ImazonGeo)
Conclusions
Although it is only a small exploratory sample, the strong local consensus (77%-80%) that the climate is warming due to deforestation, causing a direct impact on plants and gardening, appears to be consistent with the expansion of deforestation over the five last decades, as documented by geoscientists.
This study on climate change perceptions highlights the importance of evidence-based conclusions provided by indigenous communities, to understand and mitigate climatic problems at a regional scale. Computer-assisted qualitative data analysis brings new ways to describe and translate local thinking into meaningful tables and concept maps. These new analytical tools may be useful in the shared construction of new development plans, based on evidence provided by both the scientists and indigenous peoples.
About the Author
Leandro Mahalem de Lima has a Ph.D. in Social Anthropology from the University of Sao Paulo, Brazil. Currently he is a researcher at the Sao Paulo School of Economics – FGV and a Professional MAXQDA Trainer. Click here to learn more about his research, publications, and training/consulting activities.
 Leandro Mahalem de Lima has a Ph.D. in Social Anthropology from the University of Sao Paulo, Brazil. Currently he is a researcher at the Sao Paulo School of Economics – FGV and a Professional MAXQDA Trainer. Click here to learn more about his