Guest article by Professional MAXQDA Trainer Dr. Leandro Mahalem de Lima.
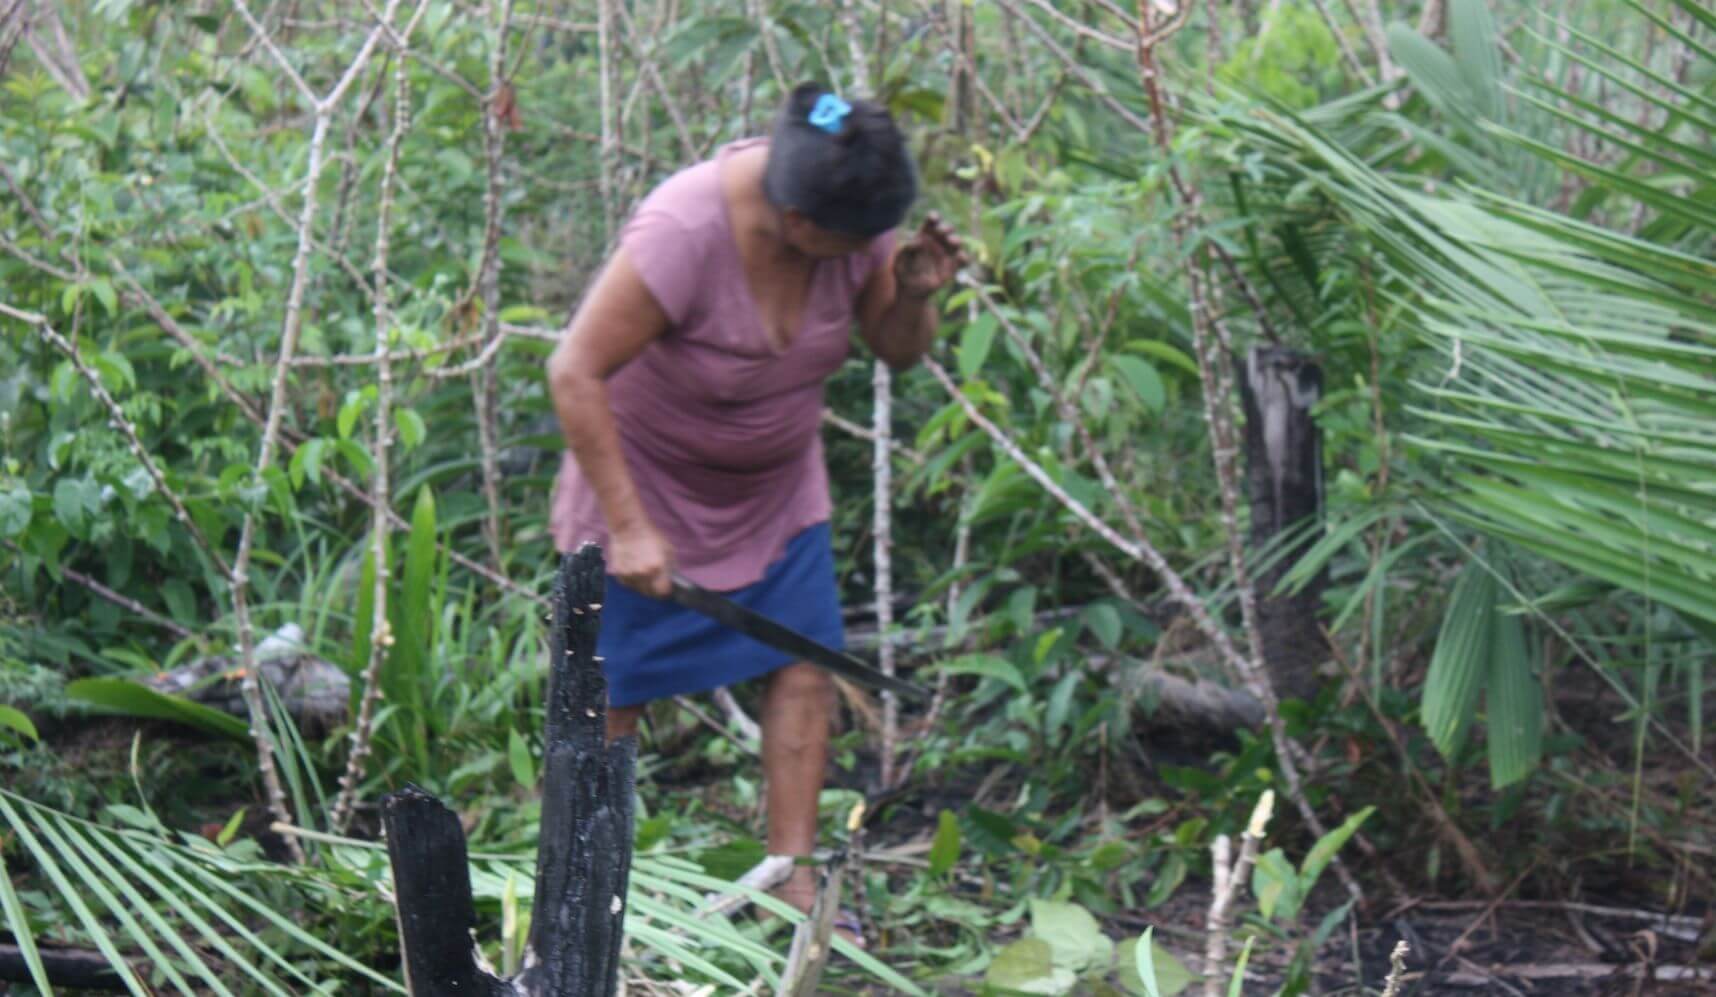
Woman in a garden (De Lima, 2012)
To acknowledge the validity of the disturbing tendencies of anthropogenic global climate change measured by natural sciences is to recognize that people are already perceiving disruptive changes in inhabited environments. Understanding how people think and act upon these trends demands us to depart from basic anthropological questions:
- How do different minds and cultures conceive what the world is?
- What are the entities that exist in it?
- How do these entities relate to each other?
- On which ontological grounds?
Only then we can begin to grasp and model reasons and meanings different persons and peoples attribute to their lived experiences of possible trends. This is where participant observation, mixed-methods strategies, and computer tools come to the fore. And that is the theme of a series of posts I present here exploring the potentialities of MAXQDA 2018. In this article, I will focus on frequent words and concepts that underlie the linguistic production of discourses in interviews. But beforehand, let me present some brief introductory notes.
Worldwide Cross-Cultural Approach
This exploration brings results of a collaborative research on models that underlie food production and climate change in the Brazilian Amazon. It is part of a larger project, on which ethnographers working in different continents have agreed to use a common blended set of qualitative and quantitative strategies to analyze linguistic and cognitive data (interviews, free-lists, space tasks, nature walks). The research group was assembled and coordinated by Giovanni Bennardo, who works with traditional dwellers in Tonga, a Polynesian archipelago increasingly threatened by unpredictable weather and rising sea levels. Preliminary results, funded by the National Science Foundation (NSF-US), will be available in the volume Cultural Models of Nature: Primary Food Producers and Climate Change (Routledge, 2019).
Perceiving and Modeling Nature
Primary food producing was the core criterion for the selection of sites and the semi-structured interviews script for intertwined reasons. People who constantly engage with nature are likely to have produced qualitative knowledge about possible local disruptive trends. When talking about these issues, one needs to instantiate shared models of what exists in Nature, or in the world/cosmos one assumes to live in.
Therefore, frequent words used when discussing these topics can be explored to reconstruct the conceptual blocks that underlie the interviewees’ discourses. In the Western-based model synthesized by Atran & Medin, basic constituents were grouped into six foundational categories: humans, plants, animals, weather, physical environment, and supernatural. In the keyword analysis described below, that assemblage is explored as a tool guide to access underlying constituents shared among interviewees.
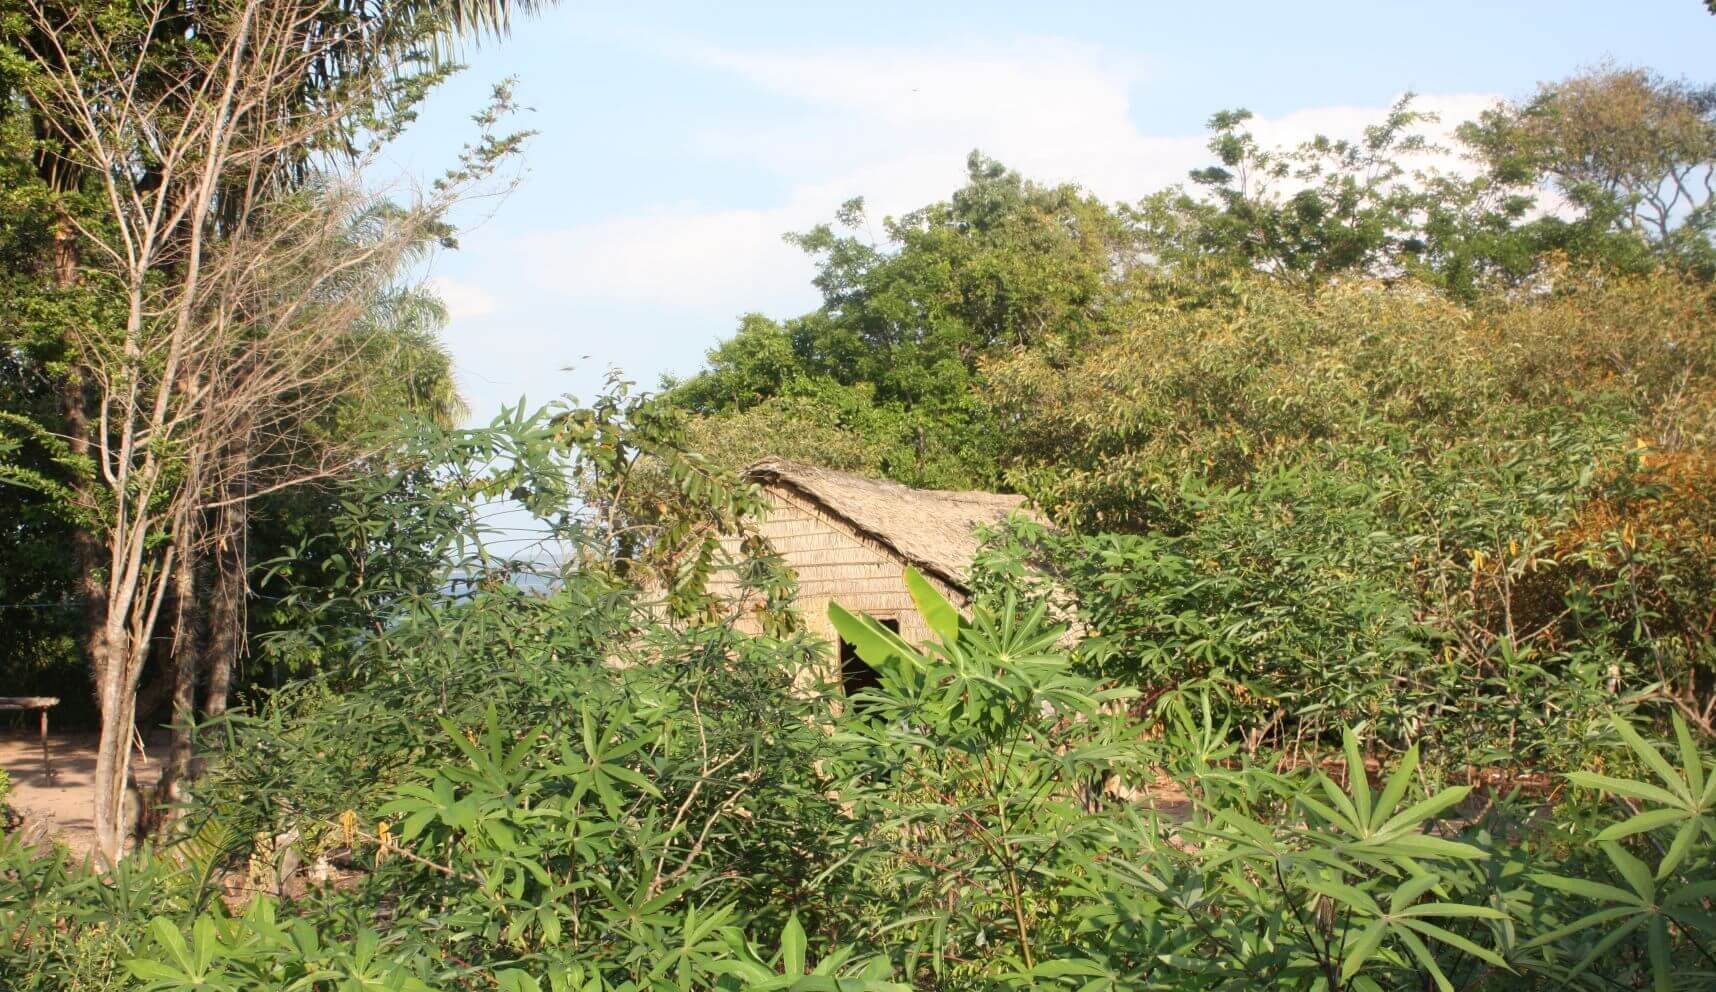
Manioc plants surrounding a house (De Lima, 2012)
Collaborative Modeling
The two small-scale villages focused on in my project, Caruci and Garimpo, are located on the confluence between the rivers Arapiuns, Tapajos, and Amazon in Santarem, Para, Brazil. They are inhabited by the Arapium and the Tapajo—representatives of several Portuguese-speaking indigenous-peasant villages, known as “Caboclo societies”, along the Amazon basin:
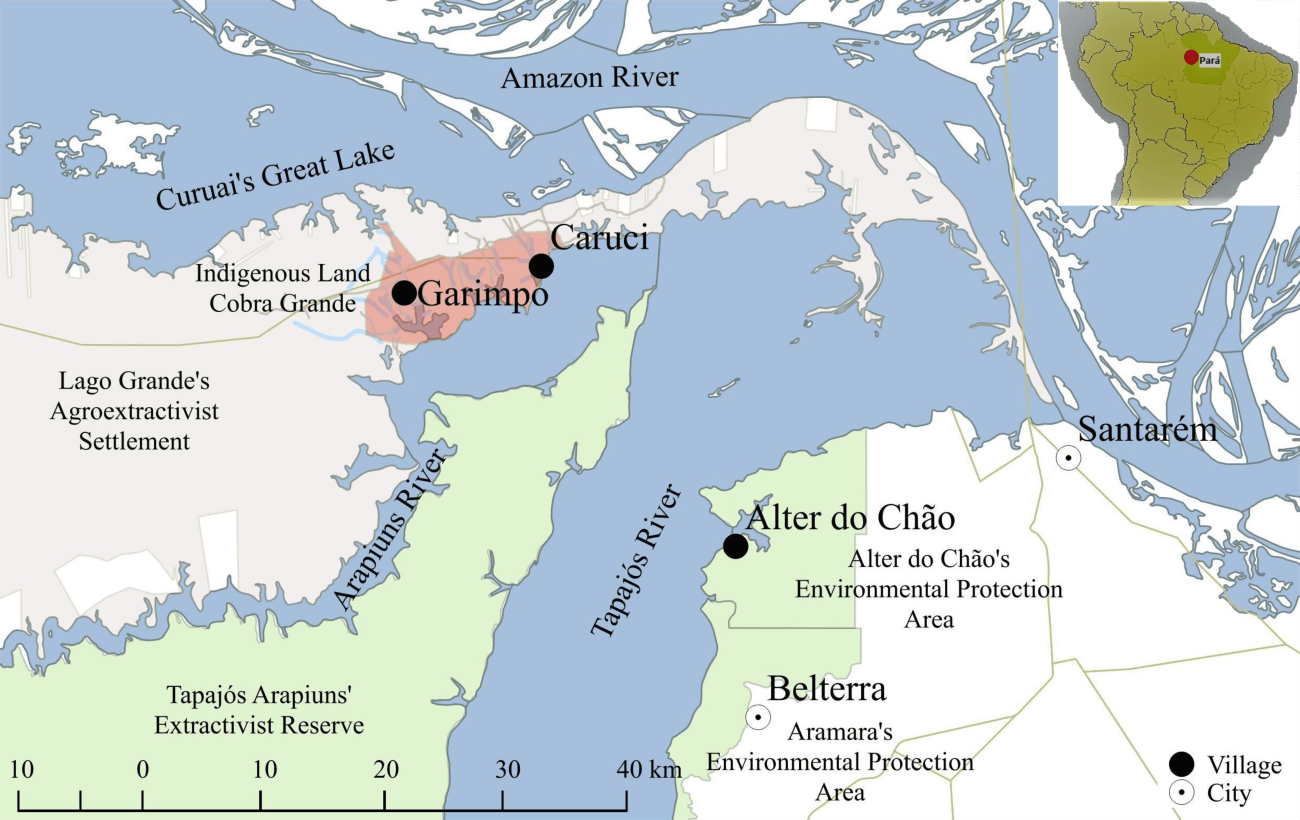
Research area map (De Lima, 2017)
They were selected because of my ongoing fieldwork experience with them since 2008. In 2015, Dr. A.C. Bueno and I conducted 18 audio recorded semi-structured interviews, complemented by exploratory free-lists about constituents of Nature. All participants were adults and the sample respected equal proportions among genders (male and female) and generations (young, adult, senior).
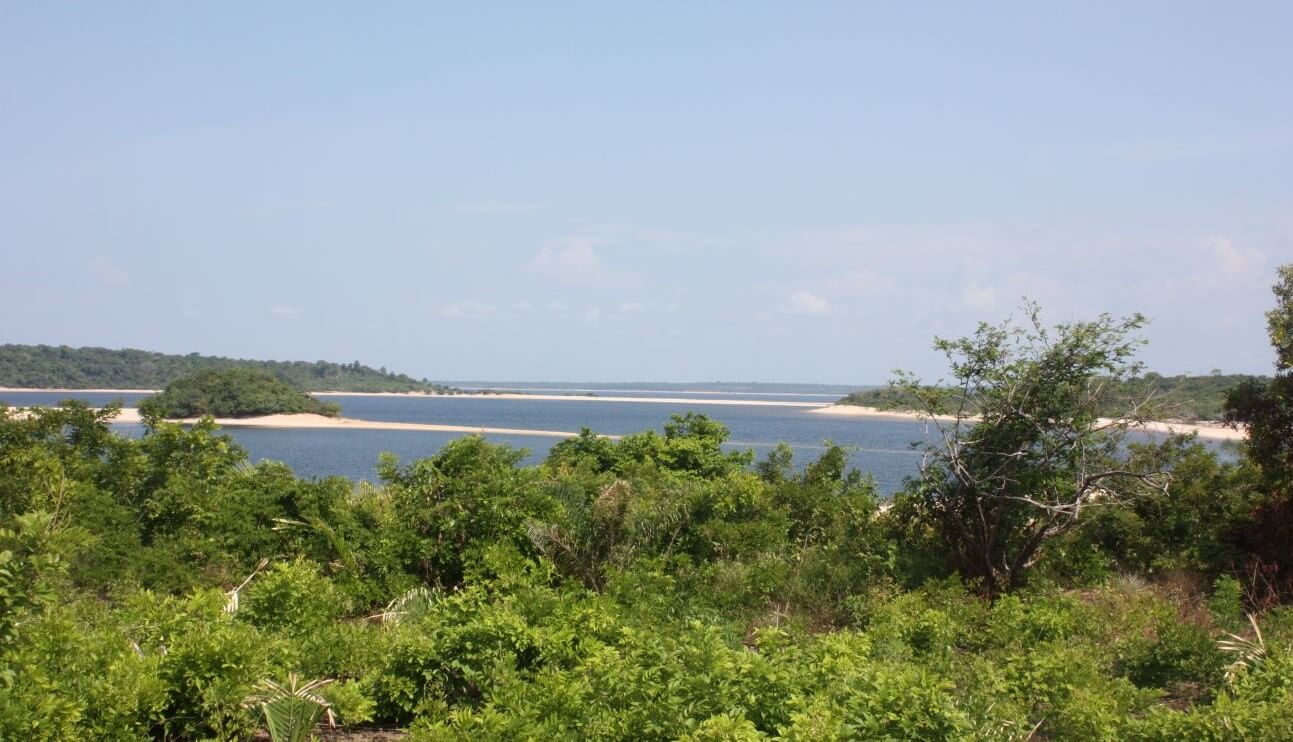
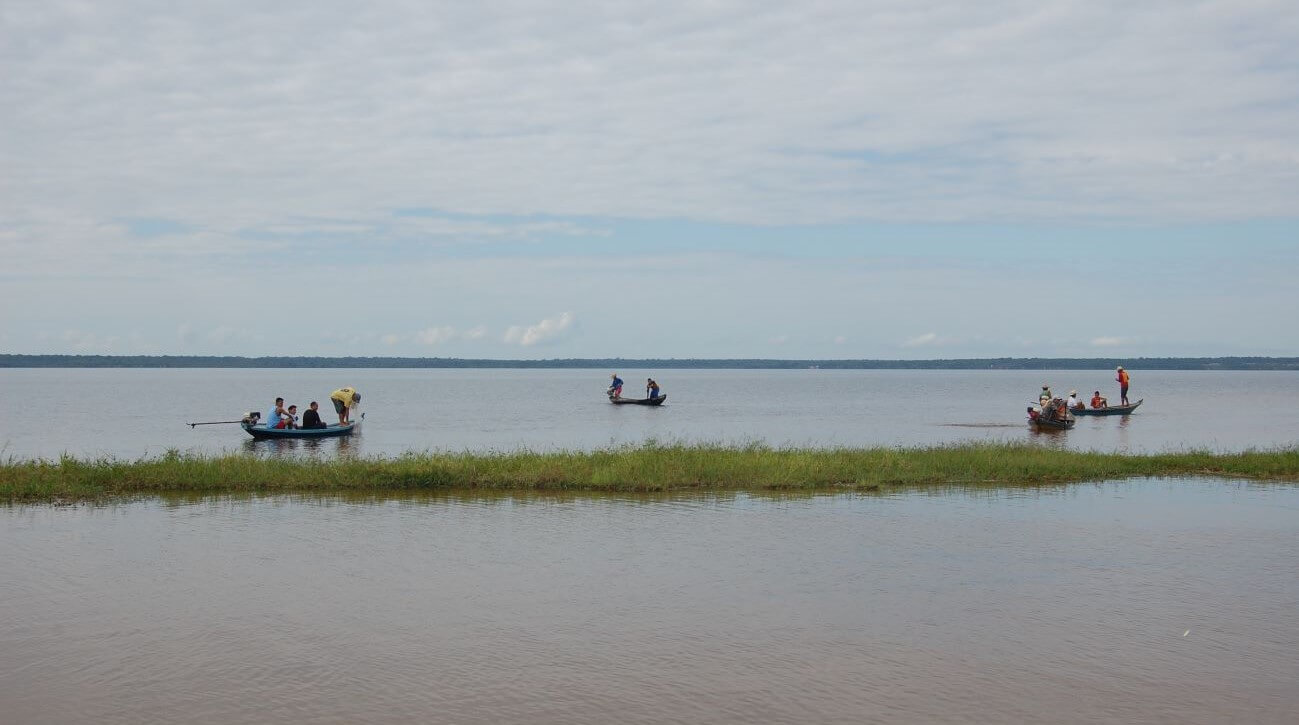
A lake (front) and the Arapiuns river (back) (De Lima, 2015)
Mapping Frequent Words in an Interview Set
MAXQDA 2018 indeed offers several easy-to-use tools to extract basic categories that constitute the world interviewees talked about. I will show how I explored these tools to get to the aimed results:
- Once the project and the corpus of interviews was established, I opened MAXQDA’s Word Cloud feature (in the Visual Tools menu tab) and selected “Word frequencies” to open the resulting table.
- I then stopped accessory words, focusing on nouns and qualities, using the Edit Stop List function.
- Next, I exported the results to Excel by clicking the Open as Excel table icon.
- I repeated the procedure for specific Sets of Documents (e.g. gender groups) to create a comparative table.
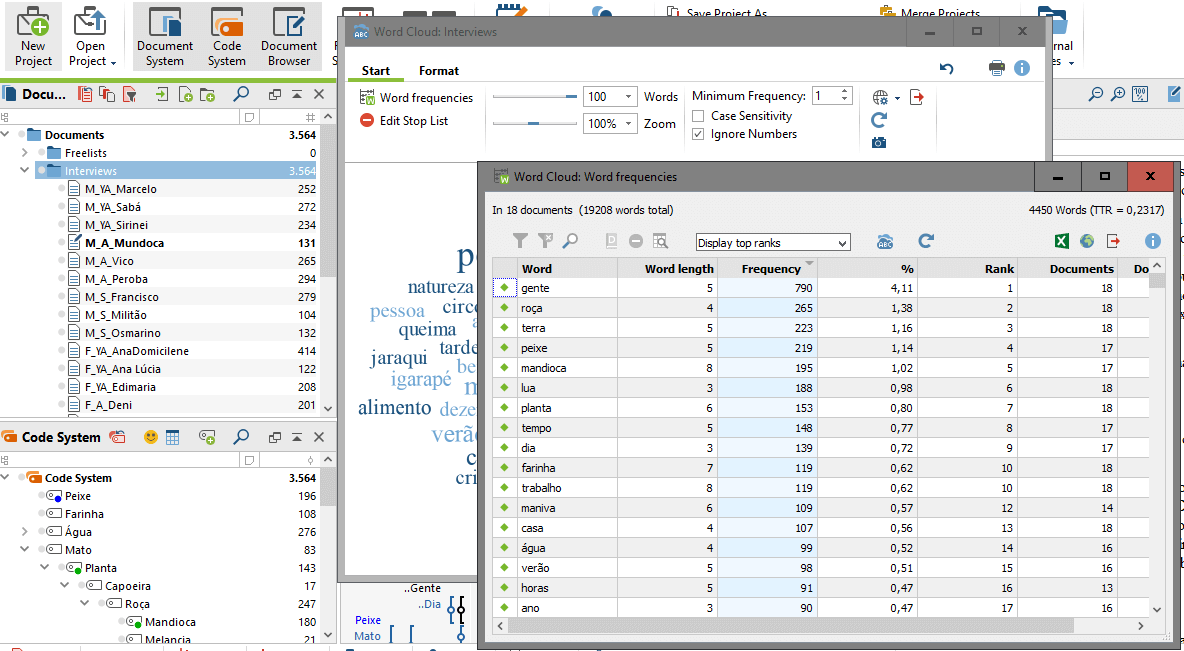
Word Frequencies using MAXQDA’s Word Cloud Feature
Internal comparison is a key methodological procedure because one can observe how frequency varies among respondents. If some words are frequent only to a segment, it does not mean they are irrelevant to others. Therefore, the basic set of shared categories consists of frequent words overall plus those that are salient to a segment. The table below presents the 15 most frequent words overall and for eight sets or subgroups, from which I extracted a list of 35 constituents:
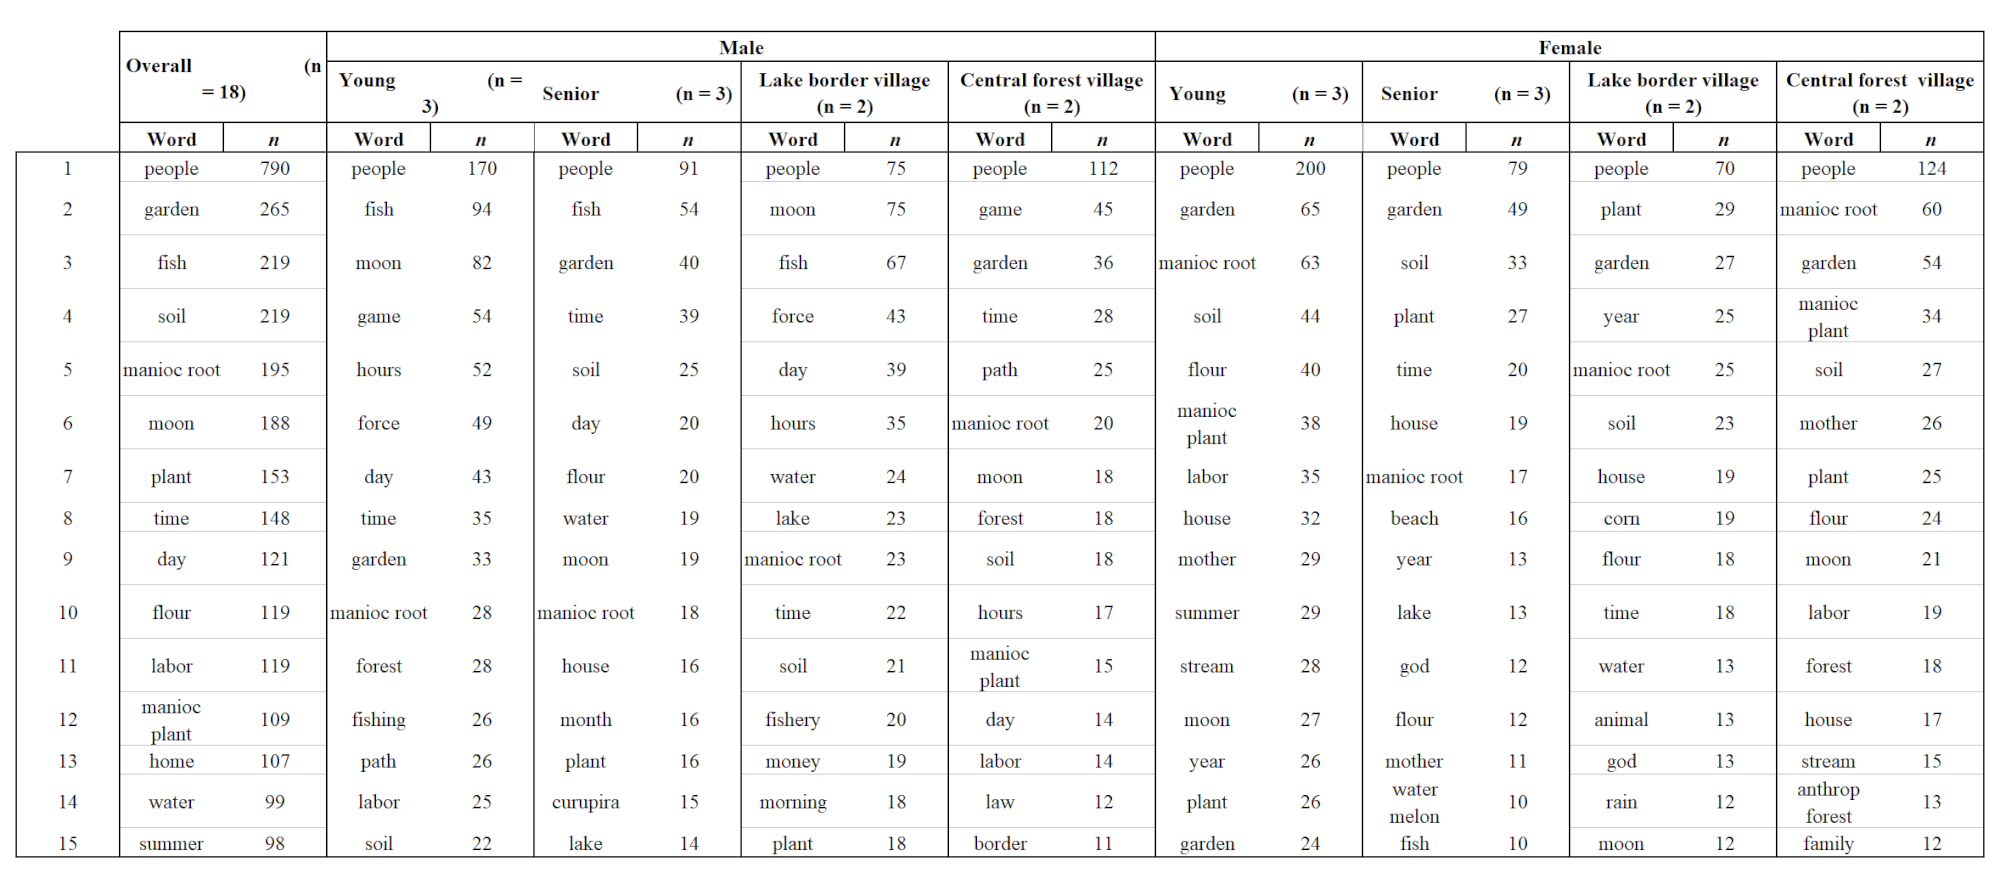
Comparative table made with lists exported from MAXQDA
We can clearly see that in all lists, ‘people’ is the most frequent word used. Overall, ‘people’ is then followed by the words ‘garden’ and ‘fish’, highlighting the core relevance of these activities. Note also that ‘fish’, ‘moon’ and ‘game’ are more salient among male interview participants while ‘plant’, ‘garden’, and ‘manioc’ are the most frequent words used by women.
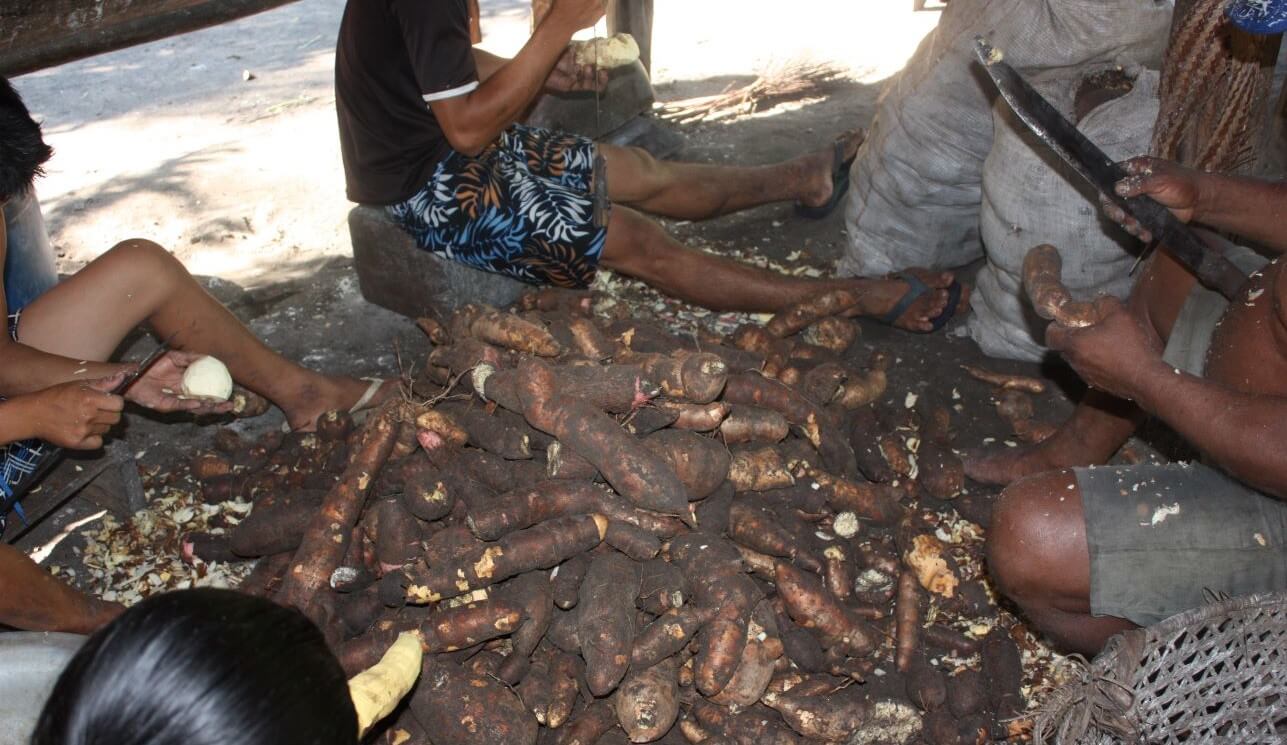
Family peeling roots (De Lima, 2012)
This observation reinforces the hypothesis that male participants’ self-construction is framed by animal predation, whereas women’s and families’ self-construction are more connected to the cultivation of plants.
Men’s fishery (D. G. Macario, 2008)
Turning Keywords into Code Systems and Code Clouds
To build conceptual models out of the lists created, the first step is to convert each of the 35 concepts in the table above into a code. To do so, I did the following:
- I went back into MAXQDA’s Word Cloud feature and once again selected “Word frequencies”.
- I then clicked a word in the Word Cloud to open the Search results table, which also displays previews of instances in which the word appears.
- In the menu, I selected the Autocode+ icon to autocode my search results with a new code. In the pop-up window, I named the new code I created the same word from the Word Cloud but translated from Portuguese to English.
- In the following Autocode menu, I decided to select the option to mark all sentences in which codes appear in texts.
Next, I began to organize my codes into categories in MAXQDA’s “Code System” window by dragging and dropping one code into another (e.g. ‘beaches’ are a kind of ‘soil’; ‘maniocs’ are ‘plants’). This organization allowed me I established evident inclusion relations. Then, I changed the colors of each main code in their specific menu using the right-click menu.
For the first visualization of my coding work, I used MAXQDA’s Code Cloud feature to visualize the most frequently assigned codes by right-clicking on the Interviews folder and choosing the option “Code Cloud”:
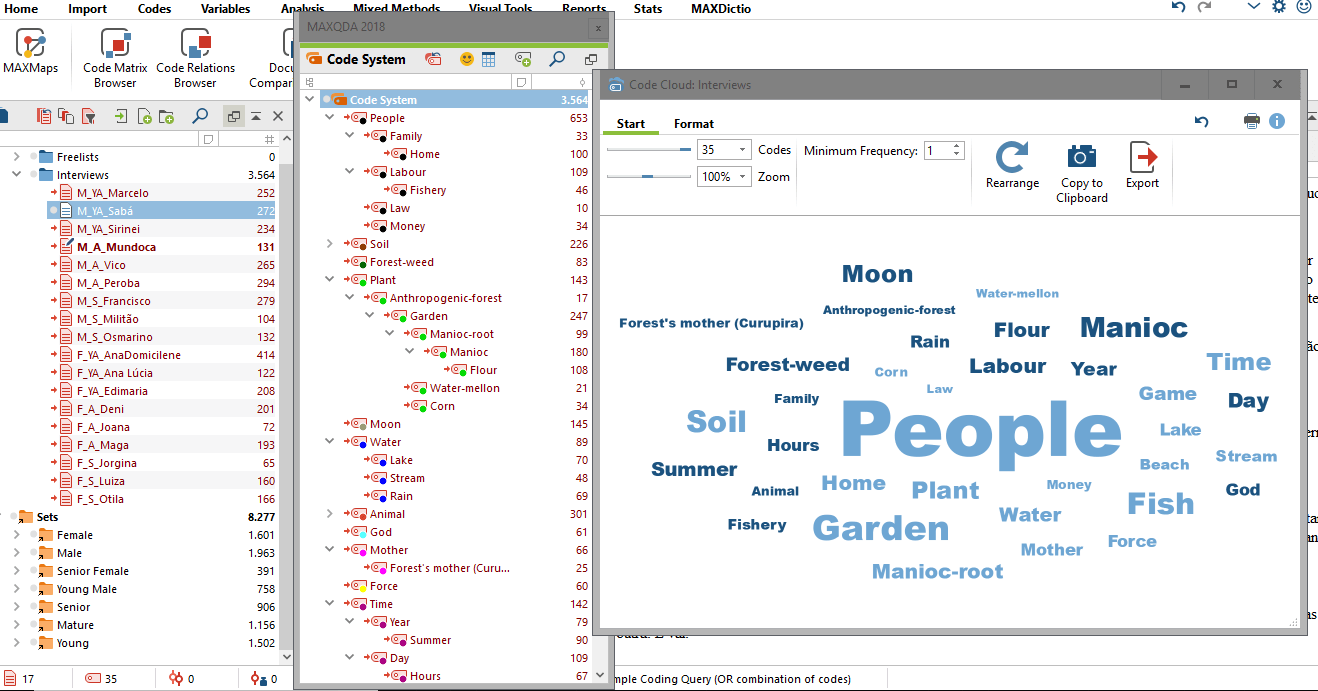
Document System, Code System, and Code Cloud
Code Co-Occurrence Model
To continue our exploration, I then created a Code Co-Occurrence Model using MAXQDA’s MAXMaps feature in order to record the overlaps or common occurrences of codes (under the Visual Tools menu tab). Then, I dragged and dropped my codes into the map and set configurations in the following menu:
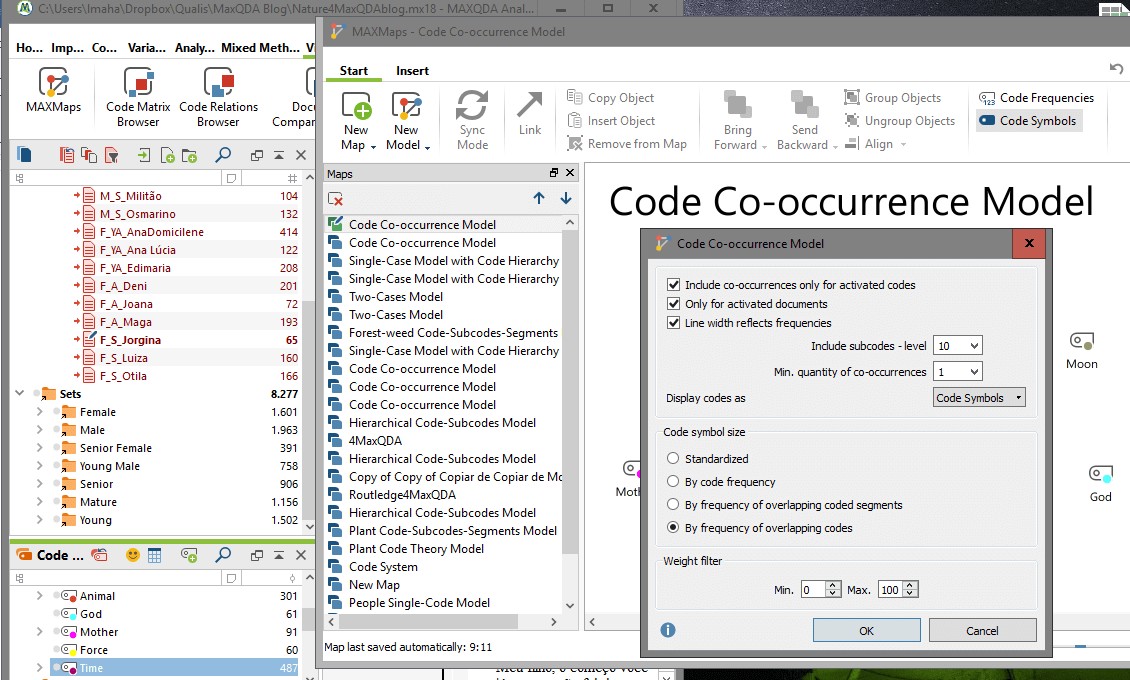
Creating a Code Co-Occurrence Model with MAXMaps
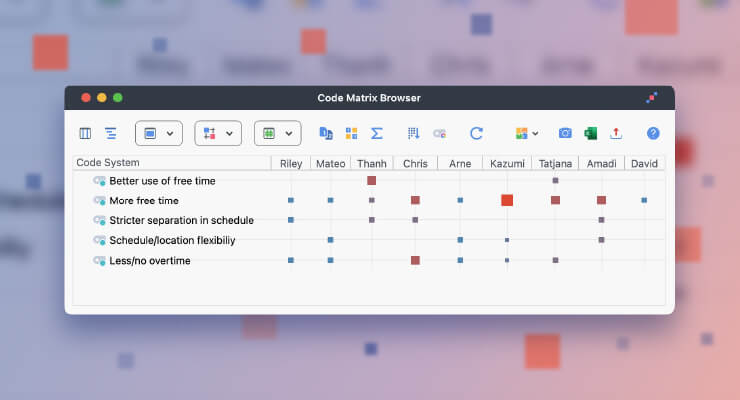
I dropped in all parent codes (all subcodes were activated) to the map and the structure below was automatically created by MAXQDA. The parent codes were placed in the inner circle and the others in the outer. The red lines represent connections between codes of the same subsystem, whereas the gray ones indicate inter subsystem connections. The thickness of lines indicates frequencies of co-occurrences. To change icon properties (font, symbol, borders) I selected each item and right-clicked to open the properties menu.
As we can see, contrasts in line thickness clearly point to the shared importance of people-plant relations among all segments. It also points to the cultural saliency of the close connection between moon and force, an idiom that leads to the logic of periodicity that underlie life cycles and rhythms.
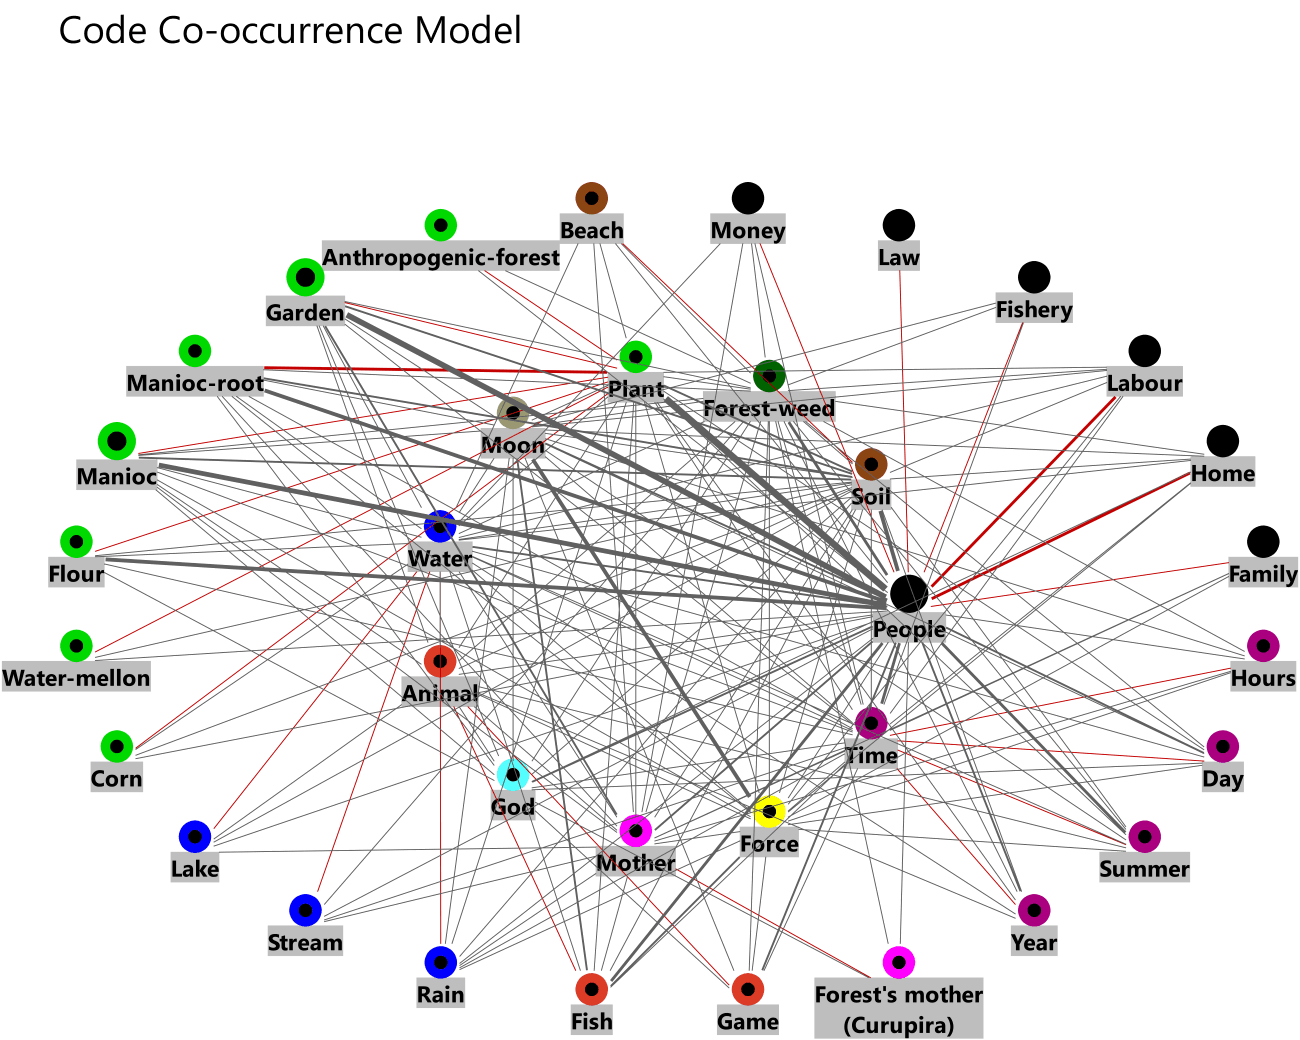
Co-Occurrence connections between codes
Free Modeling Interconnectedness in Lived Spaces
I constructed the model below using a new blank MAXMap by using the following steps:
- First, I dragged and dropped in all parent codes.
- To insert sub-codes if needed, I right-clicked on the code and selected Import Subcodes and changed icon properties to all.
- Then, I freely placed the code groups as if represented in lived spaces: ‘God’ above all; ‘enchanted mothers’ at the bottom; ‘soil’ and ‘water’ generating complementary landscapes on which ‘people’, ‘plants’, and ‘domestic animals’ exist in; ‘Beach’, ‘lake’ and ‘fish’ I placed in the border areas of ‘river’; ‘weeds’, ‘streams’, and ‘game’ in the center of the ‘forest’; and, because of their connection to astronomical codes, ‘moon’, ‘rain’, ‘sun’, ‘force’ and ‘time’ appear in the sky.
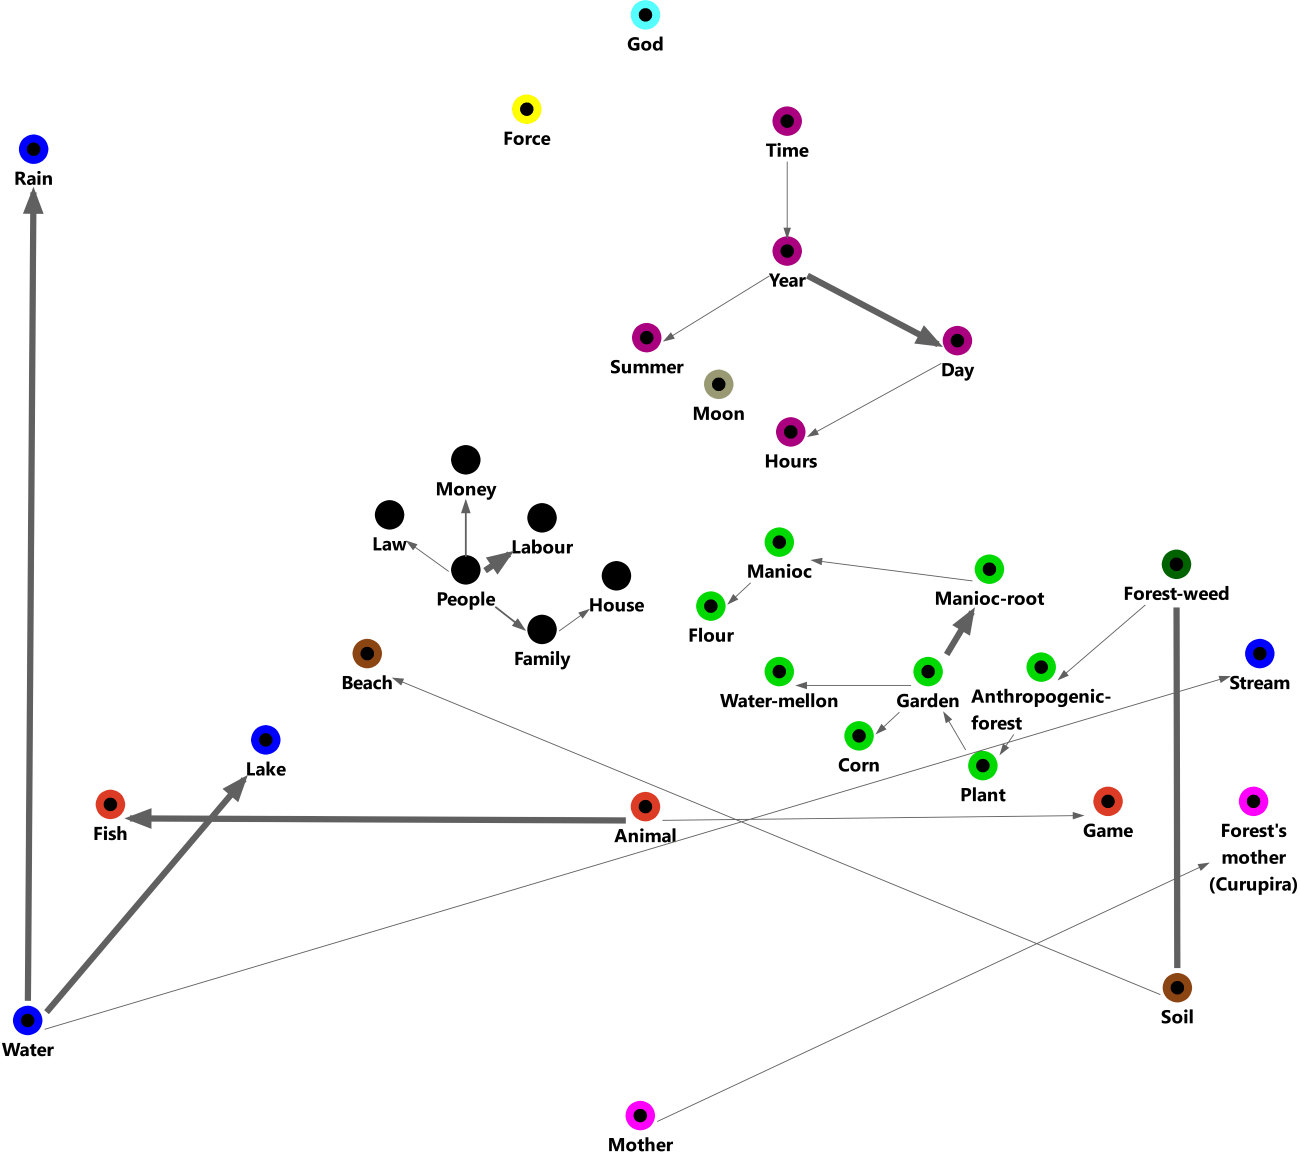
Free model of code interconnectedness in lived space
Final Remarks
As pointed out, Atran & Medin hypothesized a Western-based cultural model of what exists in nature composed of six foundational categories. From a preliminary word frequency analysis in interviews provided by representatives of indigenous peasant villages in Amazonia, my research generated a set of 35 categories (from 11 parent codes). MAXMaps provided an easy way to build innovative conceptual maps out of a code system that represents constituents of the world interviewees talked about. These results generated with MAXQDA 2018 can now be brought back to the field for further collaborative research.
I will show the results of my further fieldwork in a following post, as well as problems affecting the community (e.g., deforestation, soil impoverishment, over-fishing and hunting, weaker, and more unpredictable rains, warmer days, and summers) that occur within these basic constituents.
About the Author
Leandro Mahalem de Lima has a Ph.D. in Social Anthropology from the University of Sao Paulo, Brazil. He is an associated-researcher at the Center for Amerindian Studies (CEstA) at the same university and has been conducting fieldwork among indigenous villagers in the Amazon valley adjacencies since 2008.
 Leandro Mahalem de Lima has a Ph.D. in Social Anthropology from the University of Sao Paulo, Brazil. He is an associated-researcher at the Center for Amerindian Studies (CEstA) at the same university and has been conducting fieldwork among indigenous villagers in the Amazon valley adjacencies since 2008.