Guest post by Adison Soko, Ph.D.
This article describes my experiences using MAXQDA 2018 Analytics Pro for my research on the tension between Equity and Productivity in South Africa’s Land Reform. Divergent views about land inequality in South Africa suggest a link between the land question and the framing of social justice.
This study explored how Black farm workers and White farmers in the Mpumalanga Province of South Africa framed social justice, and how those frames influenced (or were influenced by) the equity/productivity debate.

My argument was that the tension between equity and productivity in South Africa’s land reform is a function of how participants frame social justice. The two groups, farm workers and farm owners, had a shared colonial history of racial tension. They seemed to view social justice through different prisms. This study sought to explore the social justice frames each group was using.
Research Data
My sample of 24 farm workers and 6 farmers was taken from Mpumalanga province whose map is shown below. The circles show the exact locations were the interviews took place. I chose this province because of two major factors:
- First, the climatic contrasts between the drier Highveld region and the hot humid Lowveld allow the province to grow 18 agricultural crops. This diverse range of crops usually attracts a diverse labor force with the potential to offer the researcher a deep reservoir of experiences.
- Second, Mpumalanga is the only South African province to border two countries, Mozambique and Swaziland. In addition, it also borders four South African provinces of Limpopo, Gauteng, Kwa Zulu Natal, and Free State. This unique geographic location allows farm owners to recruit farm workers from many different cultures.
These two unique factors, climate and location, provided a sample of farm workers and farm owners which were a microcosm of the agricultural sector in South Africa.
Analyzing the Data with MAXQDA
The following are some of the MAXQDA functions I used and found to be useful:
- Transcription of Interviews
- Importing and Exporting Documents
- Coding
- Creating subcodes and changing code names
- Writing, tracing and analyzing memos
- Activating documents and codes
- Creating code frequencies and retrieving coded segments
Transcription
Data gathering was conducted in the form of semi-structured interviews using open-ended questions and MAXQDA was used to transcribe and code the data.
After daily interview sessions, audiotapes were downloaded and transcribed into conversation transcripts for each participant. I used MAXQDA’s Transcription Mode to transcribe these interviews. Using this MAXQDA feature saved a lot of time compared to manual transcription and set up the next coding stage. See screenshots below:
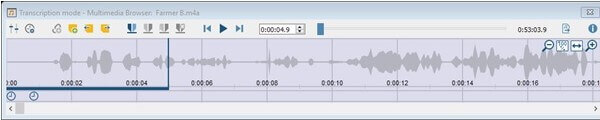
MAXQDA’s Transcription Mode
Transcripts of the interviews in MAXQDA
Coding
A critical inquiry theoretical framework and critical ethnography (a qualitative methodology) were used to capture participant’s micro-narratives, ideas, and experiences. The coding stage of my analysis involved identifying segments of the transcripts that captured an idea, an event, a process, or a value. There are three things every budding researcher should know:
- You must learn to code well and easily.
- Coding forces you to understand what is still unclear.
- To unlock the value of qualitative data, you must be open-minded and context-sensitive.
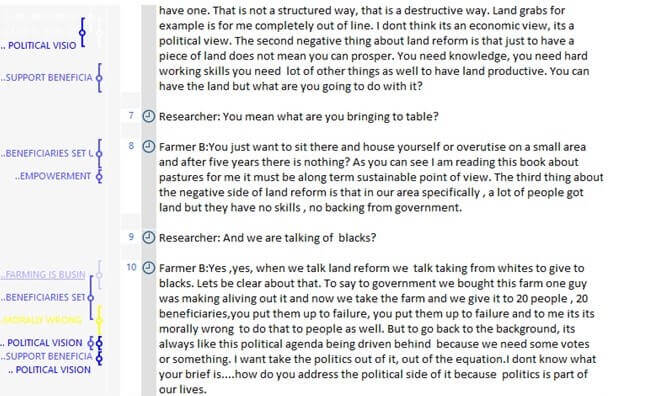
My aim during coding was to capture participants’ experiences with land reform and their framing of social justice. Using line-by-line coding (Charmaz, 2006), I combed their narratives for any signs of emotion, be it fear, courage, hope, insecurity, happiness, anger, hatred, or frustration (Rubin & Rubin, 2011). In fact, the aim was to code for anything that would aid the analytic process even if it fell outside the above categories.
During this initial coding phase, I generated 442 codes. Table 1 below is a screenshot of the Code System depicting one code and seven subcodes selected from the 442 initial codes.
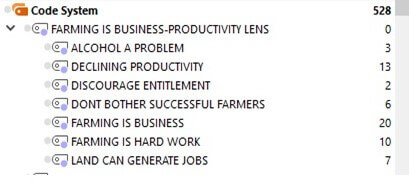
Table 1: A Screenshot of the Code System
A code is thus a word, phrase, or sentence that represents aspect(s) of data or captures the essence of feature(s) of data (Saldana, 2013).
Categorizing
Further analysis reduced the 442 codes to 18 categories. This enabled me to see evidence of the same pattern and properties. Some categories contained clusters of coded data that merited further refinement into sub-categories. When I compared the categories with each other, I began to transcend the ‘reality” of my data.
At this point, I progressed towards thematic, conceptual and theoretical frames. Morse (2007) argues that “categorizing” is how we move up from the “diversity” of data to the “shapes” of the data and the types of things represented. Table 2 below shows 8 of the 18 categories.
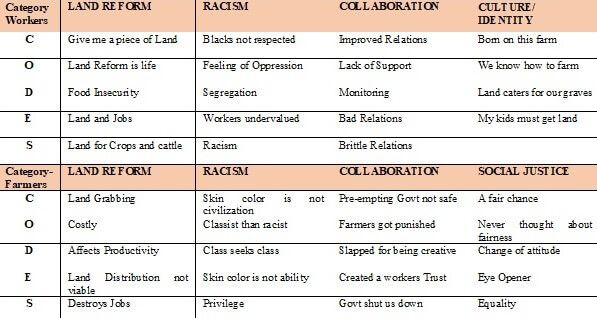
Table 2: Categories
As you formulate a category, you begin to see and explain its properties. You also can specify conditions under which it arises, is maintained and changes. Finally, you can describe its consequences and how the category relates to other categories. A category, therefore, is part of developing an analytic framework.
By categorizing, you select certain codes as having an overriding significance in explaining events or processes in your data. A category may subsume common themes and patterns in several codes (Charmaz, 2006).
Code Frequencies
MAXQDA’s Code Frequencies function enabled me to visualize the weight of each code. Before going deeper into my analysis, I could see at a glance the issues that were a top priority for my participants. The screenshot below shows those codes that were weighted 30% and above.
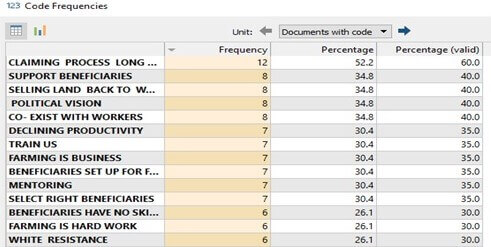
Code Frequencies Table in MAXQDA
What this tool does is give you a sense of where your analysis is going. It helped me zero in on those codes that had the greatest weighting in each category.
Memo-writing
Memo writing was the intermediate step between coding and the first draft of my completed analysis. This process took place in between and in tandem with the activities of interviewing, transcribing and coding.
Writing memos is a critical step in the coding process. A memo may contain ideas and/or theory about codes and their relationships as they strike the analyst while coding. It can be a sentence, a paragraph or a few pages (Glaser, 1978). Below is a screenshot of my memos within MAXQDA and an example of a memo.
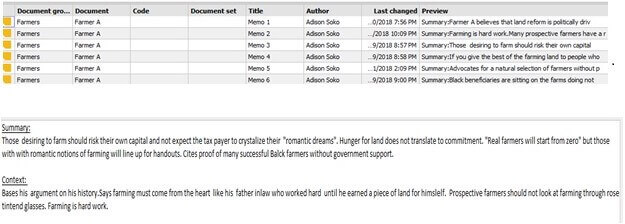
Table view of memos in MAXQDA and an example of a memo
Memos are primarily conceptual in intent. They don’t just report data, they also tie together different pieces of data into a recognizable cluster, often to show that those data are instances of a general concept. According to Saldana (2015), they are one of the most useful and powerful sense-making tools at hand. You can write memos to yourself, primarily, but also to your research team.
In my analysis, I was writing memos (a) on what was intensely puzzling or surprising about an interview, (b) to propose a specific new pattern code (c) to integrate a set of marginal or reflective remarks already made on field notes and (d) when I did not have a clear concept in mind but was struggling to clarify one (Saldana, 2013). Memos helped me rise above my data. They cleared up what was fuzzy and flagged emerging concepts.
Conclusions
The data revealed four malleable frames viz: Outcome, Characterization, Process, and Aspiration. Malleable frames indicate where the interests of both black and white farmers overlap. These offer an opportunity for policymakers to reframe the land dialogue in South Africa. The data also revealed that while two frames, Identity and Power, were rigid and would present a challenge to negotiations, the Loss-Gain frame was partly rigid and partly malleable, offering another opportunity for areas of compromise.
My conclusion was that prescriptions for land and agrarian reforms in South Africa ought to respond to the voices of the landless poor while addressing the concerns of White commercial farmers who genuinely believe that South Africa is their home. From a policy perspective, some of the frames that emerged from this study offer a new trajectory for land reform in South Africa.
MAXQDA 2018 Analytics Pro can be used for a host of other data handling features. However, in this article, I focused on my experience during the qualitative data coding component of my Ph.D. research dissertation.
About the Author
Adison Soko is the Chief Executive of Savanna Consultancy LLC, a US based Agri-consulting company. He graduated from Southern New Hampshire University in Community and Economic Development (2009) and in Finance (2012).
He conducted his doctorate in Ethical and Creative Leadership at the Union Institute and University (2018) under joint supervision with the Research Council of South Africa. His dissertation won The Marvin B. Sussman Award.
 Adison Soko is the Chief Executive of Savanna Consultancy LLC, a US based Agri-consulting company. He graduated from Southern New Hampshire University in Community and Economic Development (2009) and in Finance (2012).