Introduction: A Powerful Technique for Time-Pressed Researchers
Every qualitative researcher knows the challenge: mountains of interview transcripts, tight deadlines, and the need to produce rigorous, insightful findings. What if there were a systematic approach that could dramatically speed up your analysis without sacrificing quality?
This blog post introduces a workflow using MAXQDA’s Code Comments feature to write concise summaries for each coded segment—an approach that transforms how you move from raw data to finished report. The methodology presented here is adapted from Stefan Rädiker’s chapter “Using MAXQDA’s Code Comments for Rapid Analysis: Writing Summaries for Analyzing and Reporting in Evaluation,” published in The Practice of Qualitative Data Analysis: Research Examples Using MAXQDA (Rädiker & Gizzi, 2024).
In the original chapter, Rädiker demonstrates this technique through an evaluation project analyzing interviews with caregivers in Germany. However, the approach he developed is far more versatile than that single application suggests. Whether you’re conducting academic research interviews, program evaluations, focus groups, case studies, or analyzing open-ended survey responses, this summary-based workflow can help you work more efficiently while maintaining methodological rigor.
Let’s explore how you can implement this technique in your own MAXQDA projects.
Why Code Comments Change Everything
MAXQDA allows you to attach a short comment to every coded segment in your data. While many researchers overlook this feature or use it only occasionally for notes, Rädiker’s approach transforms code comments into the analytical engine of your project.
Writing summaries in code comments
The core insight is simple but powerful: by writing a brief summary of each coded segment as you code, you create a compressed layer of your data that allows you to work at a higher level of abstraction. Instead of repeatedly rereading lengthy interview passages (which can be convoluted, tangential, or difficult to scan quickly), you work with your own distilled summaries while keeping the original data just a click away.
This approach offers several key benefits:
Speed: Once summaries exist, you can review the content of a code in minutes rather than hours, scanning dozens of summaries rather than pages of transcript text.
Clarity: The act of writing a summary forces you to identify what’s actually relevant in each segment, sharpening your analytical thinking during the coding process itself.
Flexibility: Summaries can be easily exported, reorganized, clustered, and visualized using MAXQDA’s tools—enabling rapid subcode development and insight generation.
Traceability: Because summaries remain linked to original segments, you can always verify your interpretations against the source data.
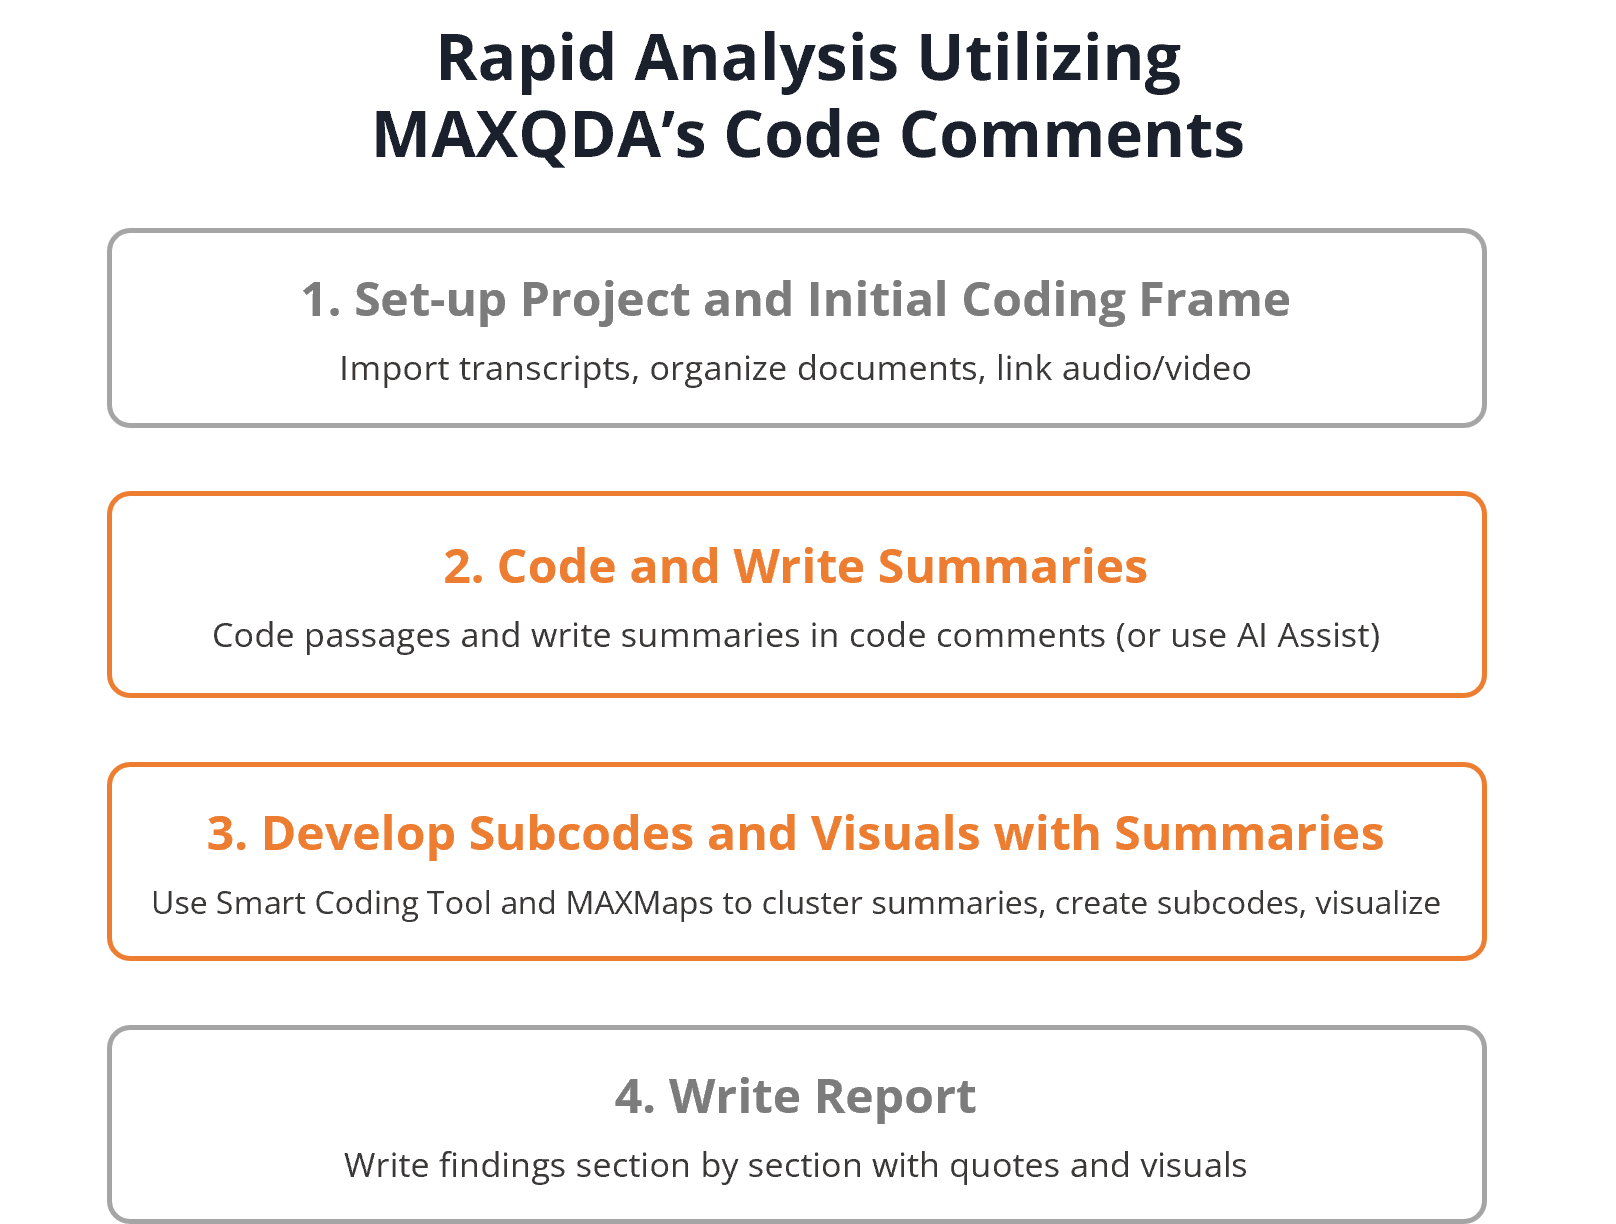
The Core Workflow: From Coding to Summary to Insight
The summary-based analysis approach follows a logical sequence that integrates naturally with qualitative content analysis and other systematic approaches to qualitative research.
Phase 1: Project Setup and Initial Coding Frame
Begin by preparing your data for import. If you’re working with audio or video recordings, MAXQDA Transcription offers automatic transcription that can significantly speed up this initial phase. Simply import your recordings into the MAXQDA project file, and MAXQDA will generate timestamped transcripts that integrate seamlessly into your project. This eliminates the time-consuming manual transcription step while maintaining the crucial link between transcript text and original recordings.
Once your transcripts are ready—whether auto-generated or imported from external sources—organize your documents logically in the Document System. If you’re comparing groups, create separate document groups. If you’re analyzing data from different time points or sites, structure accordingly. This organization will pay dividends when you analyze by comparing summaries across groups.

Documents organized into document groups in MAXQDA’s “Documents” window
With your documents organized, create an initial coding frame based on your research questions, interview guide, or theoretical framework. Rädiker recommends starting with a manageable number of codes (around 10 main topic codes) to ensure ease of application during the initial coding phase.

Initial coding frame in MAXQDA’s „Codes“ window
Phase 2: Coding with Simultaneous Summary Writing
This is where the approach diverges from standard coding practice. As you (or your research team) code each segment, immediately write a summary capturing the essential content.
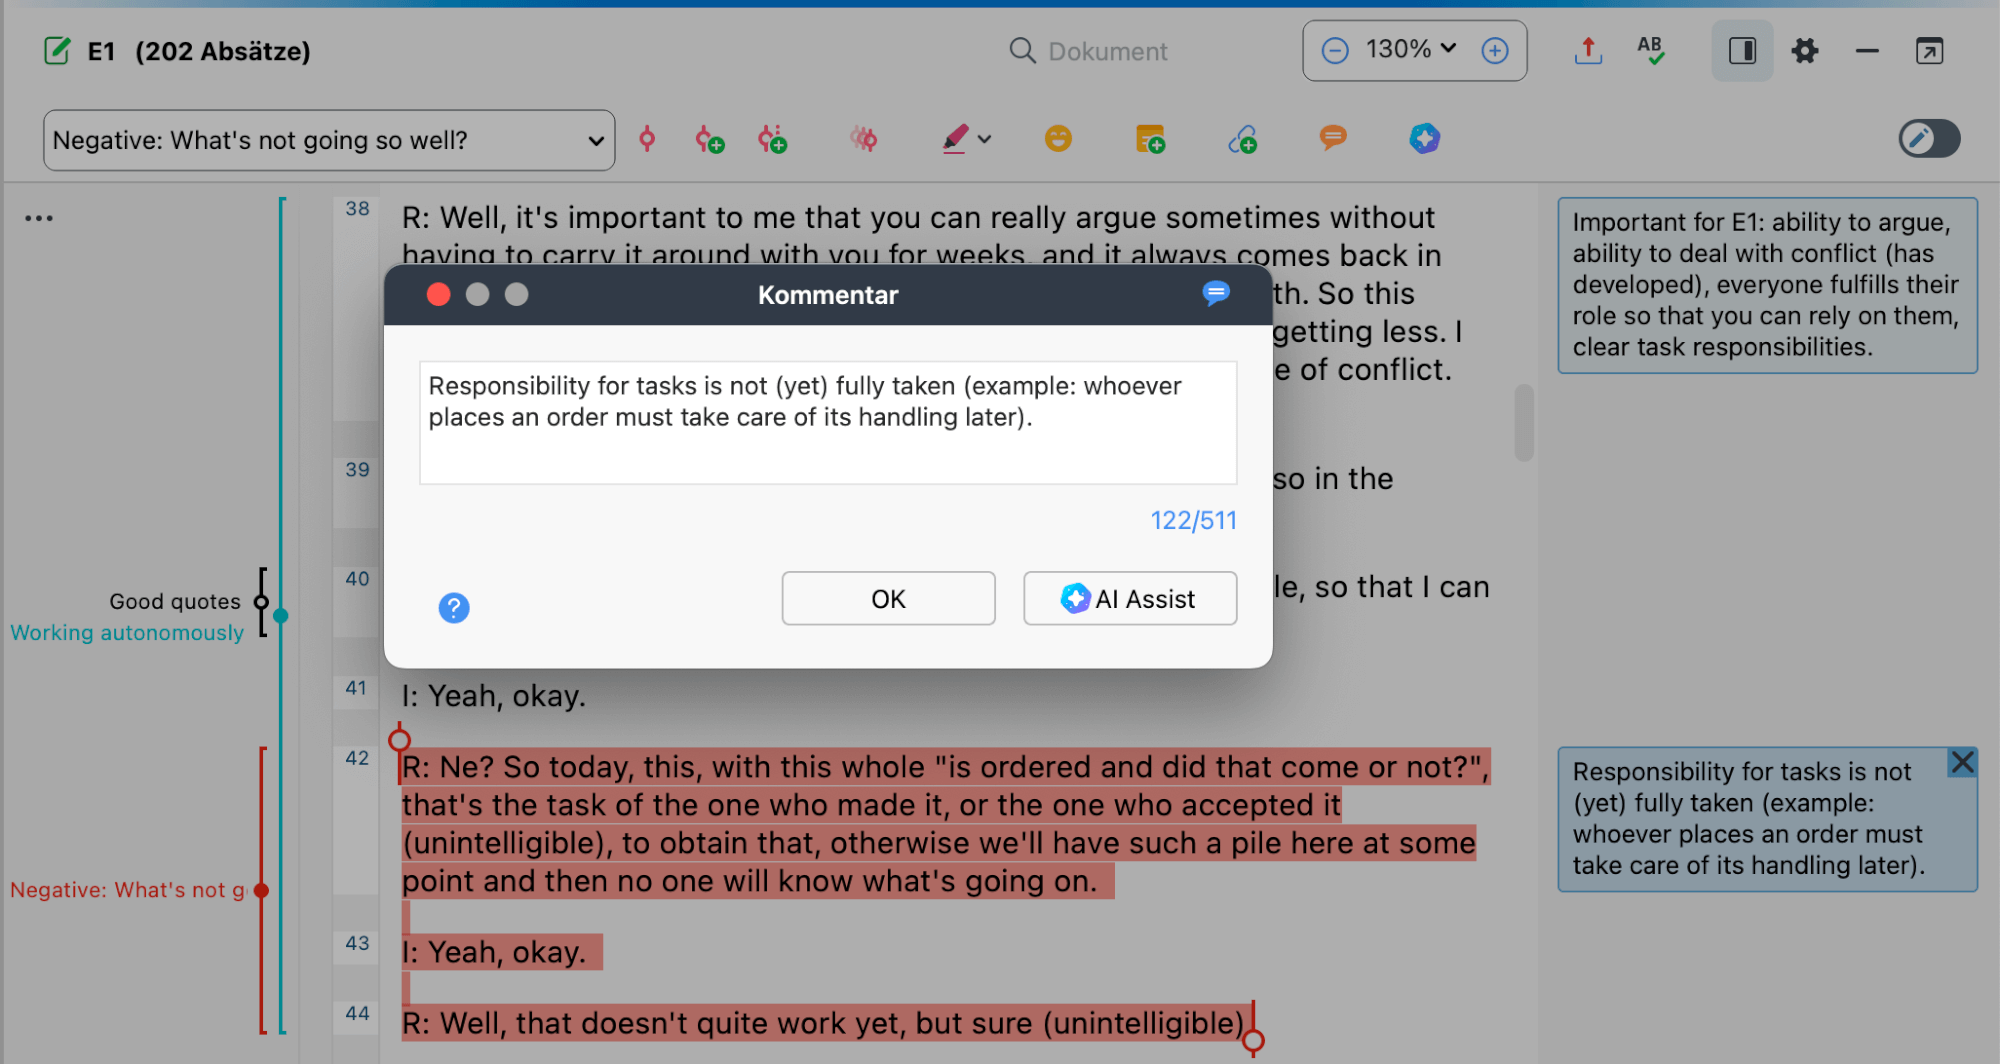
To write a code comment in MAXQDA:
- Code a text passage using your preferred method (highlighting and dragging to a code, using the quick coding bar, etc.)
- Double-click on the coding stripe that appears in the left margin of the Document Browser
- In the dialog box that opens, write your summary in the comment field
- Click OK to save
Summarizing content into the code comment field of MAXQDA
What you’ll see in the interface: After saving, coded segments with comments display a small filled circle in the middle of their coding stripe, providing a quick visual indicator of which segments have been summarized. You can also display existing comments in a sidebar to the right of your document text, making it easy to see your summaries while coding.
Guidelines for Writing Effective Summaries
The quality of your summaries determines the success of this approach. Based on Rädiker’s experience, here are essential principles:
Be descriptive, not interpretive: Summarize what the participant said, not what you think it means. Save interpretation for later analytical stages.
Be concise: MAXQDA’s code comments have character limits (approximately 500 characters). This constraint is actually beneficial—it forces you to identify the core content. Even with expanded limits, shorter summaries are easier to scan and organize later.
Use consistent notation: Develop conventions for your project and apply them systematically:
- Use square brackets [ ] for your own thoughts, questions, or interpretations: “[possible contradiction with earlier statement?]”
- Use round brackets ( ) for cross-references: “(see also par. 45-47)”
- Use double quotation marks ” ” for direct quotes from the transcript
- Use single quotation marks ‘ ‘ for terms or concepts you’re naming
Focus on what matters for your codes: The same text passage might be coded with multiple codes. If so, tailor each summary to reflect what’s relevant for that particular code’s focus.
Using the Smart Coding Tool for Analysis
Once you’ve completed coding and summary writing, MAXQDA’s Smart Coding Tool becomes your primary workspace for analysis.
Accessing and Configuring the Smart Coding Tool
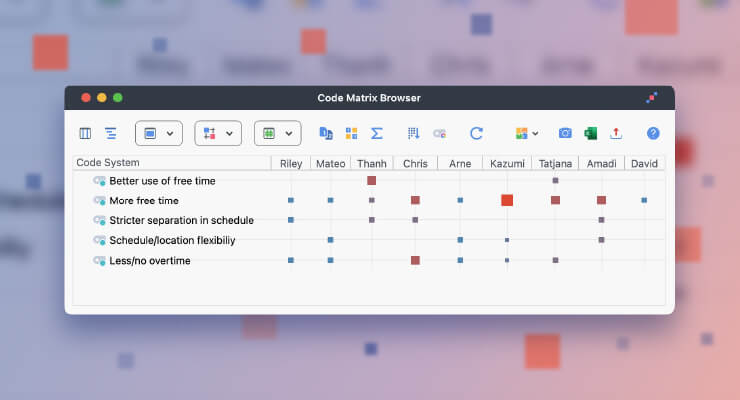
Launch the Smart Coding Tool from the Codes menu ribbon. The window displays your code system on the left; clicking any code compiles all segments coded with that code on the right.

Smart Coding Tool: all segments coded with a code at a glance
The tool also displays a “Codes” column showing any additional codes applied to each segment. This proves especially useful if you’ve created a “Good Quotes” code or similar marker—you can quickly identify which summaries represent passages suitable for inclusion in your final report.
Developing Subcodes from Summaries
For each main code that requires deeper analysis, Rädiker developed a systematic procedure:
- Export summaries: From the Smart Coding Tool, export all summaries for a main code to a Word table
- Add a column for coding: Insert a column on the right side for developing subcode names and notes
- Cluster by similarity: Reorder rows so similar summaries are grouped together
- Name emerging subcodes: Identify patterns and create subcode names that capture what groups of summaries address
- Apply subcodes in MAXQDA: Return to the Smart Coding Tool to create and apply these subcodes
- Write your findings: Draft the corresponding section of your report

Developing codes in Word utilizing an extra column in the exported table
One creative technique Rädiker employed: the “Jeopardy Strategy.” Instead of naming subcodes as topics, formulate them as questions that the summaries answer. For example, if analyzing data about autonomous work practices, subcodes might become “What does autonomy mean?” and “Where are the boundaries of autonomy?” These question-format subcodes then serve as natural section headings in your report.
Using MAXMaps for Visual Organization
While the Smart Coding Tool with Word export works well, Rädiker found MAXMaps even more powerful for organizing summaries and generating insights. MAXMaps provides a visual workspace where you can arrange, cluster, and annotate your summaries spatially.
Importing Summaries into MAXMaps
- Open Visual Tools > MAXMaps and create a new empty map
- In MAXQDA’s main window, double-click on a code to open the Overview of Coded Segments
- Select all rows (Ctrl+A on Windows, ⌘+A on Mac)
- Drag the selected rows onto your empty map
What happens: MAXQDA automatically imports the comment text (your summary) for each segment, along with source information showing the document name and paragraph number. This allows you to work with all summaries for a code in a visual, non-linear format.

Inserting summaries into the visual workspace MAXMaps
Organizing and Analyzing in MAXMaps
With summaries on your map, you can:
- Cluster related summaries: Drag summaries that address similar aspects together
- Add colored background shapes: Use rectangles or other shapes to visually group clusters
- Create labels and headings: Add text elements to name emerging themes or aspects
- Maintain source connections: Keep paragraph numbers visible for traceability
Hover over any summary in MAXMaps to see the original coded segment in a tooltip. If more context is needed, click the summary to jump directly to that passage in the Document Browser.
The visual workspace allows you to think spatially about your data—a significant advantage over linear tables when dealing with complex, multidimensional themes.
Creating Visualizations for Reports
As you organize and cluster your summaries in MAXMaps, you’re simultaneously creating visual representations of your analysis. The maps you build during the analytical process—with their clustered summaries, colored groupings, and descriptive labels—can serve directly as figures in your final report. Copy completed maps as high-resolution images using the Copy function on the Start ribbon, and customize colors, shapes, and labels to create publication-ready graphics.
Beyond summary-based maps, MAXMaps also offers tools to visualize your code system itself. Use the Hierarchical Code-Subcodes Model to generate maps that display your refined code structure with frequency counts—providing readers with a clear overview of your analytical framework and the distribution of themes across your data. These code structure visualizations work independently of segment summaries, giving you flexibility in how you represent your findings visually.

Visualization of summaries created with MAXMaps
Applications Beyond Evaluation Research
While Rädiker developed this technique for a specific evaluation project, the approach transfers readily to diverse qualitative research contexts.
Academic Interview Studies
Researchers conducting dissertation research or studies involving 15-30+ interviews face the challenge of maintaining closeness to data while seeing patterns across cases. Writing summaries creates a navigable layer between you and hundreds of pages of transcripts, making cross-case analysis more manageable.
Example application: A researcher studying career transitions might code interviews with 25 professionals. Summaries allow them to quickly scan how all 25 discussed “turning points” without rereading 25 lengthy passages—while being able to verify any insight against original data.
Focus Group Analysis
Focus groups generate dense, multi-voice data that can be especially difficult to parse. Summaries help you track who said what about each topic and identify areas of agreement or disagreement.
Example application: After conducting focus groups with teachers about a new curriculum, you might create summaries capturing each substantive contribution. Later analysis can distinguish between widely shared concerns and perspectives held by only one or two participants.
Mixed Methods Research
When qualitative components support or explain quantitative findings, efficiency matters. The summary approach allows you to integrate qualitative insights into mixed methods reports without getting lost in transcript details.
Example application: Survey findings show that employee satisfaction dropped after an organizational change. Follow-up interviews explore why. Summaries let you quickly identify and report the key explanatory themes without extensive transcript immersion.
Rapid Assessment and Applied Research
Consulting, market research, UX research, and policy analysis often operate under extreme time pressure. This methodology is ideal when you need credible qualitative findings fast—and integrates well with MAXQDA’s AI features.
Leveraging AI Assist for Summary Creation
Current versions of MAXQDA include AI Assist features that can automatically generate summaries for coded segments. This represents a significant time-saving opportunity.
You can utilize AI Assist to:
- Summarize a single coded segment in the Document Browser
- Automatically summarize all coded segments of a selected code at once in the Smart Coding Tool
The AI-generated summaries are stored in code comments, exactly as with manual summaries. This allows you to use AI for the initial summary creation while still reviewing and refining summaries for accuracy—maintaining quality while dramatically reducing time investment.
Practical Tips and Troubleshooting
Use two monitors if possible: Running MAXQDA’s main window on a second monitor while working with the Smart Coding Tool or MAXMaps on the main monitor dramatically improves oversight.
Duplicate summaries when multi-coding: When you drag an existing coding stripe to apply an additional code, MAXQDA automatically copies the existing summary to the new code assignment. You may need to adjust the duplicated summary to reflect the different code’s focus.
Refine your code system iteratively: As you work with summaries, you’ll often discover that codes need renaming, reorganizing, combining, or splitting. Make these changes directly in the Smart Coding Tool—right-click options let you remove code assignments or reassign segments to different codes.
Keep original segments accessible: Don’t become so reliant on summaries that you lose touch with original data. Use tooltips in MAXMaps and the Coded Segments column in Smart Coding Tool to verify summaries against source text, especially when preparing quotes for reports.
Establish team guidelines: If multiple coders are writing summaries, develop clear guidelines (like the notation conventions above) and review early work together to ensure consistency.
Conclusion: Working Smarter with Your Qualitative Data
The summary-based approach to qualitative analysis—writing concise summaries in MAXQDA’s code comments and then working with those summaries through the Smart Coding Tool and MAXMaps—offers a practical pathway to faster, more efficient analysis without compromising rigor.
This technique, developed by Stefan Rädiker for rapid evaluation research, proves valuable across qualitative research contexts wherever researchers face time pressure, large datasets, or the challenge of moving efficiently from coded data to written findings.
The key insight is using MAXQDA’s features strategically: code comments become more than incidental notes—they become the analytical layer you work with day to day. The Smart Coding Tool and MAXMaps become not just review tools but active workspaces for developing your analysis.
For the complete methodology with detailed examples and figures, consult Rädiker’s original chapter in The Practice of Qualitative Data Analysis: Research Examples Using MAXQDA. The book provides extensive additional context and demonstrates the technique through the full evaluation project that inspired this approach.
Learn More
This blog post is adapted from:
Rädiker, S. (2024). Using MAXQDA’s Code Comments for Rapid Analysis: Writing Summaries for Analyzing and Reporting in Evaluation. In S. Rädiker & C. Gizzi (Eds.), The Practice of Qualitative Data Analysis: Research Examples Using MAXQDA, Volume 2 (pp. 71-86). MAXQDA Press. https://doi.org/10.36192/978-3-948768188_4
For additional resources on qualitative analysis with MAXQDA:
- Kuckartz, U., & Rädiker, S. (2019). Analyzing Qualitative Data with MAXQDA: Text, Audio, and Video. Springer. https://doi.org/10.1007/978-3-030-15671-8
- Rädiker, S., & Kuckartz, U. (2020). Focused Analysis of Qualitative Interviews with MAXQDA. MAXQDA Press. https://doi.org/10.36192/978-3-948768072