Guest post by Ruijie Peng.
Getting Grounded in the Field – Analyzing Participant Observation Data with MAXQDA’s Visual Tools
This fieldwork diary entry is an update to my previous research phase, in which I had just arrived in rural China to begin my year-long ethnography. I have now experienced a transition from “awkwardly” hanging out with the first group of five households in my study, to a more natural method of participant observation with different families during their daily activities. As I mentioned last time, my strategy was to divide the households into different groups so that I could visit a different family each day. This way, the families participating in my study could attend to their own business, and I could also accumulate the time I spend with each family.
Currently, I have just finished my participant observation with the second group of households. Whenever I transition to the next groups of households, I also try to maintain contact with, and occasionally visit, the previous families. I feel more confident and skillful in how I engage with the families and convey the intentions behind my observations and inquiries/chats. However, I also make sure that I obtain consent from research participants every occasion I interact with them.
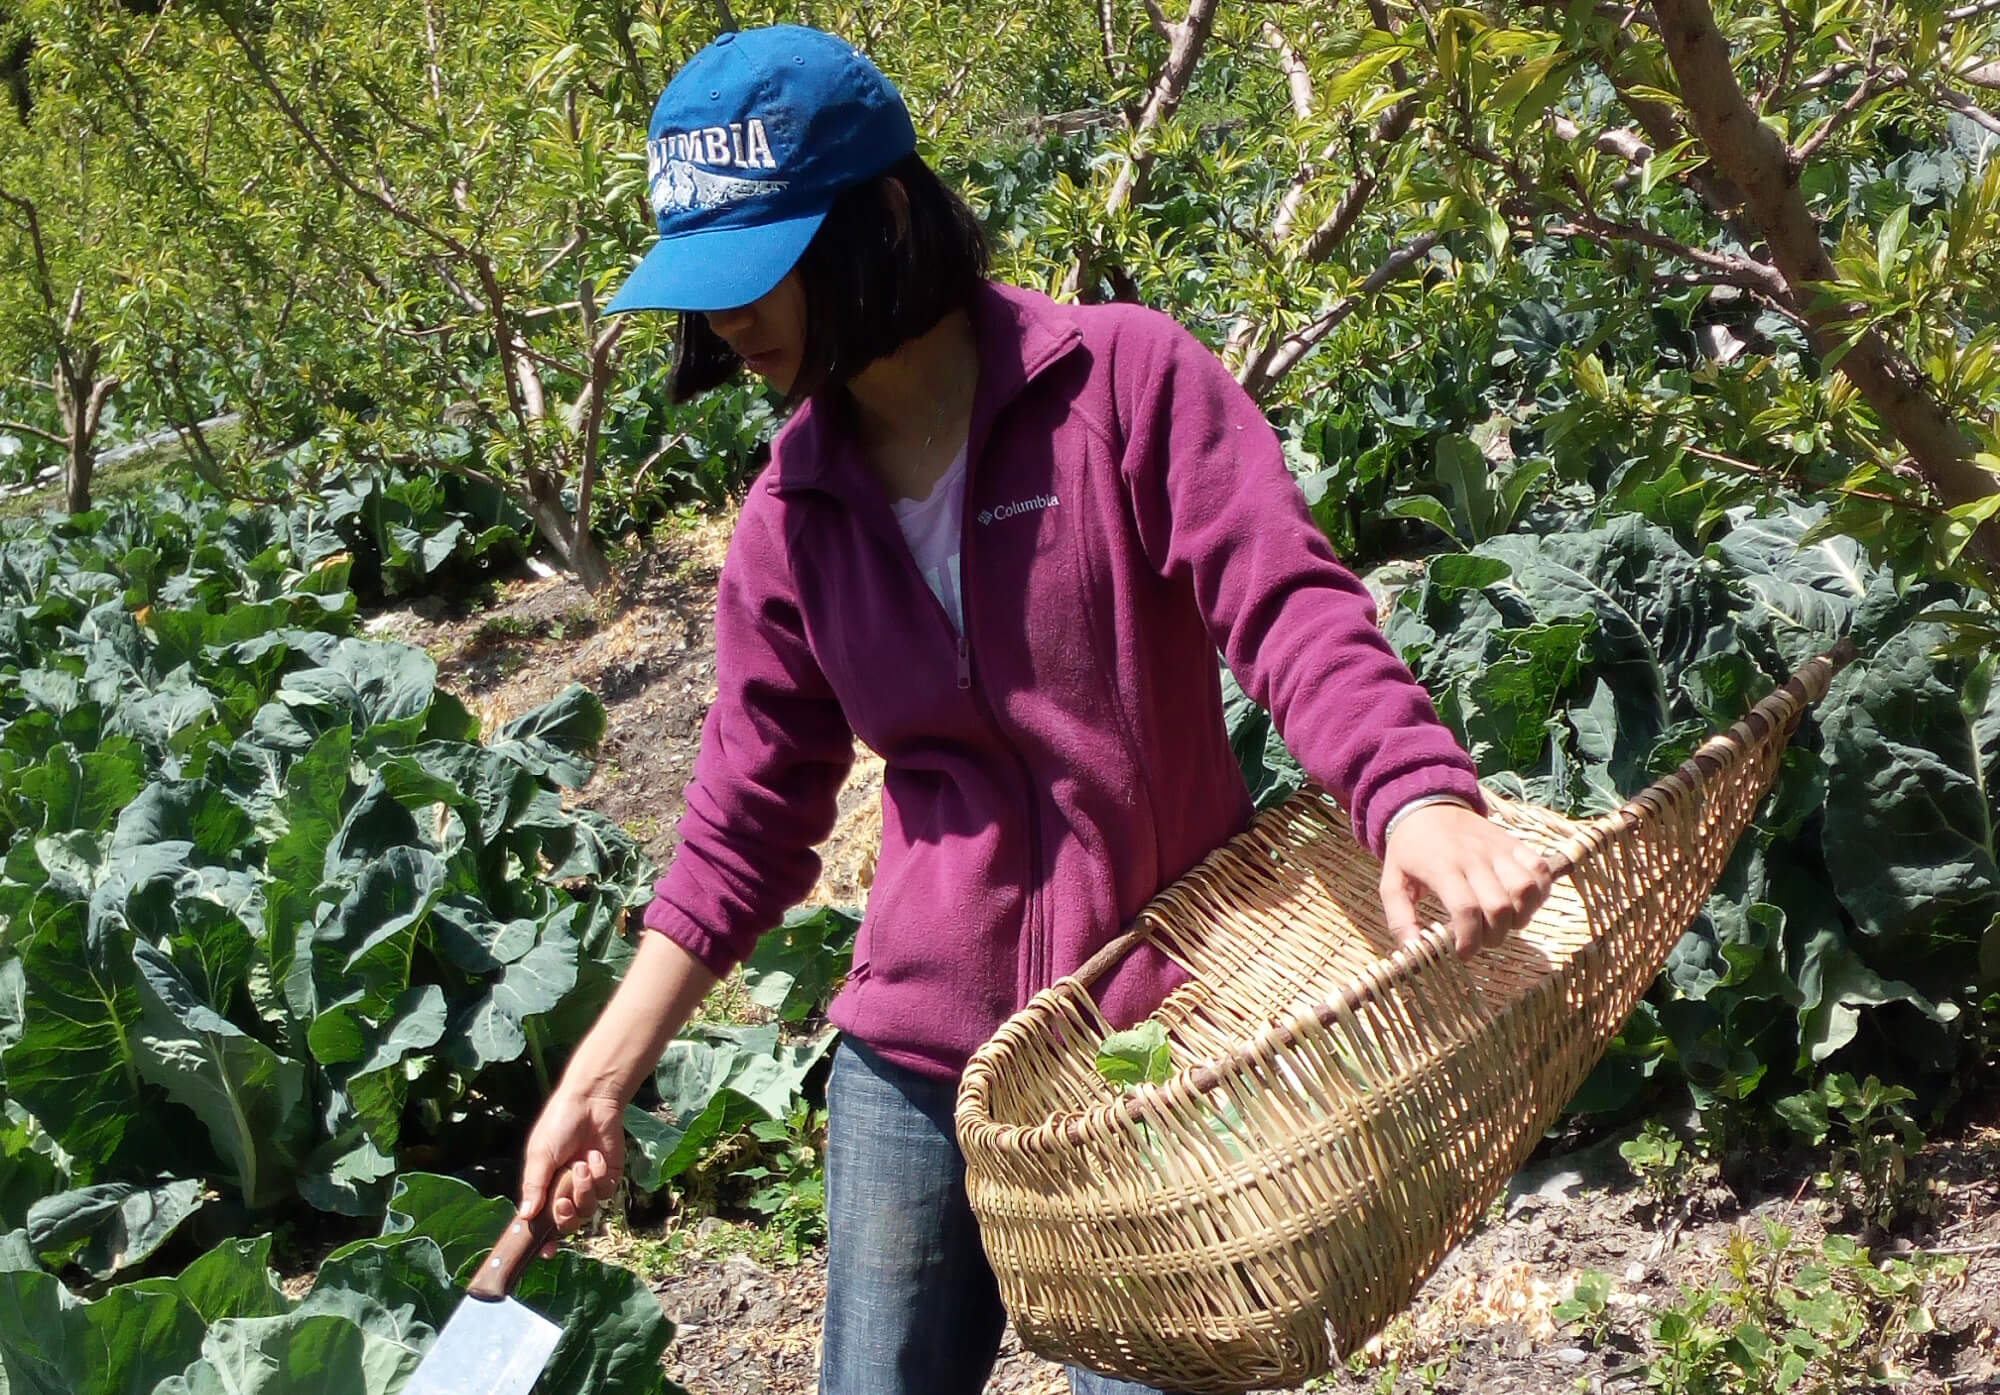
Ruijie in the field
Meanwhile, I have also observed that the community has started to have a better idea of why I have been hanging around in the village. They have even started to be more proactive in our interactions, sharing their life stories about various historical periods, as well as asking me to share my life experience with them too. This allowed me to observe various occasions and facets of villagers’ lives, not just about their labor process.
One important change that has occurred during this phase of my research is that I have stopped hastily interviewing research partners about their life histories and experiences with rural-urban migration. Instead, I followed a more fluid way of gathering information, sometimes at the dinner table with families that offered to host me, sometimes when I offered help to them, and sometimes while I waited for the shuttle with research partners.
In the beginning, I was afraid that without taking down extensive details (by constantly writing notes or turning the recorder while I interacted with research partners), I would miss important information. But after trying to have these conversations more casually and spontaneously, I realized that I could remember more details than I had originally thought because I was paying closer attention to our conversations when not relying on the recorder or notepad. Now, I try to write everything down as soon as possible after our interactions. I have also noticed that whenever I did arrange recorded interview sessions, those conversations were deeper and more substantial than before.
Fieldwork Analysis Phase 2: Broad Coding and Initial Visualizations
While experimenting with various ways of collecting data, I have also begun my initial attempts to analyze the data collected in the field with MAXQDA 2018. At this stage, there are two main concerns driving my data analyses:
- First, I want to make sure that I collect all necessary information during the limited time I have in the field. To identify gaps in the information I collected, I have been using MAXQDA’s transcription, coding, and visualization tools.
- Second, I want to better understand the unexpected information my fieldwork has garnered. To deal with information that I did not expect to encounter before going to the field, I have been inductively developing codes and memos with MAXQDA to keep track of new ideas. This way, I can come back to them later in order to better answer my original research questions or to explore new avenues for further research.
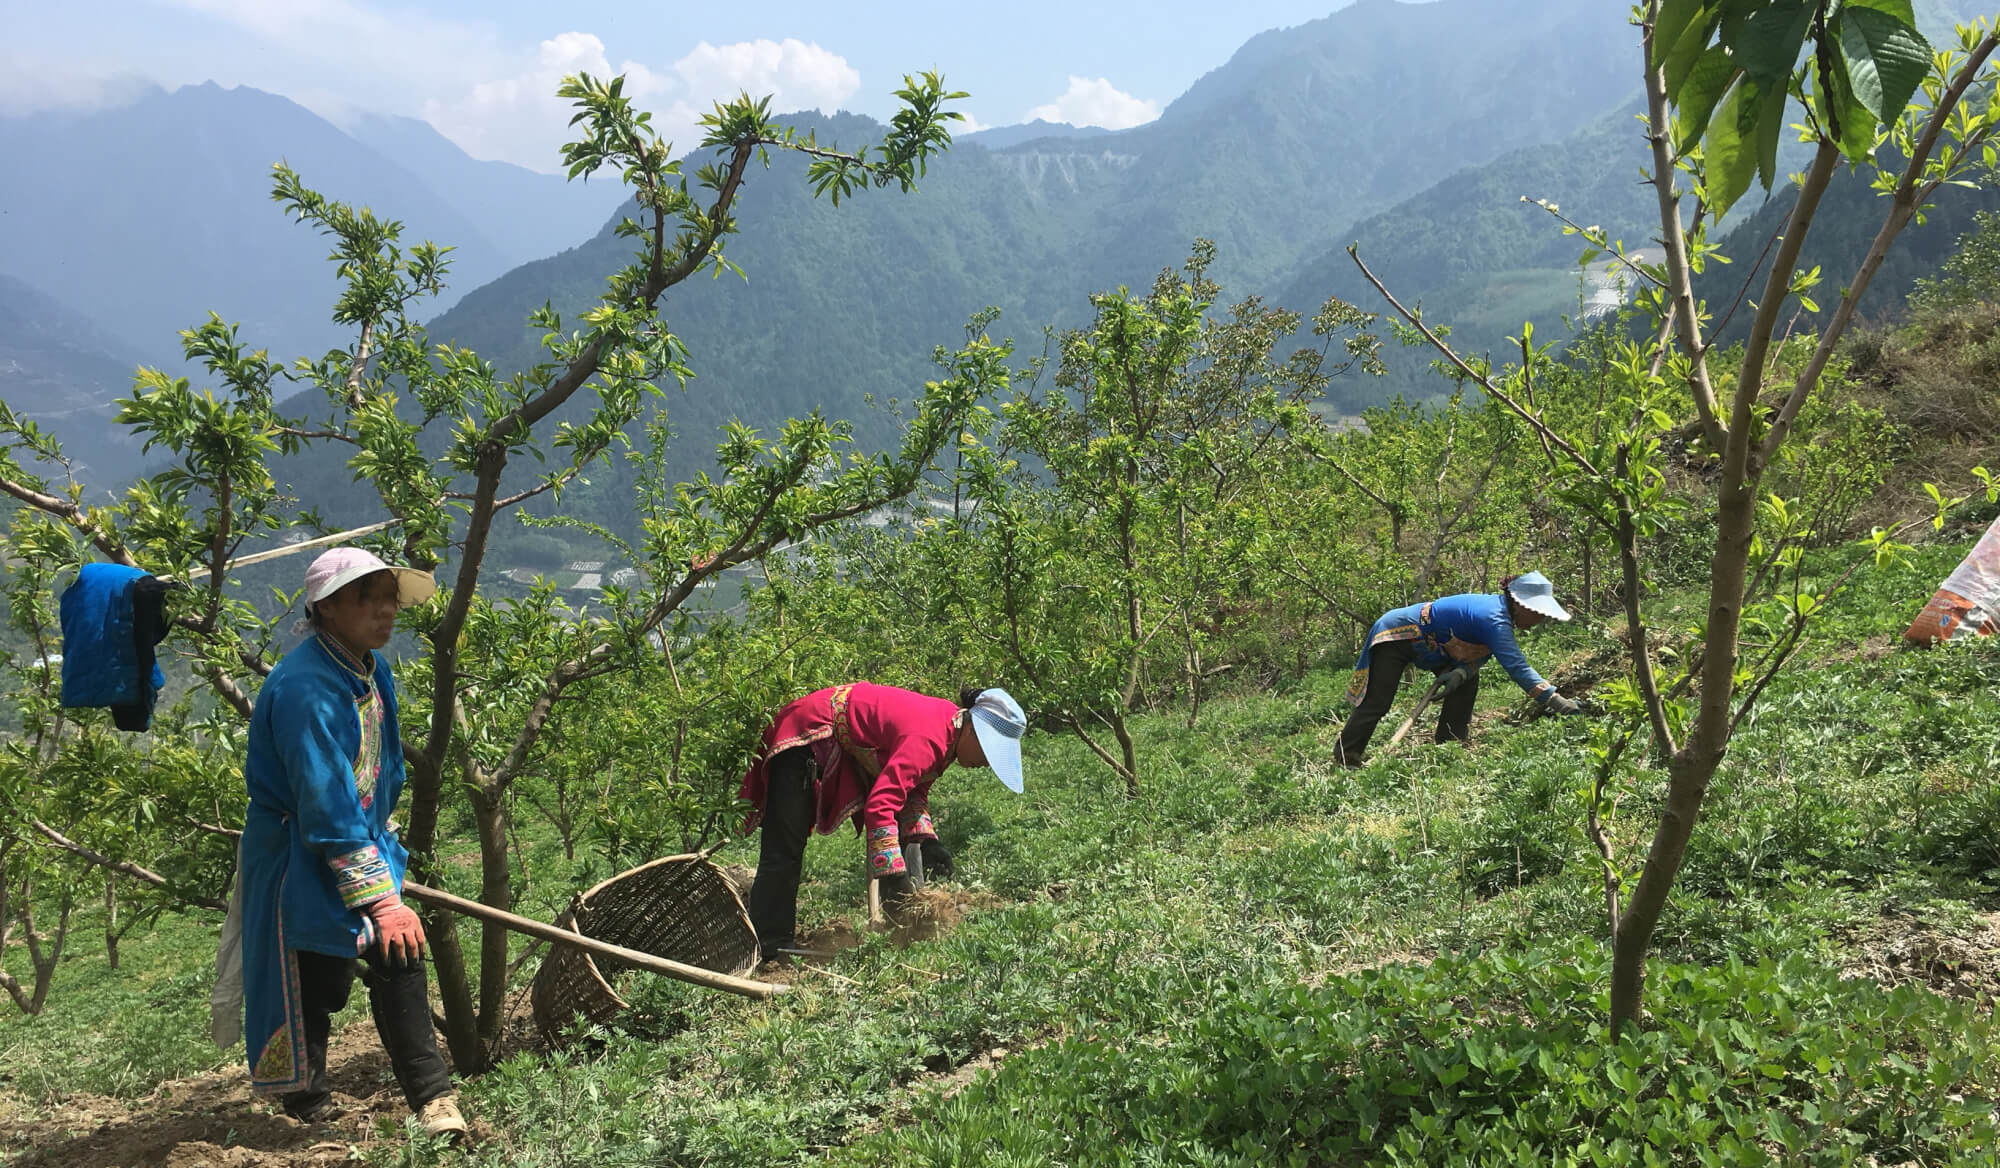
Conducting a Focus Group Interview while Working in the Fields
Creating Document Variables:
As I mentioned in my last fieldwork diary, I have been organizing documents according to each respective household and creating various documents under each group (including field notes and interview transcripts) in MAXQDA. I also created variables based on participants’ descriptors, such as their gender, age, ethnicity, marital status, etc., and I have associated these variables with documents about research partners I used when I recruited them for this study.
Before starting to code inductively, I discussed my analysis strategies with my Professional MAXQDA Trainer who advised me to separate field notes from interview transcripts and to code them separately in MAXQDA because they are different kinds of data. I have now moved field notes into a separate documented group, and I created a household number variable (e.g. Family #1) for all groups of documents. This way, I can recall and compare field notes and interviews about the same household in the future by activating the household number variable.
I want to thank Graham Hughes, my Professional MAXQDA Trainer who has kindly discussed strategies for using MAXQDA with me for this phase of initial analysis and patiently walked me through tools and approaches in how to use the software.
Inductively Coding:
Before coding, I transcribed most of my interviews in Word documents, but I also used MAXQDA’s handy transcription tool to help me transcribe some recorded interviews. The process was smooth and helped me deal with very unclear passages – timestamps allowed me to return and relisten to certain segments. As I read through my transcripts in the Document Browser, I identified themes and topics inductively, and I created a code to represent these ideas. At this stage, I tried to assign very broad codes to include multiple paragraphs. For example, I identified that my research partners often refer to three periods of time when they talked about their own and family members’ experience with labor and migration—the collective commune era, time periods after collectivization, the 2008 Earthquake, and the post-disaster period. I used four broad time codes—“Era: collective commune,” “Era: 80s to 90s,” and “Era: 2000s before 2008,” and “Era: post2008”—to represent these time periods. These broad codes helped me categorize large segments of experiences into different historical moments. I expect to compare and contrast different people’s experiences at different times at a later point in my analysis journey.
Overall, I have also often activated and read data segments in MAXQDA’s Retrieved Segments window. This helped me to correct code assignments when necessary or to come up with new codes to better capture the meanings behind them. I have also been fighting off the temptation to create codes that are too detailed because they might narrow my vision for other information in the field. But even the broad codes that I was creating kept growing. Initially, I became a bit worried about whether I should sort out the hierarchical orders among the codes. But as I had more ideas about other codes, I found it easier to organize them in MAXQDA using subcodes. For example, I created the parent code “migration” that includes two subcodes “self-migration” and “family members’ migration.”
Identifying Patterns:
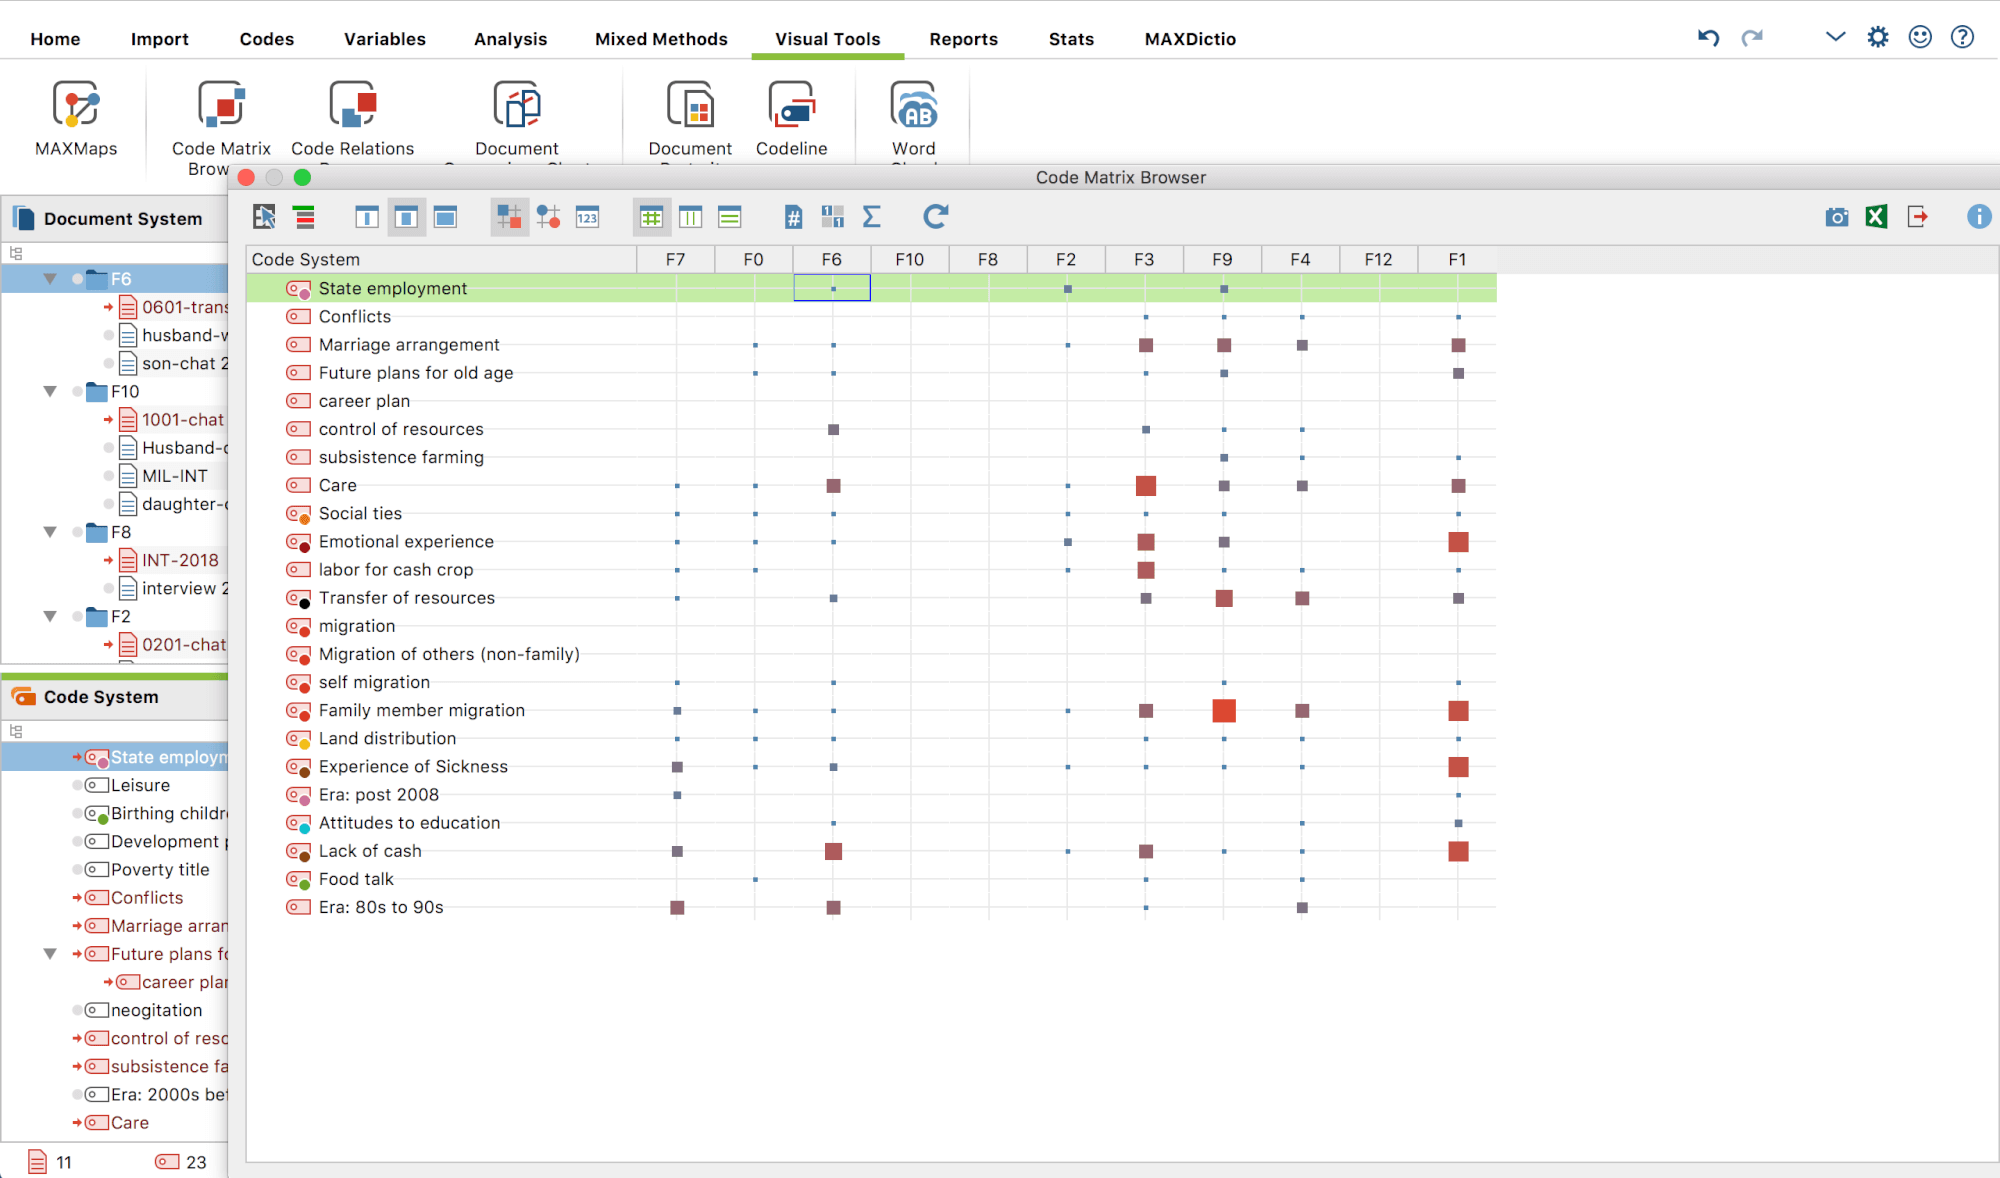
Visualizing the Data with MAXQDA’s Code Matrix Browser
To identify some initial patterns in my coding, I used some of MAXQDA’s visualization tools. For example, when I wanted to have a broad idea about women’s (in their 40s and 50s) experiences with migration, I used the Document Variables function to activate all interview transcripts with these women. Then I activated a group of codes (e.g. the codes with most coded segments). By using the Code Matrix Browser, I could see the co-occurrences between different codes in the activated documents.
I have also enjoyed reading the retrieved coded segments, which can be done simply by clicking on the squares. In the process, I often considered whether I could use a different code to capture these intersections, for example, about women who engaged with a lot of resources transfers with migrant workers.
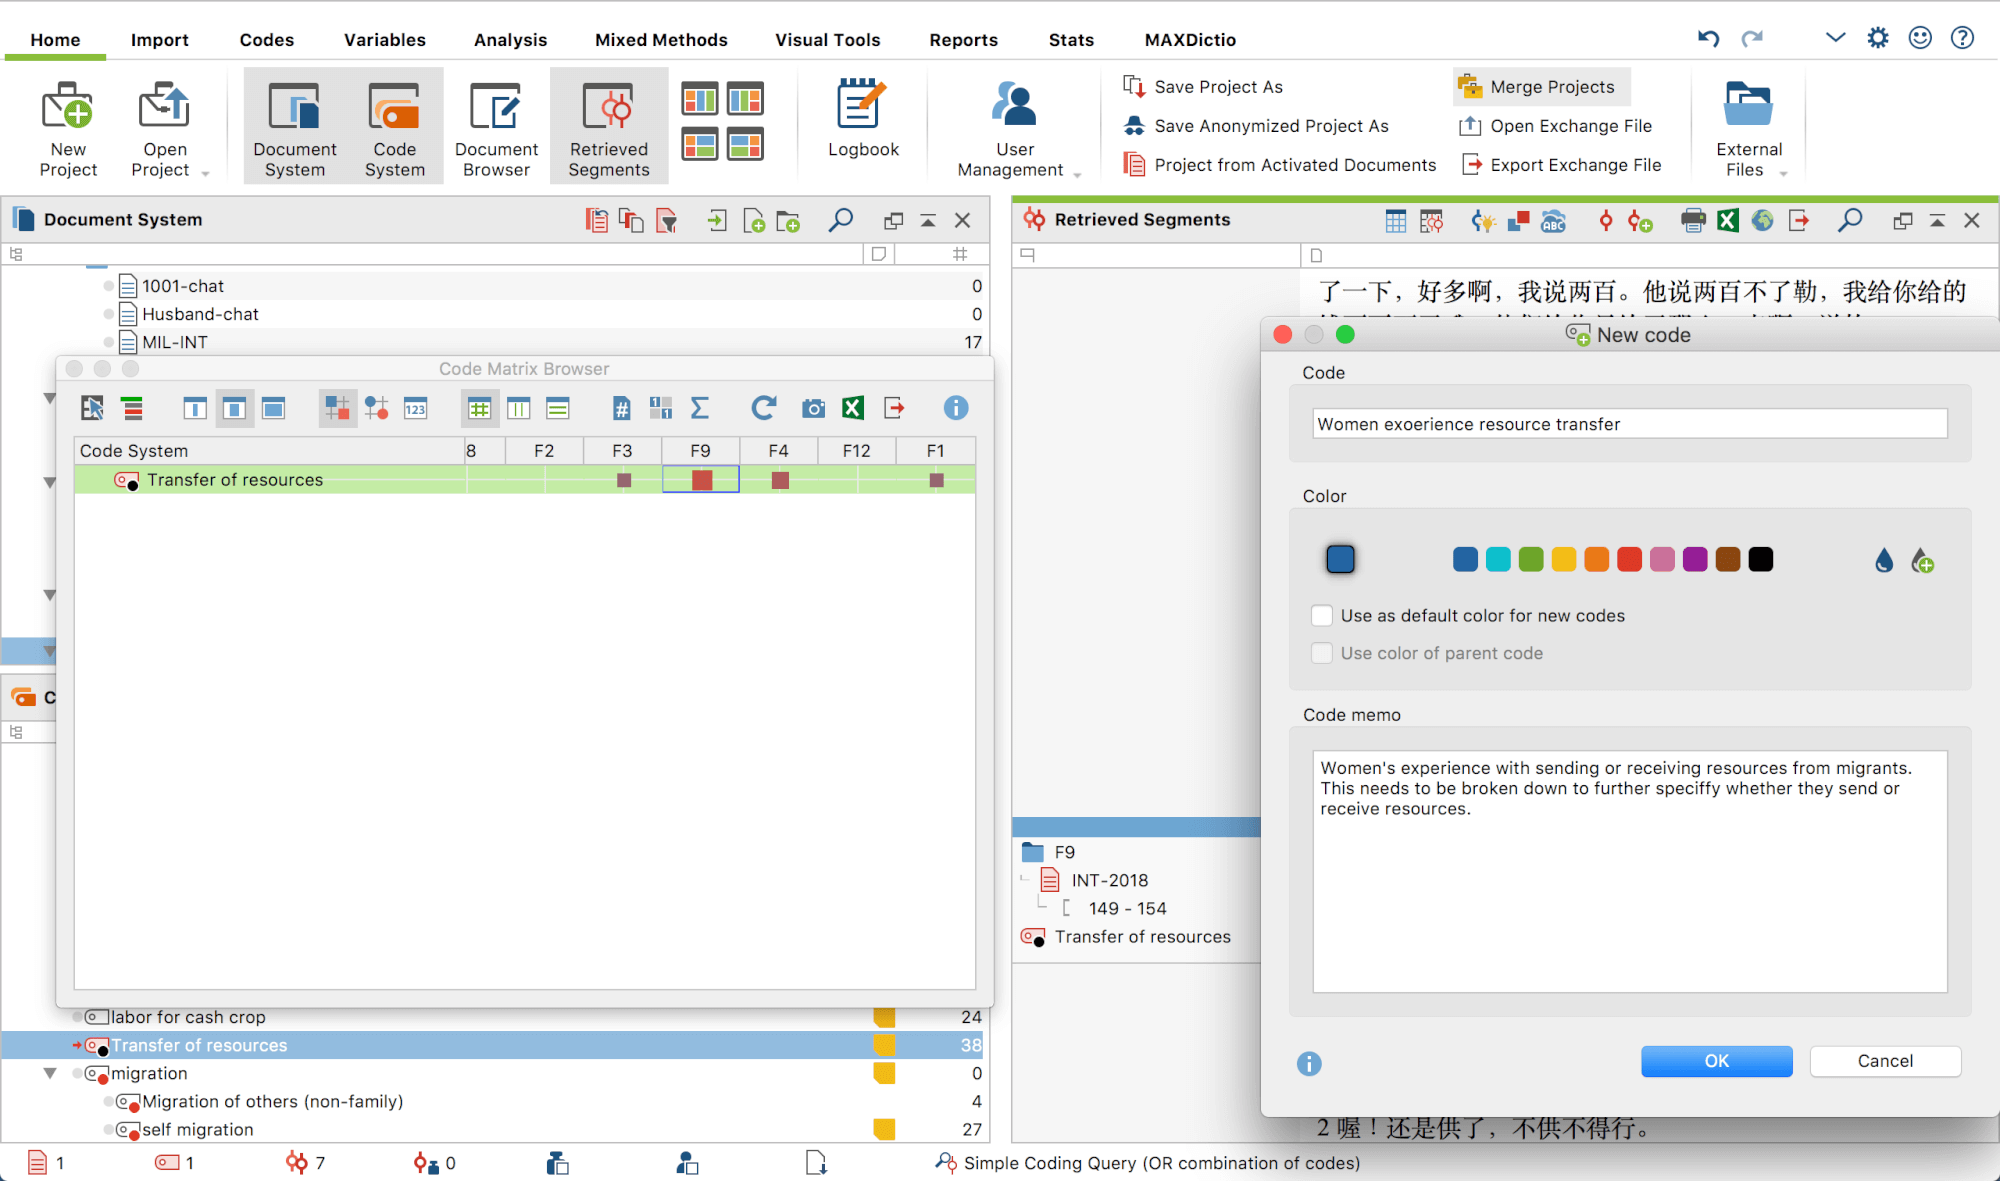
Visually Retrieving Coded Segments
Next, I tried to see if I could get quantitative summaries of coded segments and documents by using MAXQDA’s Mixed Methods function Crosstab. The screenshot below shows that I was trying to see how frequently these codes would appear among married women whose husbands had migration experience. To do so, I activated all the documents about interviews with women, then I set up a crosstab with “marital status=married” and “Husband migration=1.” I could then see that the cells in darker green indicated a large number of coded segments under “lack of cash,” “emotional experience,” and “family member migration.” This visualization was an easy-to-use but powerful tool that reminded me to think about the relationships between these themes.
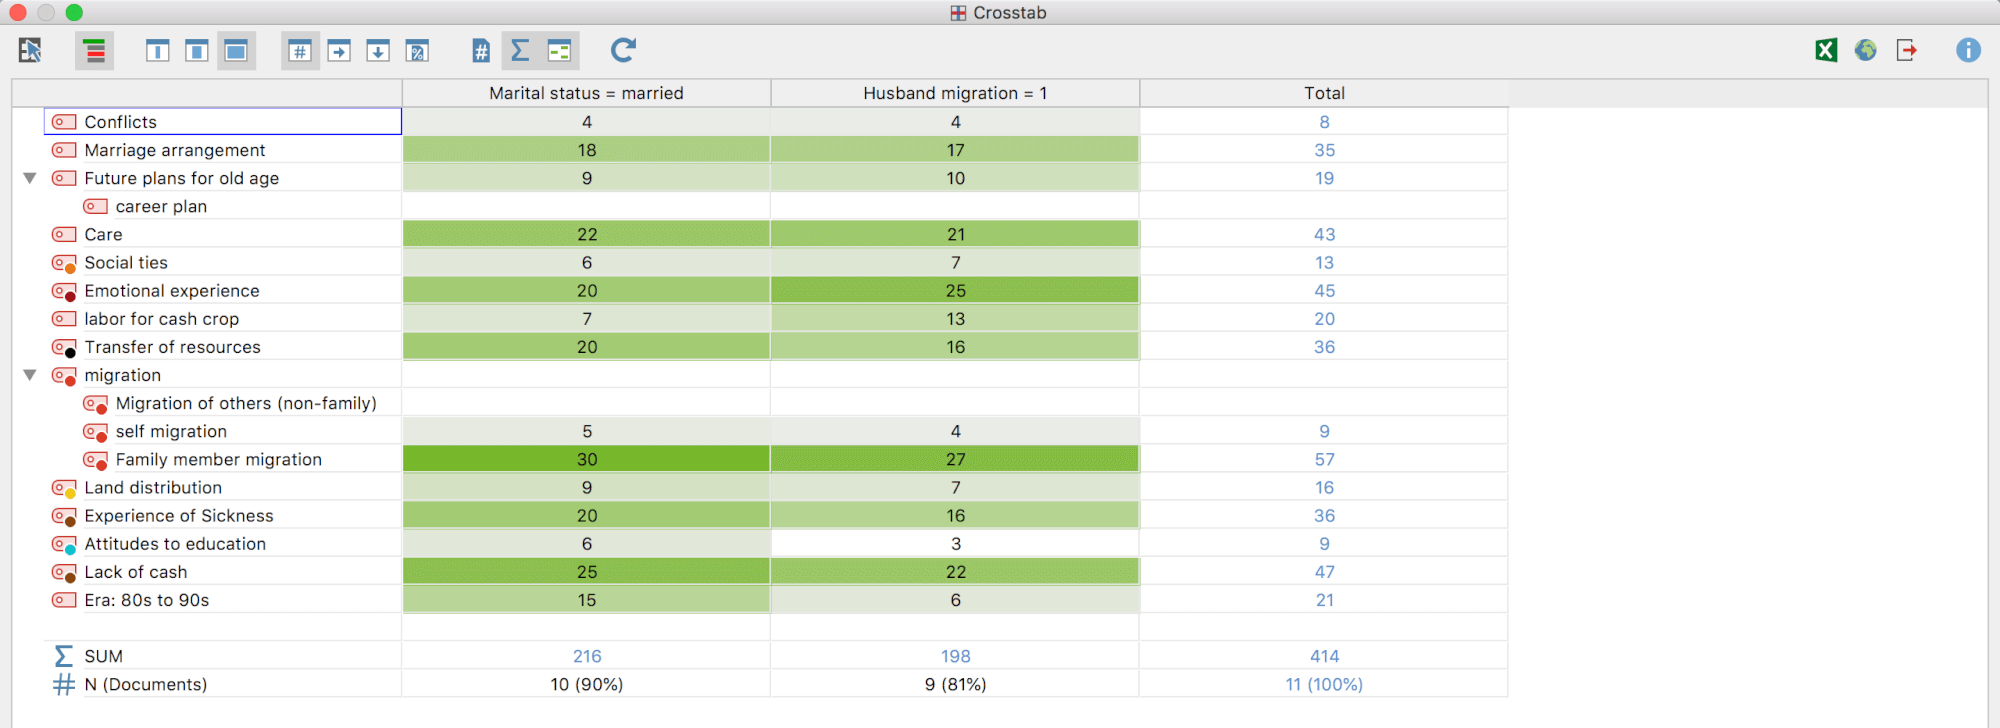
Quantitative Summaries of Data with MAXQDA’s Crosstab Function
Going forward: Identifying the Gaps in the Field Data
Perhaps it is still too early in my analysis phase to use the Code Configurations tool to see the deeper connections between the intersections in my codes, but I tried it anyway to see how strong the relationships between these codes are – for instance, the codes “lack of cash”, “emotional experience”, and “family member migration”. Currently, I still do not have enough data to determine the strength of these relationships, but this tool worked as a good reminder for me to pay attention to different iterations of these themes in my observations and interactions with research partners.
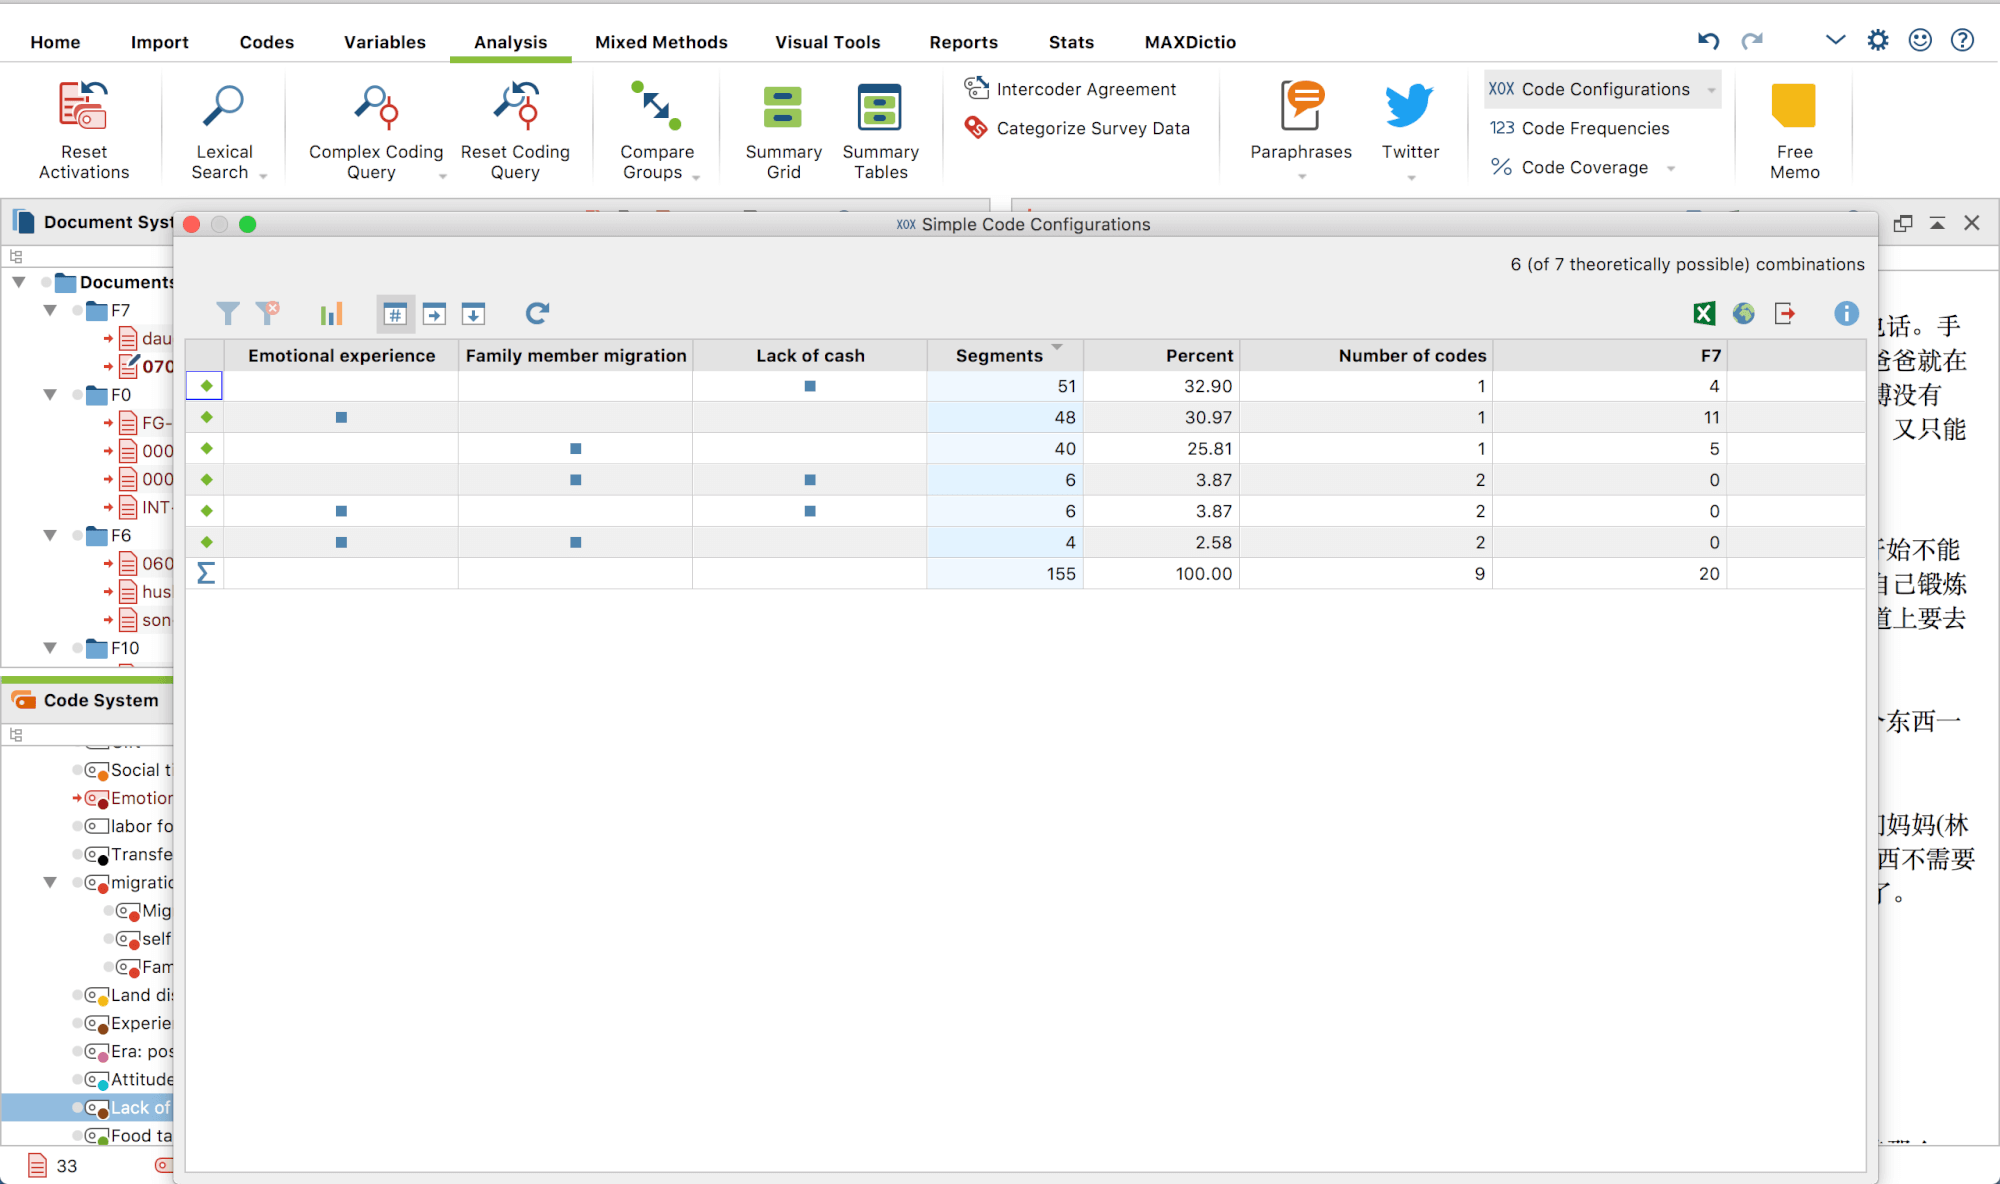
Finding Connections Between Intersections in Codes with MAXQDA’s Code Configurations
It has been fun working with MAXQDA to identify gaps in my data collection process. Through reading and analyzing the retrieved segments at the intersections and overlaps of codes, I have become more assured that I have been collecting interesting and relevant data about people, especially through my participant observations with women who have stayed in the village. While I will continue to collect this type of data in my work with the rest of the households, it will be equally important to see how migrant workers evaluate and comment on themes, such as the transfer of resources, migration experience, and emotional ties with their family members. For example, by talking to migrant family members, especially the younger cohort, I can get factual information, as well as people’s experience with remitting resources to rural families or receiving support from their rural homes.
Editor’s Note
Ruijie Peng is a recipient of MAXQDA’s 2017 #ResearchforChange Grant. She is a PhD candidate in Sociology at the University of Texas at Austin, USA. Her research project titled, “Home Support in Rural-Urban Migration” includes a 12-month ethnographic fieldwork period, which began in February 2018 in China. This is the second of three fieldwork diary entries by Ruijie Peng. Read the first here!

