Creative Data Analysis
We are excited to announce a breakthrough development: the launch of MAXQDA 24.
Our latest release solidifies our mission to provide world-class software to researchers worldwide. MAXQDA 24 will make your work more effective, efficient, and enjoyable with over 35 new features and a fresh new look. These include innovative and automatic analysis tools that will take your research to new heights.

AI Assist left beta
AI Assist is now seamlessly integrated into MAXQDA.
AI Assist can simplify your work by automatically analyzing and summarizing elements of your research project. Discover how AI Assist can assist you by summarizing the content of codes, creating comments for your coded data, summarizing or paraphrazing content, and create idas for new codes or subcodes. We offer 60 minutes of free transcription for every new AI Assist user account.
Free: Enjoy the power of AI Assist with a limited amount of daily credits. This tier will enable you to summarize or analyze about 10 pages of text data.
Premium: Elevate your experience with an increased number of prompts.
MAXQDA Transcription
Say goodbye to manual transcription. Say hello to efficiency, accuracy, and convenience.
It is finally here. If you are working with audio or video data, you can now use MAXQDA Transcription to automatically transcribe your media to text. MAXQDA Transcription is integrated into “AI Assist” and available right from your MAXQDA Account.
Effortless transcription: MAXQDA Transcription makes turning spoken words into text a breeze. Simply upload your media file and let this cutting edge tool do the heavy lifting, saving you time and effort. It works with all common media formats.
Multilingual support: MAXQDA Transcription is fluent in over 45 languages, including accents and dialects.
Seamlessly integrated: MAXQDA Transcription offers seamless transitions between transcription and recording. Finished transcripts are perfectly formatted with MAXQDA timestamps.
Speaker detection. Each speaker’s contribution is tagged with their name. This feature allows you to separate the voices and opinions of each person and analyze them as a group or individually.
GDPR Compliance. Your files uploaded to MAXQDA Transcription are stored exclusively on GDPR compliant servers. Your data will only be used for speech recognition and will not be used for any other purpose or shared with others.
Data Deletion. Your media files are deleted immediately after the transcription is complete, and transcripts are automatically deleted after you download them.
Get started with 60 free minutes: Discover MAXQDA Transcription with 60 free minutes for MAXQDA AI Assist Users. Additional minutes are available from the MAXQDA Online Shop.
Visualizing “Trends”
Discover trends across documents or time.
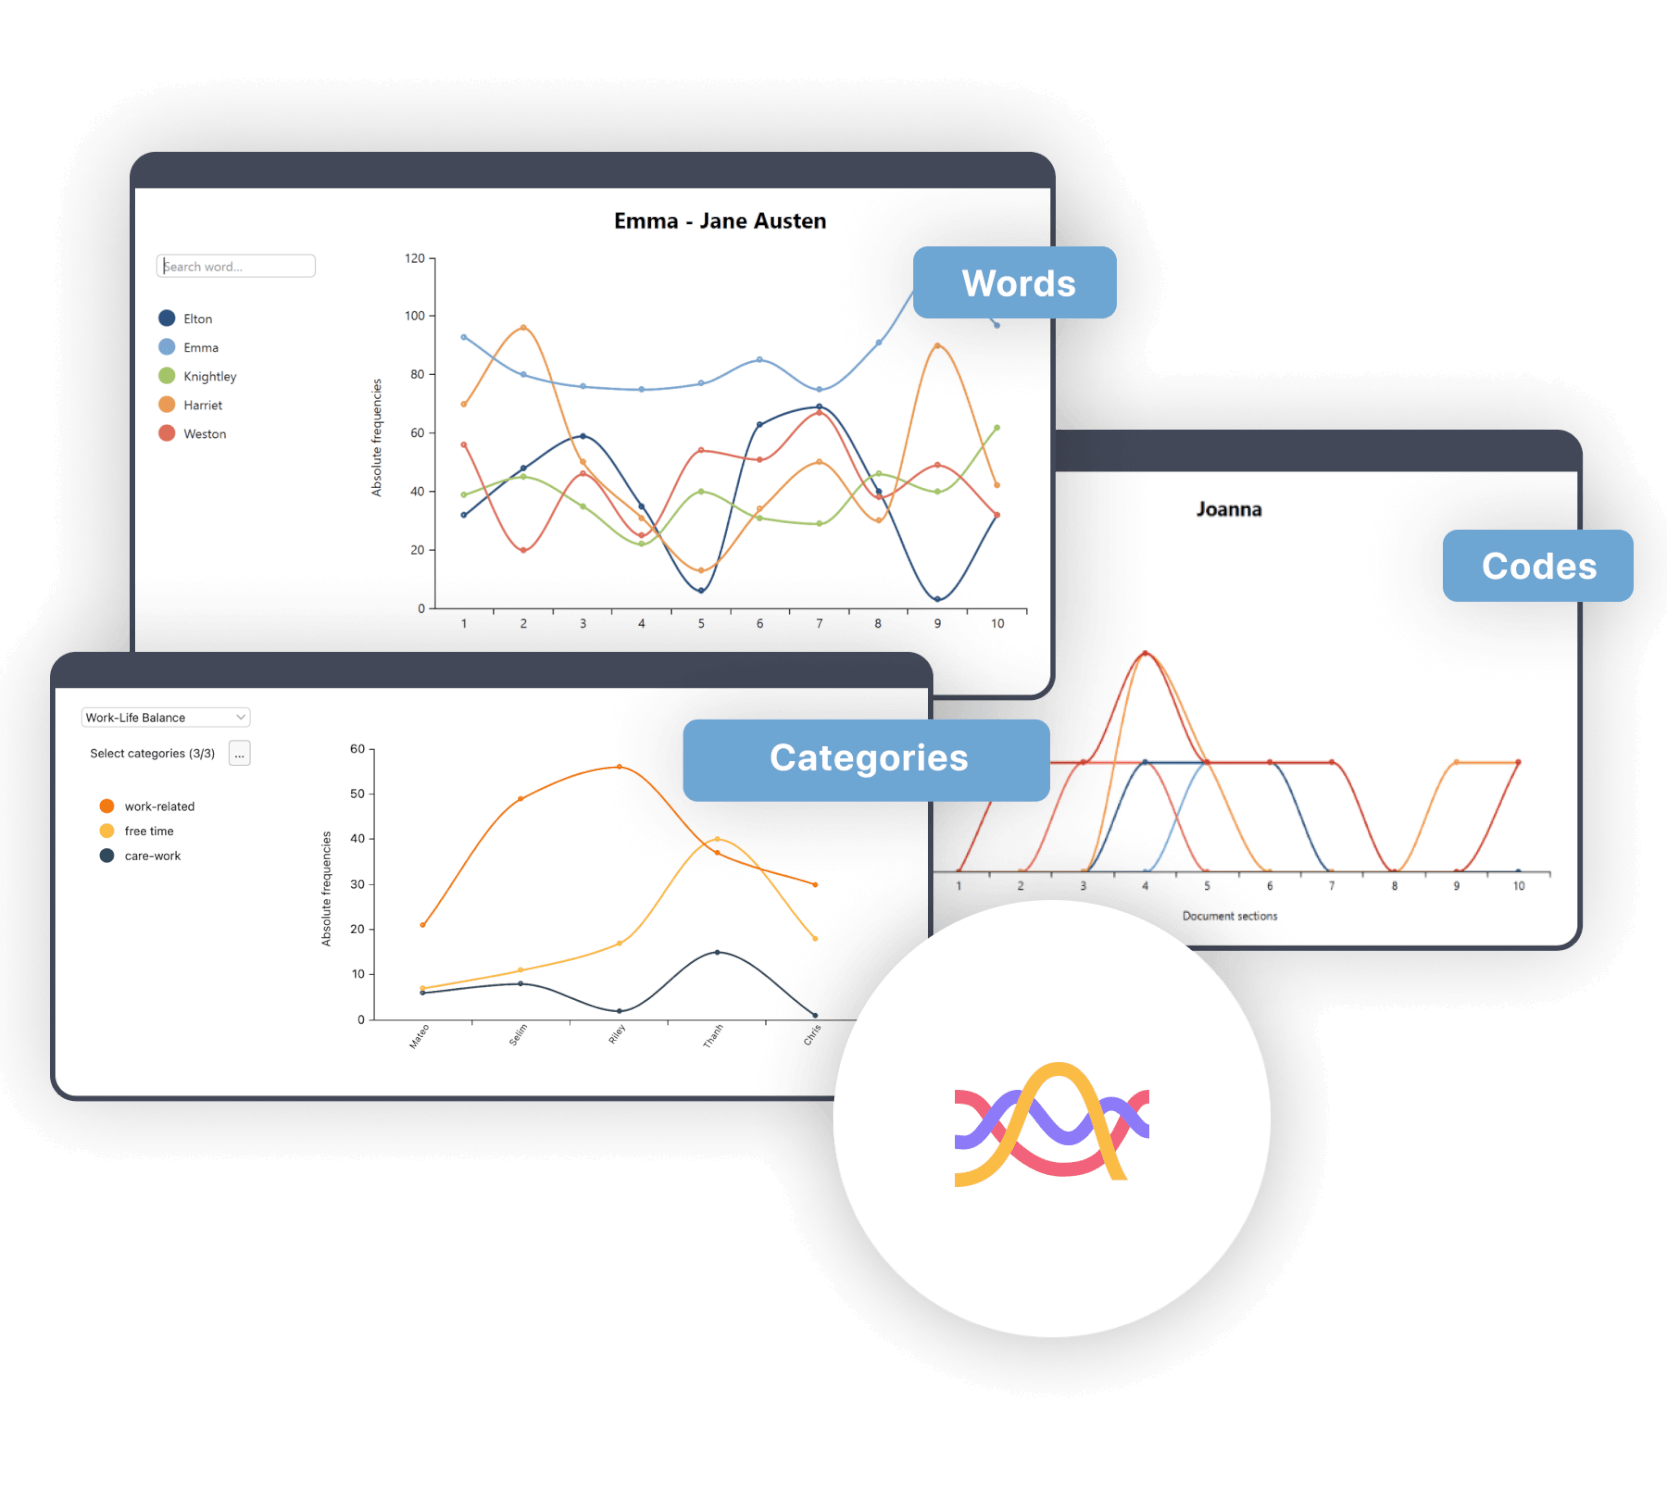
The new Trends feature pack consists of multiple visual insights into the occurrence of codes, words, or categories. Each trend visualization is deeply interactive. You can change which elements to display on the graphs, click into the graph to view the data behind the diagram, or filter the data in multiple ways.
Code Trends: Analyze code frequency changes in single or multiple documents over time. Visualize topic relevance intuitively and interactively for easy understanding and communication.
Word Trends: Track word frequencies across multiple documents, ideal for historical trend analysis in projects such as policy or research papers. Visualize evolving topics and themes over time, expanding capabilities beyond single document analysis in MAXQDA 2022.
Category Trends: When one word is not enough – set up categories for groups of words in MAXDictio – and analyze how often a word from a category appears within a document or across multiple documents.
A new User Interface
Fresh, modern and minimal.
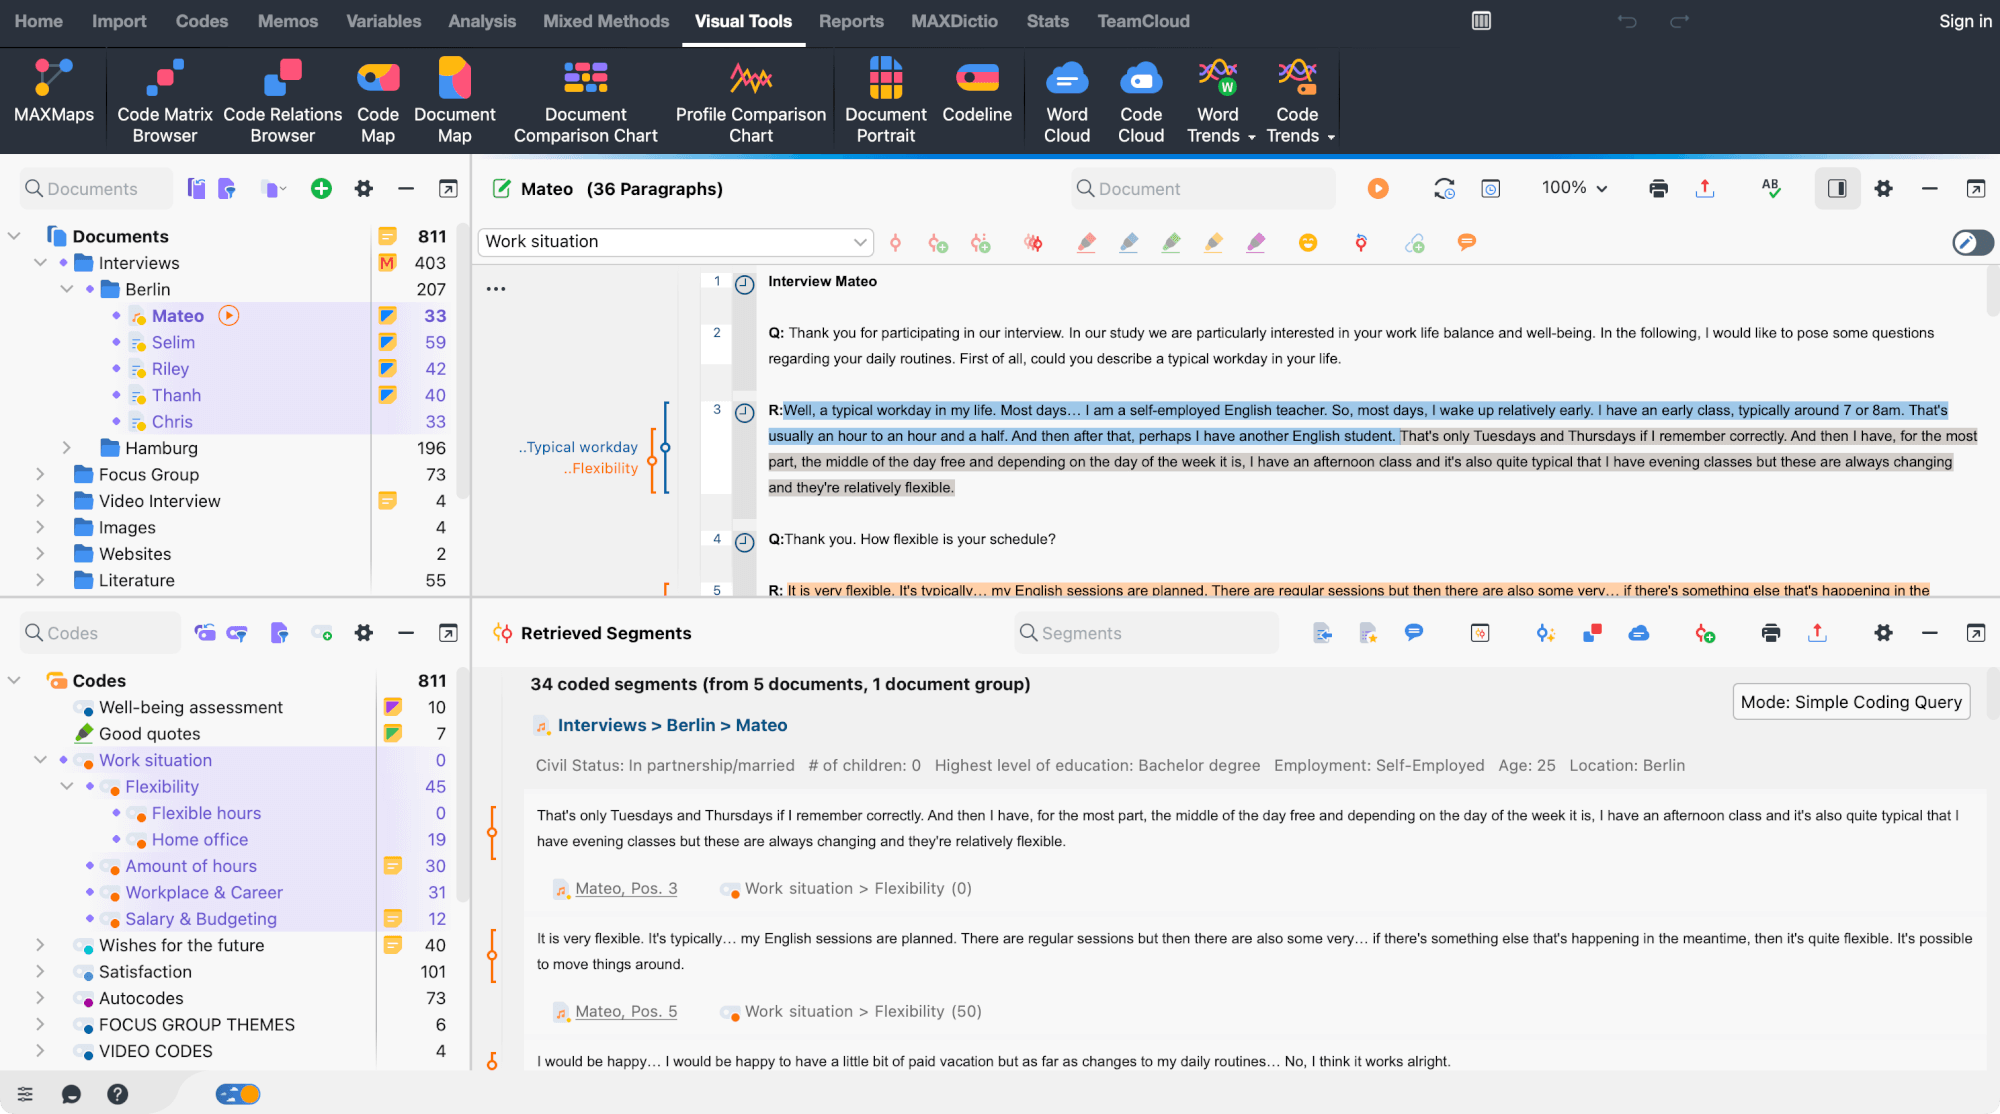
Last but not least. We are excited to introduce the improved MAXQDA User Interface. With vibrant colors and intuitive contrasts, navigating and using MAXQDA has never been smoother or more visually appealing.
Spotlights your data: The new dark toolbar automatically focuses your attention on what matters most – your data and your code. It separates the menu from your workspace, providing a calming interface.
Easier window management: MAXQDA’s core 4-window layout has always provided an unsurpassed project overview. Customizing the windows is now easier than ever: any closed window can be re-opened directly from the status bar with a simple click.
Quick access to activation options: Action icons that let you filter or reset activated codes or documents are now placed directly in the code and document windows and only appear after you have activated items.
Quick access to query settings. MAXQDA offers several types of queries for coded segments. A simple query searches for any segment that matches the current code & document activation. Advanced options offer more complex searches, such as “Find segments where code A is within code B”. Your current query type is now displayed directly in the Retrieved Segments window and can be reset from there.

Longer names and characters now possible
More characters for codes, comments, paraphases or documents.
Code names: You can choose code names with up to 127 characters (used to be 63).
Paraphrases: You can now craft longer and more expressive paraphrases, with an extended limit of 512 characters (used to be 256 characters).
Comments: The character limit for comments on your coded segments has been doubled to allow up to 512 characters (used to be 256 characters).
Document names: You can choose document names with up to 127 characters (used to be 63).
Further Improvements
General
- Document System: The document management is now streamlined with a unified icon that combines the options for adding new documents or document folders in one easy-to-access location.
- Code System: It has been redesigned with an user-friendly toolbar that prominently displays the most important function – creating new codes. Additional options for working with activated codes now only appear when codes are activated, reducing clutter.
- Internal Links: When copying a text segment with source information within MAXQDA, the source information is transformed into a dynamic link that seamlessly connects to the original source. This improves traceability and reference management, making it easier to cross-reference and maintain the integrity of your sources.
- Search: This functionality has been enhanced to allow you to search for codes, documents, and text directly from the toolbar for a more seamless search experience.
- Overview tables: Have received a complete design overhaul, featuring a more spacious and modern design. Additionally, we have relocated the toolbars right above the tables for swift access to essential features.
Documents
- Document Groups: Now with the ability to effortlessly duplicate entire document groups with all their content, saving valuable time and effort when preparing your projects for teamwork or intercoder agreement testing.
- Document Colors: Now without the default blue color of documents, giving you the flexibility to assign your choice of colors to documents for more personalized and meaningful categorization.
Visual Tools
- Code Cloud: Introducing an advanced option that allows you to include subcodes in the Code Cloud visualization, providing a more comprehensive and insightful view of your code occurrences.
- Code Relations Browser: The visualization for activated codes by activated codes now excludes information about non-activated parent codes, providing a more focused and concise representation of your code relationships.
- MAXMaps: Images within MAXMaps are now saved as embedded components within the map itself, rather than external links. Users also have the flexibility to set their own image size limits for embedded images, allowing for more control and customization.


