Are your bachelors or master’s thesis coming up or are you looking for a way to organize your research project efficiently and you don’t know how to write your thesis with MAXQDA? No matter if it is a bachelors, masters or doctoral thesis or if you’re writing a scientific paper – the general steps to tackle a scientific project with MAXQDA are pretty similar:
- First Step to Write Your Thesis: Collect and import your Data
- How to Explore Your Thesis Data
- Including the Research Question in Your Project
- How to Analyse Your Thesis material
- Gathering Insights for Your Thesis
- Concluding how to Write a Thesis with MAXQDA
For my bachelor’s thesis in European Ethnology/Cultural Anthropology I used MAXQDA to work through my material, build analytical categories, develop research questions and transferred my insights into my writing. However – that’s just what I did! Research methods and individual styles differ wildly and there is no fixed way to write your thesis using MAXQDA. Therefore, I will walk you through the six steps of writing a thesis with MAXQDA roughly along the lines of my own research, but I will also make smaller excursions here and there to show you what’s possible with MAXQDA and suggest options that might be interesting for your project. If you are wondering how to write your thesis with MAXQDA these six steps will definitely help you find your own way.
1. First Step to Write Your Thesis: Collect and import your Data
Right after you have narrowed in on the topic you are interested in, you will start collecting your first material. In the specific case of my ethnographic research on media, and especially social media practices around the Boxhagener Platz, a famous little park in Berlins hip district of Friedrichshain, where Berliners and tourists alike like to spend time sitting on the lush meadow and relax. I was particularly interested in how people connected to the place through the use of social media, and how the place was portrait through that use – which narratives people reproduced or maybe even created and how people commented this use of media in relation to the place. In other words: I was interested in how people “make” the place through the use of media and how bigger patterns of media and touristic practices relate with that.

Walkway on the edge of Boxhagener Platz – the field of my research.
Different Data types
As Instagram was the most common social media platform at that time, which also has a very strong visual focus, it was apparent pretty soon that I would turn my attention to Instagram posts that made use of geotags directly referring to the Boxhagener Platz, as this was a good way to find posts that related directly to the place. But I also wanted to observe how these media practices played out offline, so I decided to broaden my approach and also do some classic participant observation on site, take my own pictures in order to understand the spatial layout and conduct online interviews. So I wound up with a pretty wide array of different data types:
• Instagram posts (PDF files)
• Field notes gathered in participant observation (text files)
• Photos (image files)
• Interviews (text files)
This doesn’t need to be set in stone the first day you go out into your field – In fact it is pretty common that you come across a new research method and new data types as your project progresses. A research method that might serve your research well, and that you would like to include into your project as well. And if that happens just do it! Whatever types of data you might have, MAXQDA will surely handle them: be it images, videos, audio files, filed notes, surveys or even tweets and YouTube comments that can be gathered through the dedicated import ways in MAXQDA. I went through the Instagram posts that interested me most, took screenshots of them, pasted these screenshots into word documents and then also copied and pasted the description and comments into this document. This way I was able to analyse my content using the different analysis functions MAXQDA offers for text. After putting a document together like that I went ahead and exported the resulting document as a PDF file which I exported to MAXQDA in the next step.
Import documents and create document groups
While collecting your first data you can start out to import it into MAXQDA along the way. This is easy using the dedicated import ways for different types of data. These import ways can be accessed via the “Import” ribbon in the main ribbon menu: there are import ways for text documents such as .docx or .rtf documents, for PDF files, audio files, videos, images and plenty other data types. But you can also drag-and-drop your data into the “List of documents” and MAXQDA will import these documents automatically.

The designated import ways for different data types in the Import tab.
In the Document System you can create folders, called Document Groups by right clicking on Documents at the top or an already existing Document Group and move data that is already listed in the Document System into this new group via drag-and-drop. When I was writing my bachelors thesis with MAXQDA, I created Documents Groups for the different data types, such as field notes, chat interviews and the Instagram posts. I also created a Document Group called “Notes” and created a new, empty text document in which I could take notes along the way and have them close to my research material.
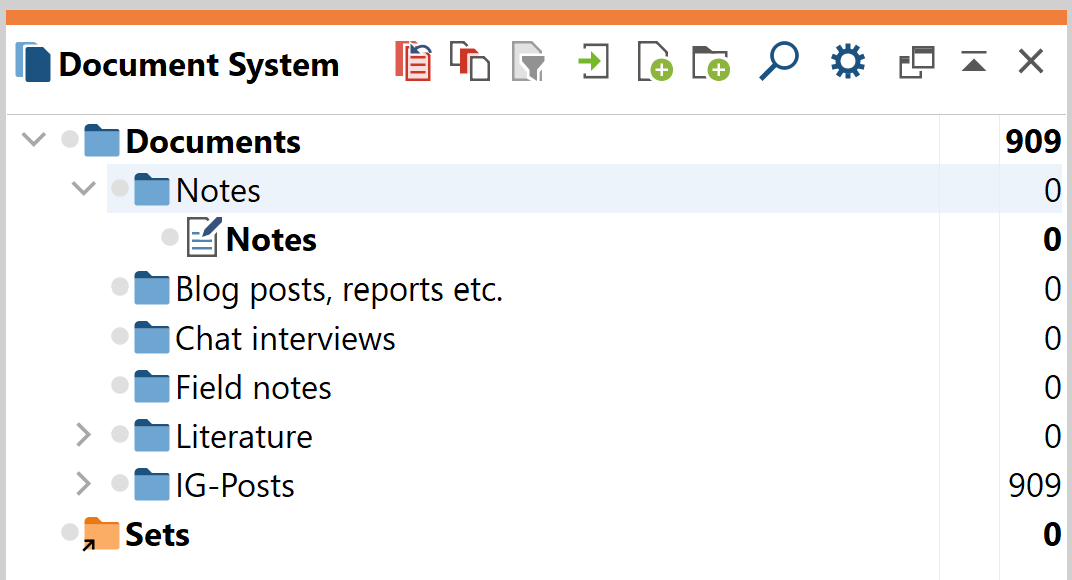
The different Document Groups in my MAXQDA project.
And another tip: If you have your data in a specific folder on your computer you can also drag-and-drop the folder directly into the Document System and all of the data will be imported. If files are stored in different folders, the names of these folders will be used to automatically create document groups!
2. How to Explore Your Thesis Data
After you have imported all of your data into MAXQDA, it is time to start exploring what you have gathered. And that is pretty simple: just click on the individual document name in the Document System and the Document Browser will display the selected document. Text documents, pictures, websites, Excel spreadsheets, tables and data from Twitter and YouTube will be displayed directly in the document browser while you can access media files such as videos and audio files via the Multimedia Browser, which can be activated via the icon at the top right of the document browser; from these media files you can also create transcripts which will be displayed directly in the document browser, just as text documents are.
Creating First Codes for Your Thesis
You can then go through your documents and search for reoccurring topics or themes, things that come up repeatedly and catch your interest. For these reoccurring themes or topics you can create analytical categories in MAXQDA – they are called “Codes” and will later allow you to filter through your material and find every example, every segment from your material that you assigned a specific category to. To create a code, simply highlight a segment of your document, right click on it and select Code/With new code from the context menu.
As pointed out before, when I wrote my bachelors thesis with MAXQDA I was very interested in media practices that I could observe on Instagram and in Instagram posts, so I went ahead and created very broad, descriptive codes first, with the aim to zero in on them in later stages of my project. So I created codes such as “Drinking beer” for posts that depicted persons drinking beer on the lawn in the park. This way I could come back to all these images of people drinking beer later on, since retrieving coded segments in MAXQDA is very simple: all you need to do is activate the documents you would like to search through by right clicking the little grey dot right next to the document name or the document symbol and then activating one or more codes by right clicking the code symbol or the dot next to the symbol. The Retrieved Segments window will then display all segments in the activated documents to which the activated codes were assigned.
Refining your Codes
I already mentioned that these categories can be further refined while you progress with your research. So if you activated some codes and documents, you can go through all the coded segments displayed in the Retrieved Segments window and by clicking the coding stripe on the left of the segment, the Document Browser will automatically jump to the original occurrence of the coded segment in your material. You can then have a look at it in context once more and maybe you will notice that you can specify your categorization a little further. Coming back to our example of the “Drinking beer” code, I went through all the segments coded with that code and looked out for the specificities: how do people drink beer at that place, do they pose on pictures and if so, how? From there I went to create new codes, that were meant to specify aspects of the initial code. These codes can be defined as subcodes to the parent code (“Drinking beer” in this example) by dragging and dropping them onto the parent code or they can be created as subcodes by right-clicking onto the parent code and selecting “New code”.
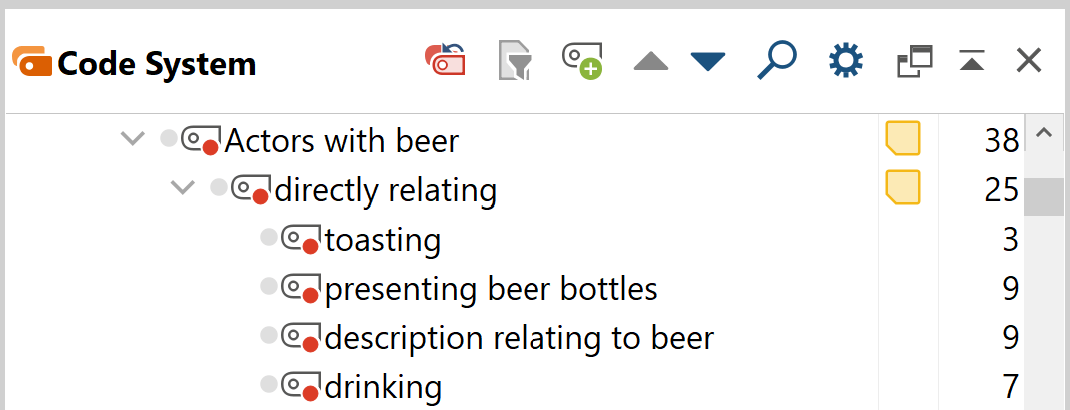
The main code “Actors with beer” and its subcodes in my Code System.
The process of going through your material, creating new codes and further refining them is often a cyclical one; as you go on with your research and gather new data, for example through interviews, collecting online material such as posts or websites or protocolling participant observation your Code System will very likely grow in different stages. Because in most project the research data isn’t imported on one singular occasion, especially if they are ethnographic projects for example that grow and develop over time.
3. Including the research question in your MAXQDA project
At the beginning of your research project, you should determine the research question in consultation with your supervisor. It is important that the question is posed as clearly as possible so that the research goals are clear from the beginning. Finally, the choice of research method is essentially based on the question posed; the broad lines of the research modalities are thus determined with the research question in mind. Fine-tuning is, of course, still possible in the course of the research if it is necessary.
In order to always have quick access to my research questions in my MAXQDA project, I wrote them down in a Free Memo. In general, Memos are a way to create your own notes and annotations and attach them to, for example, text passages, texts, document groups, images, audio/video clips and codes, similar to Post-it notes (the memo icon therefore resembles a yellow Post-it note). Unlike other memos, a Free Memo is not tied to a specific document, code, coded segment or piece of your material. Therefore, in my eyes, it was the perfect place to save my research questions.

The memo tab in MAXQDA 2022.
4. How to Analyse Your Thesis material
Search for Keywords and autocode them
MAXQDA offers a wide variety of different analytical functions that can help you get better access to your material and identify important information better. For example you can identify important keywords in text documents using the Text Search and Autocode function. Simply add the keyword and MAXQDA will create a list of all occurrences of the keyword in your material. The top right of the list tells you how often the keyword was found in your material in total and when you scroll through the list and click on one of the entries, MAXQDA will automatically jump to the original occurrence in your material. By clicking Autocode search results with a new code you can also assign a new code to all these occurrences and decide whether the code should be assigned to only the keyword, the sentence in which it occurs or the entire paragraph. This code can help you access all of these sentences or paragraphs containing the keyword easily as you can go ahead and display the coded segments in the “List of coded segments” by activating the code itself and the documents from your list of documents.
Use Visual Tools to visualize Connections
Another way to analyse your material is to use MAXQDAs visual tools. I have mentioned earlier that the colour tags you can assign to the codes can help you in the analysis. In my research project I assigned different colours to different codes focussing on practices: drinking beer on the lawn had a green tag, while taking pictures of the park had a blue tag for example. These colour tags came in handy when I started to analyse my field notes further, for example with the Document Portrait.
The Document Portrait
The Document Portrait visual tool can be opened via the visual tools ribbon in MAXQDA main ribbon menu. What it basically does is displaying the distribution of codes in a document based on the colour tags that were assigned to these codes. To create it for a specific document, simply open the document in the Document Browser and click the Document Portrait button. The Document Portrait then displays where in the document the codes were used and you also have the option to order the different colours by frequency. So, if you have assigned different colours to different codes you can easily see which codes appear most frequently. If you click on one of the dots the Document Browser will jump to the coded segment in the original document that the coloured dot represents.
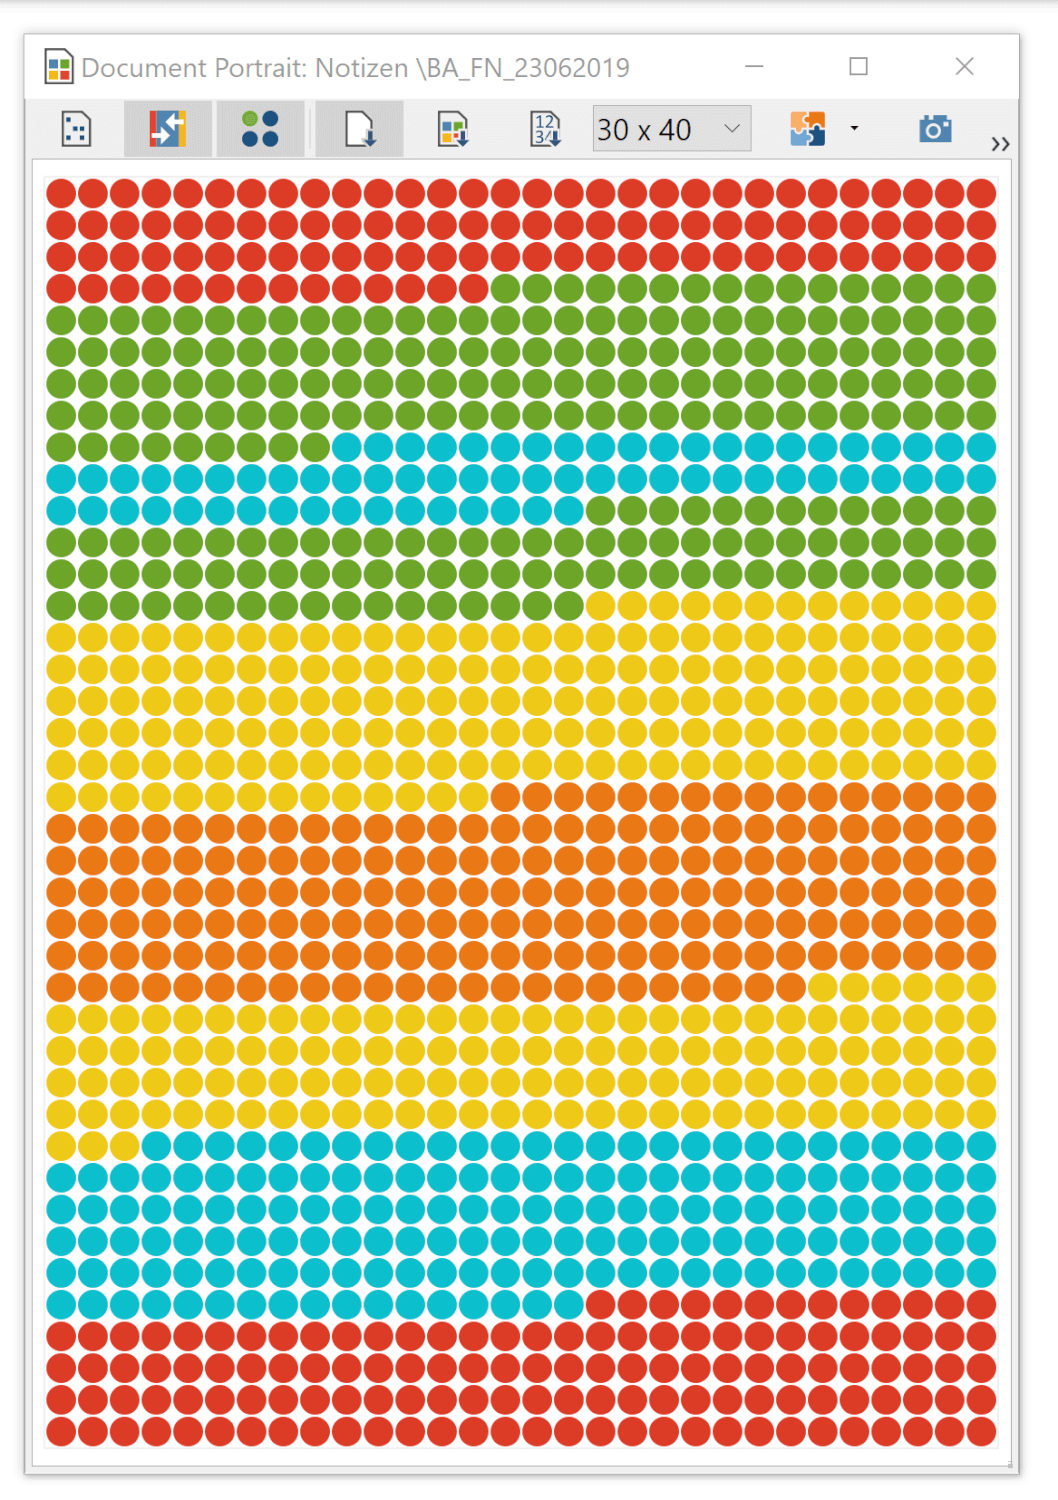
Document Portrait of one of my field notes depicting the distribution of codes in the document. The blue dots indicate that the code “Taking pictures” was used.
The Code Map
It might also be interesting to see which codes appear together frequently i.e. which topics seem to be closely related. You can inquire into these relationships using the Code Map. The Code Map will display selected codes as dots on a spreadsheet and relate them in proximity based on the number of co-occurrences. This can give you a good insight into the interrelation of codes, i.e. topics in your project. If two codes appear together frequently, MAXQDA will place them closer together on the map than two codes that appear together less frequently. There are, of course, a lot more analysis functions you can use to write your thesis with MAXQDA. Using the Complex Coding Query you could take a look at segments where specific codes intersect, overlap or follow each other just to name a few options. If your research also incorporates quantitative data such as demographical data or statistical information working with variables and the mixed methods tools might help you a lot as well.
5. Gathering Insights for Your Thesis
As your project progresses and you analyse your data in order to answer your research questions you will get more and more insight through your analysis steps. These can be gathered best in the new QTT workspace. QTT stands for Questions – Themes – Theories and once you create a new worksheet by typing in your subject and the research question you have different tabs under which you can collect important codes, segments, summary tables, related memos, visualisations, maps and consolidate what these elements tell you into an insight, a short summarization. These insight can also be displayed on one page under the “Integration of insights” tab. This way you can consolidate your findings and work out what’s really important for the questions you ask.
6. Concluding how to Write a Thesis with MAXQDA
When you have gathered your insights and found answers to your research questions you can start work on the final product and start writing. Also in that stage you can get inspired by MAXQDA on how to write your thesis, for example by looking at the Code System: I found that for my own project it was a good idea to take the main codes I created and discuss the topics they stand for in dedicated sections in order to answer the research questions I posted in the introduction of my thesis. You can find your own way of doing this: whether you stick to your codes rather closely or you create sections in your thesis based on the results of your analysis is up to you and depends on your style of writing.
Export your findings: The Report functions
MAXQDA supports you in writing your bachelors or masters thesis with different options to export the results of your research with MAXQDA. You can, for example, export the Codebook, a comprehensive list of all codes created in your document along with all the memos that belong to them. The work of collecting data, coding it and using different methods to analyse it can go on forever. When to wrap up your work in MAXQDA and start writing depends mostly on one question: have your research questions been answered and have you collected enough material to formulate strong, sound answers? As there is no fixed recipe to develop your research questions, there is no set number of how many coded segments you may need to answer said questions. Consult your supervisor in this regard and get tips from them – academic working strategies differ across institutes, faculties and fields. Whatever your topic might be – if you are working with qualitative and even quantitative data, MAXQDA will help figure out how to write your thesis, get a better understanding of your data and deeper analytical insights.
YouTube Tutorial:

