Creating a Code System and coding your data is one of the main parts of qualitative data analysis. Have you ever wondered how to proceed if you want to analyze the interrelationships among the coded data? In this month’s tip we want to introduce four different tools which allow you to analyze and visualize the relationships between codes with MAXQDA.
Code Relations Browser
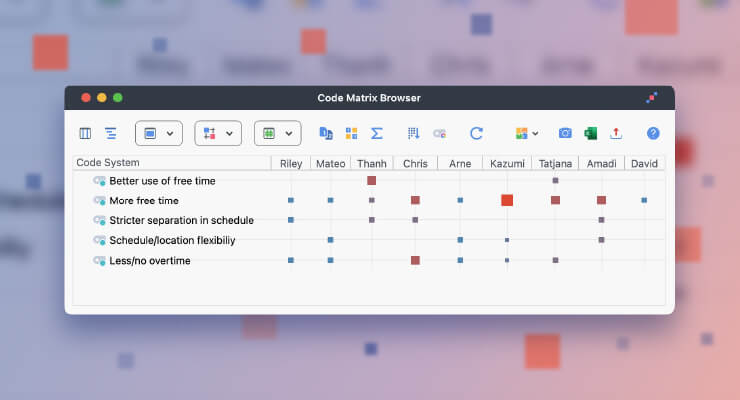
The Code Relations Browser is one of MAXQDA’s many visual tools and can be used to visualize the co-occurrence of codes at a glance. It can show you in a matrix the intersection of codes in a segment, the proximity of codes in a document, or even the occurrence of codes in the same document.
For example, let’s say that you have conducted interviews about life satisfaction. Based on the interviews, you have created a parent code titled “Interview Main Topics” and defined the different topics as subcodes. You have also created a parent code for subjective assessments and now want to know which topics are mentioned in a positive, ambivalent, or negative way. Simply go to the “Visual Tools” tab, choose the Code Relations Browser and “intersections of codes in a segment” to see the segments where codes overlap.

Screenshot from MAXQDA2020 showing the Code Relations Browser.
You can visualize the frequency of overlap either as squares, nodes, values and even as a heatmap with values.
For further information please also take a look at our online manual:
Learn more about visualizing overlapping codes in the Code Relations Browser
MAXMaps Code Co-occurrence Model
In general, MAXMaps allows you to visualize connections and to graphically represent the different elements of MAXQDA. The different models of MAXMaps can help you to organize and explore your data, visualize complex relationships, and can even be helpful for presentations.
In particular, the Code Co-occurrence Model allows you to visualize the co-occurrence of codes as a network structure with the same three modes as the Code Relations Browser: Code Intersection, Code Proximity, and Code Occurrence.
As such we can visualize the intersection of some of our main interview topics– let’s say “Career”, “Home Life”, and “Relationships”– and the assessments “positive”, “negative”, and “neutral” in the following map:

Screenshot from MAXQDA2020 showing the MAXMaps Code Co-occurrence Model.
You can of course modify the Map according to your ideas and choose between different options like displaying the codes’ frequencies, labeling the lines with the frequencies, reflecting the co-occurrence frequencies by line width, and much more.
To learn more about MAXMaps in general, our video tutorial gives a broad overview of the different models and options:
Learn more about the Code Co-occurrence Model
Code Map
With the Code Map, the chosen codes are located on a map according to their similarity, and the distances between codes represent how similar they are. That means: the more often two codes overlap, the closer they are placed together on the map. You can choose between the same three modes for the Code Map as with the Code Relations Browser and the Code Co-Occurrence Model: Code Intersection, Code Proximity, and Code Occurrence.

Screenshot from MAXQDA2020 showing the Code Map.
Code Configurations
Like the other tools we have presented, Code Configurations can be used to examine the co-occurrence of codes in a document or segment. Code Configurations are especially suitable for analyzing code combinations and provide the results in a table.
If you want to analyze the combination of the different assessment codes to see if there are segments that are rated with more than one assessment, you can use Simple Code Configuration to analyze the code combinations of this one dimension. In the results table you can see at a glance that there is no combination between the different assessments:

Screenshot from MAXQDA2020 showing the Simple Code Configuration results table.
On the other hand, if you want to analyze the interrelationship between several dimensions Complex Code Configurations can be used. In our example, we would use Complex Code Configurations to analyze the combination between our interview’s main topics and the different assessments:

Screenshot from MAXQDA2020 showing the Complex Code Configuration results table.