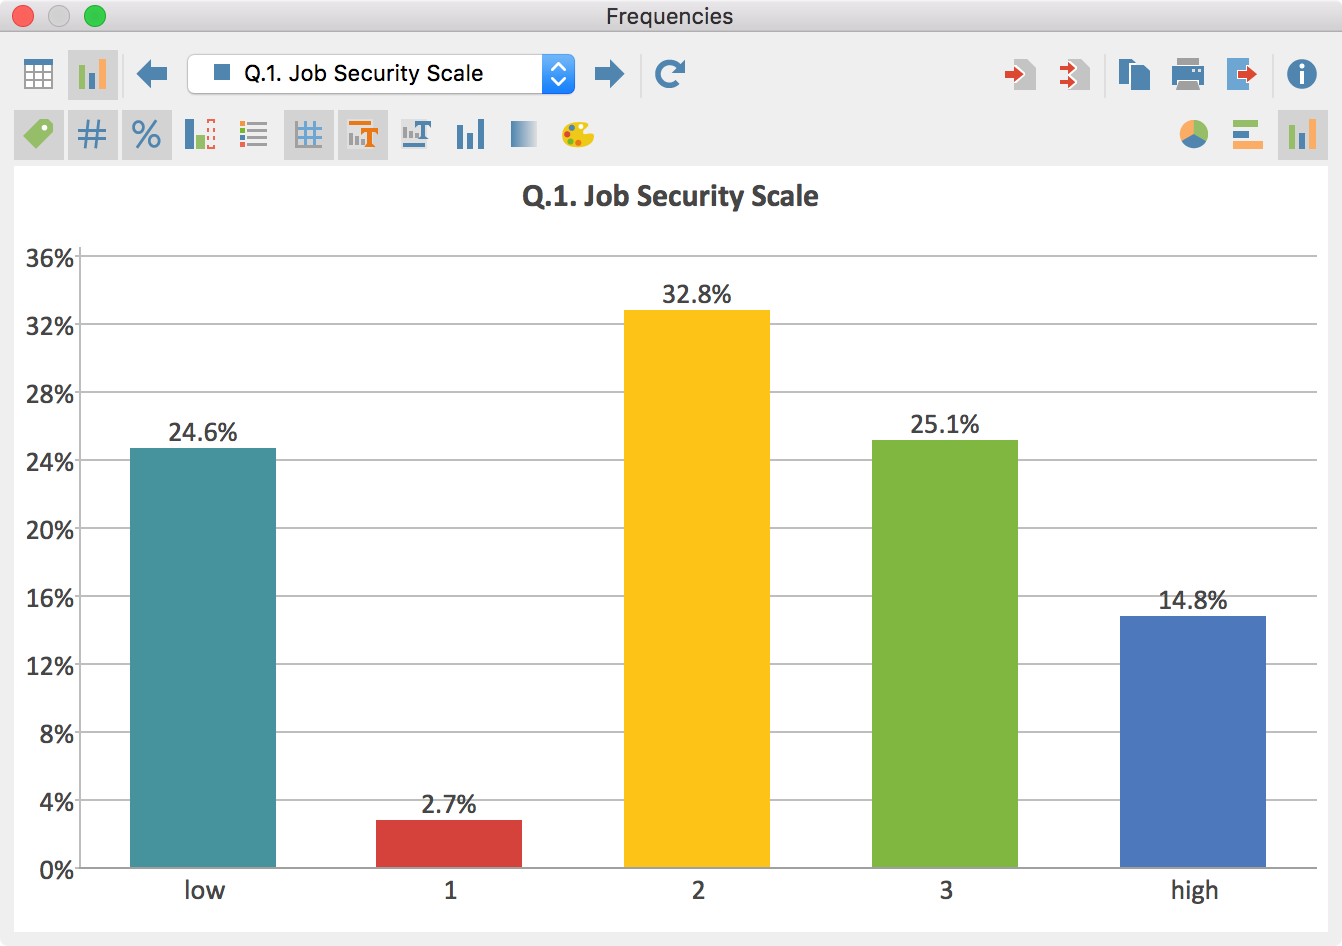
Frequency tables can be displayed as column, bar, or pie charts. You can switch between chart and table views using the ![]() and
and ![]() icons.
icons.

You can customize the chart design and display by using the icons in the toolbar above the chart, as well as double-clicking and right-clicking on the elements of the chart. The size of the chart automatically adjusts to the window size. Enlarge the window to get a larger chart.
Frequency charts can be transferred to the Output Viewer for later export. In order to do so, use the following icons.
![]() Insert chart into output viewer, to insert only the current display
Insert chart into output viewer, to insert only the current display
![]() Insert all charts into output viewer, to insert charts for all created frequency tables at the same time.
Insert all charts into output viewer, to insert charts for all created frequency tables at the same time.
To export or print a chart directly, you can use the usual icons in the top right of the window:
![]() Copy to clipboard,
Copy to clipboard, ![]() Print and
Print and ![]() Export.
Export.
