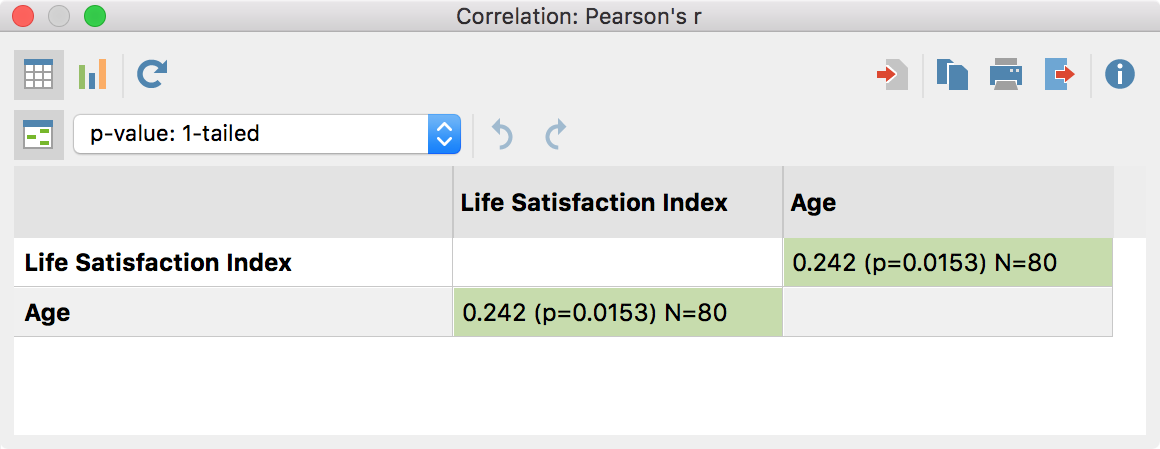
After clicking OK a results table appears containing the pairwise correlations. Since all selected variables are listed in rows and in columns all the calculated correlations are displayed twice.

Each row contains three kinds of data:
- The calculated correlation coefficient, either Pearson’s r or Spearman’s Rho, depending on the selected function,
- the p-value for the correlation coefficient’s significance, as well as
- the number of valid cases for each combination of both variables.
The picture above shows the correlation between the variables “Age” and “Life Satisfaction Index” which is highlighted in green. In this example, Pearson’s r is 0.242, the p-value is 0.0153 (thus below the significance threshold of 5%). The number of valid values for this combination of variables adds up to 80 cases.
The one-sided p-value is displayed by default. Using the drop down menu in the toolbar it is possible to switch to two-sided p-values. The p-value is calculated if the number of cases is more than 5. If there are less cases the p-value is always 1.
