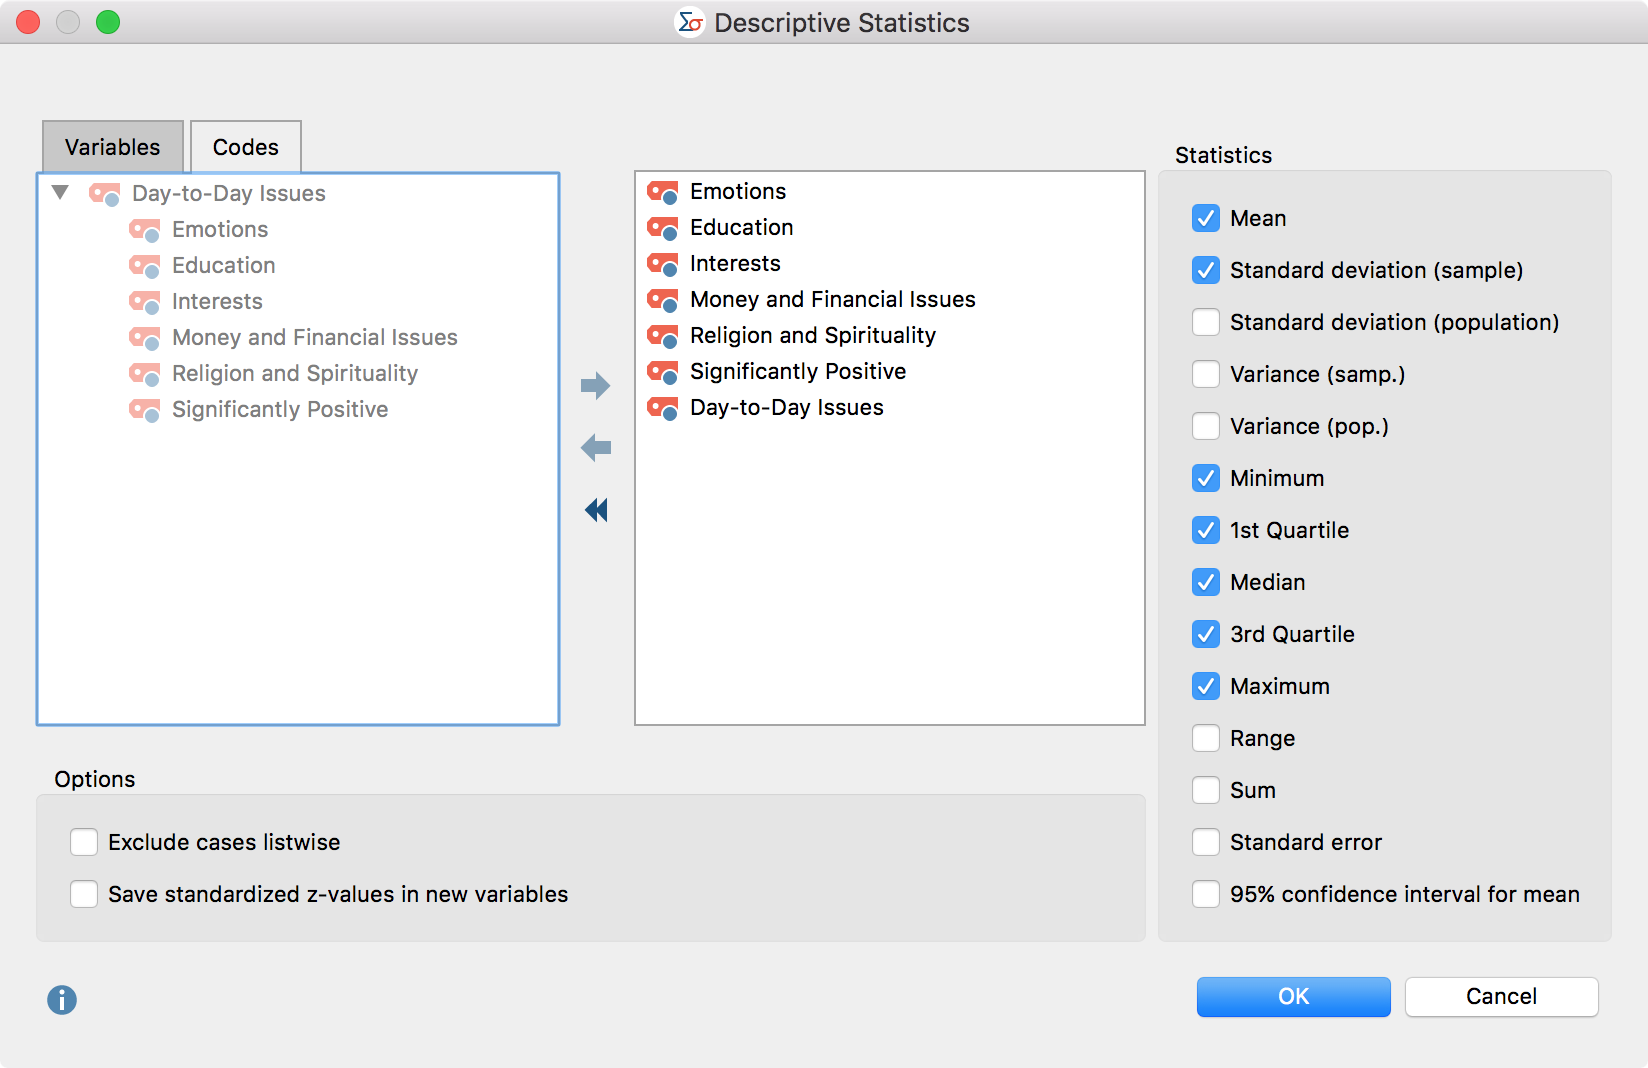
With MAXQDA Stats you can calculate various measures of descriptive statistics for several variables simultaneously, and compare results in an easy-to-read table. Begin the evaluation using the Descriptive Statistic > Descriptive Statistics menu. The following window will appear, where you can select all the desired variables and codes. In the window, only integer or floating point variables will be displayed:

Variables can be selected in several ways:
- Double-click on a variable.
- Drag and drop the variable into the right window pane.
- Select one or multiple variables with the mouse by holding the Ctrl/Cmd key then drag the selection into the right window pane with the mouse, or click the blue arrow in the middle of the window.
To generate descriptive statistics for code frequencies per document, switch to the “Codes” tab and select the desired codes. (This option is available only if MAXQDA Stats was launched with the data of a MAXQDA project).
In the right pane of the window you can select typical metrics and values for the descriptive statistics, some of which require further explanation:
1st and 3rd Quartile – The first quartile corresponds to the 25th percentile and indicates the value below which 25 % of all values fall. Accordingly, 25% of all values are greater than the value of the third quartile, that is the 75th percentile. There are various methods to determine the percentile of a distribution of measured values. A review of nine different methods can be found in Hyndman & Fan (1996): “Sample quantiles in statistical packages”. In MAXQDA Stats method no. 7 is implemented, which is also the default method used by “r”.
Standard deviation (sample) vs. (population) – for the standard deviation of population the unbiased estimator is calculated by dividing the sum of squares by (n - 1), while selecting “sample” the sum is divided by n. The same applies to the calculation of the variance.
Mean error – the standard error of the mean value is output, which is estimated from the random sample. When several samples are taken from a population, the means of these samples scatter around the true mean of the population. This scattering is called mean error.
95% confidence interval for mean – Using the mean error, the limits of the interval are calculated and displayed, which represent a 95% probability of the population mean.
In the lower section of the window, the following options are available:
Exclude cases listwise – select this option to include only cases for which all selected variables have a valid value.
Save standardized z-values in new variables – Check this option to perform a z-standardization of values for all selected variables and codes, and store the results in the new variables. The original variable name is used, supplemented by the suffix "_zvalues”. Existing variable labels are also used and supplemented by the suffix (z-standardized). If no variable label was present, the variable name is entered as a label.
