Last updated: 30.01.2026
Thematic Analysis has emerged as one of the most widely adopted approaches in qualitative research, largely thanks to the foundational work of Virginia Braun and Victoria Clarke. This flexible yet systematic method offers researchers a valuable framework for identifying, analyzing, and reporting patterns of meaning within qualitative data—whether you're working with interview transcripts, social media comments, survey responses, reports, or web pages.
In this comprehensive research guide, you’ll discover how to conduct Thematic Analysis step by step, supported by the analytical capabilities of MAXQDA software.
MAXQDA transforms your Thematic Analysis journey by providing comprehensive support throughout the research process:
- Systematically organize and analyze diverse data sources
- Develop robust themes through iterative coding processes
- Support your reflexive analytical thinking with in-place memos
- Visualize relationships between themes
- Support the writing process with easy access to data segments and analytical notes
At the end of this post, we'll also explore how MAXQDA's AI Assist can thoughtfully enhance your analytical process while maintaining the rigor and reflexivity that makes Thematic Analysis so valuable.
What is Thematic Analysis?
Thematic Analysis, as refined by Braun and Clarke, is far more than a simple method for organizing data. It's a rich, nuanced approach to qualitative analysis that recognizes the active role of the researcher in constructing meaning. Braun and Clarke's particular focus on reflexivity—the ongoing critical examination of how the researcher's background, assumptions, and decisions shape the analytical process—has led them to term their approach "Reflexive Thematic Analysis." As they emphasize, "Themes do not passively 'emerge' from data but are actively produced by the researcher through their systematic engagement with, and all they bring to, the dataset" (2022, p. 8).
The beauty of Reflexive Thematic Analysis lies in its structured flexibility. Braun and Clarke note that while there are distinct phases, researchers engage with them iteratively and recursively, rather than following a linear progression:
- Familiarizing yourself with the dataset
- Systematic coding
- Generating initial themes
- Developing and reviewing themes
- Refining and defining themes
- Writing up your analysis
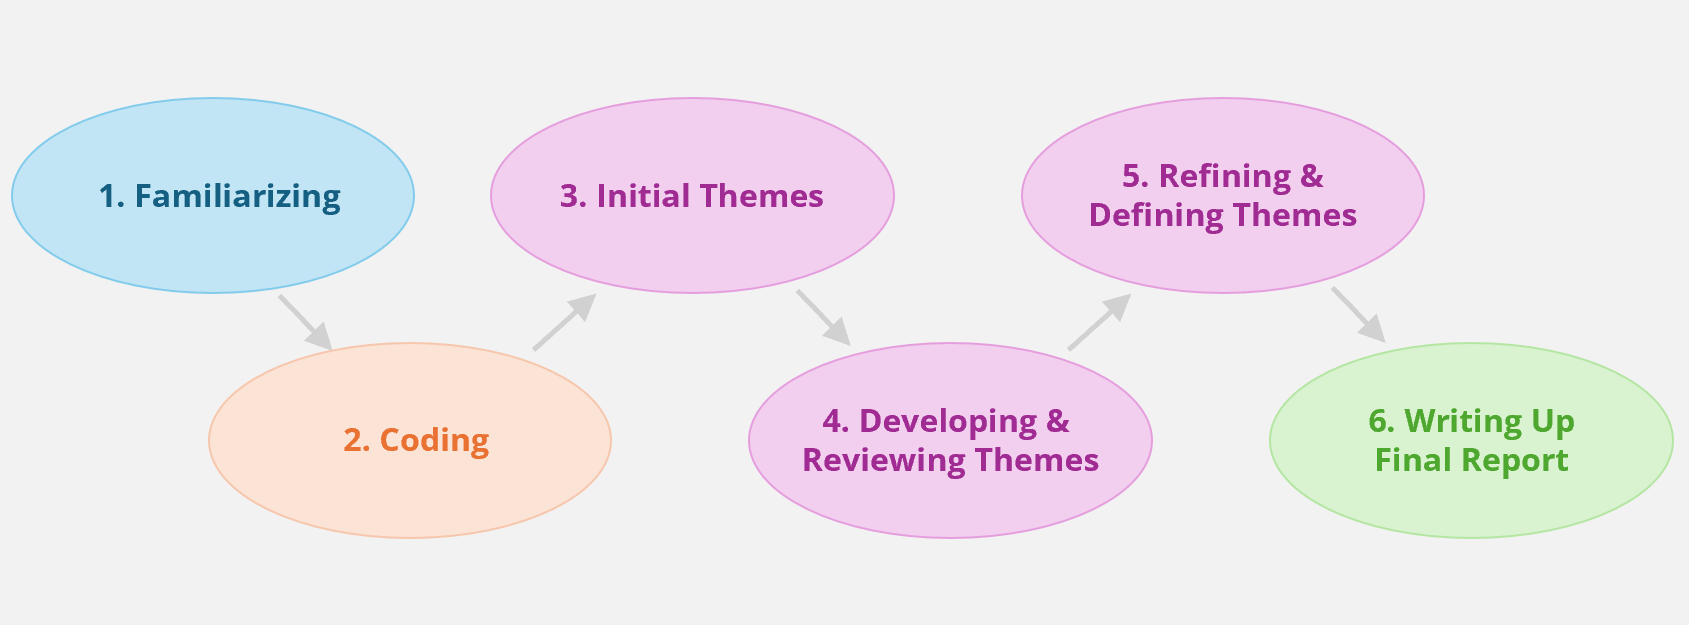
The 6 phases of Thematic Analysis according to Braun & Clarke (2022)
While this guide focuses on Reflexive Thematic Analysis as developed by Braun and Clarke, it's worth noting that MAXQDA also supports other variants of Thematic Analysis, including approaches described by Boyatzis (1998) and Guest et al. (2012). The tools and techniques we'll explore can be adapted to suit whichever approach best fits your research context and methodological preferences.

Phase 1 of Thematic Analysis: Familiarizing Yourself with the Dataset
The first phase of Reflexive Thematic Analysis, Familiarizing Yourself with the Dataset, serves as the foundational step that shapes everything that follows. According to Braun and Clarke (2022), this phase is crucial for developing deep and intimate knowledge of your data. Rather than rushing toward coding, this phase requires you to immerse yourself completely in the content, allowing yourself to absorb the richness, complexity, and nuances of your participants' experiences or the phenomena captured in your dataset.
Key activities in this phase include:
- Reading and re-reading through each document multiple times with different analytical purposes
- Initial noting of preliminary thoughts, observations, and analytic hunches as they occur
- Paying attention to non-verbal elements such as tone, pauses, or emotional expressions when working with audio or video data
- Listening to audio recordings while reading transcripts to capture additional layers of meaning
How MAXQDA Facilitates Familiarization
MAXQDA provides a comprehensive analytical environment that transforms the familiarization process from a potentially overwhelming task into a systematic and manageable endeavor.
Organize and Access Your Data in a Single MAXQDA Project
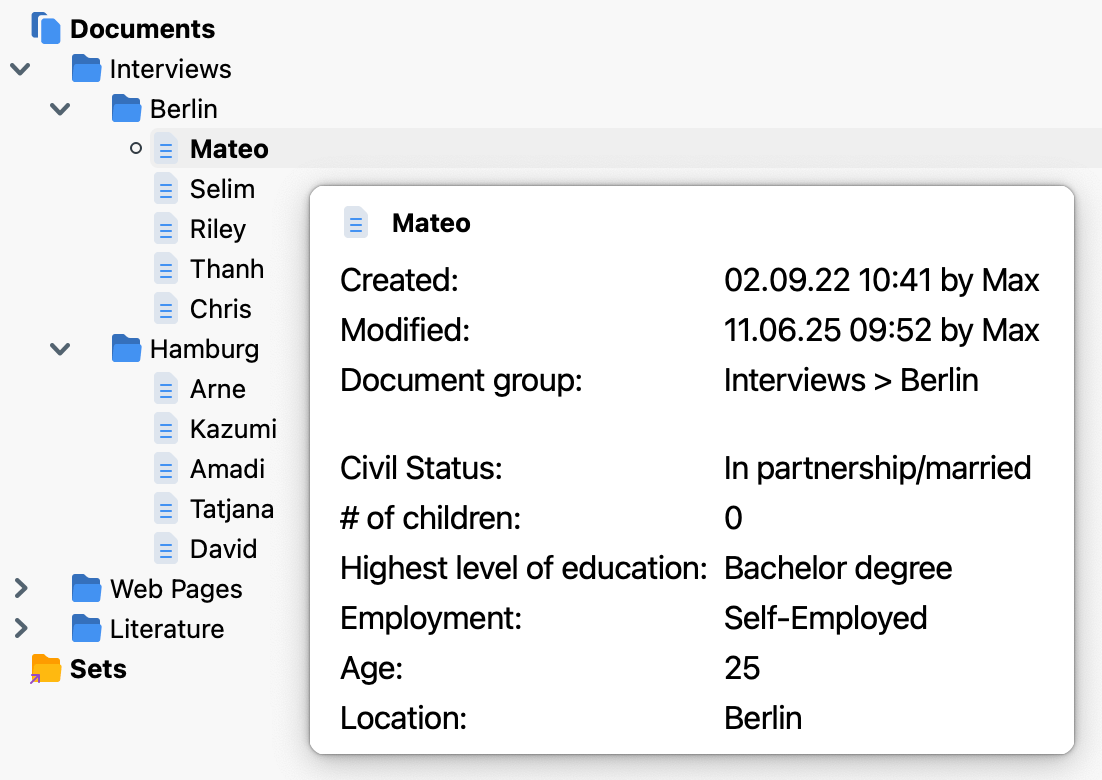
The Documents window in MAXQDA serves as your project's central hub, allowing you to import and organize multiple data sources including interviews, social media comments, web pages, reports, and survey responses in one unified project. The Document Groups feature helps you organize your data and related materials, while Document Variables enable you to track important characteristics across your dataset—essential for maintaining overview as you develop intimate knowledge of your data.
Explore Your Data in the Document Browser
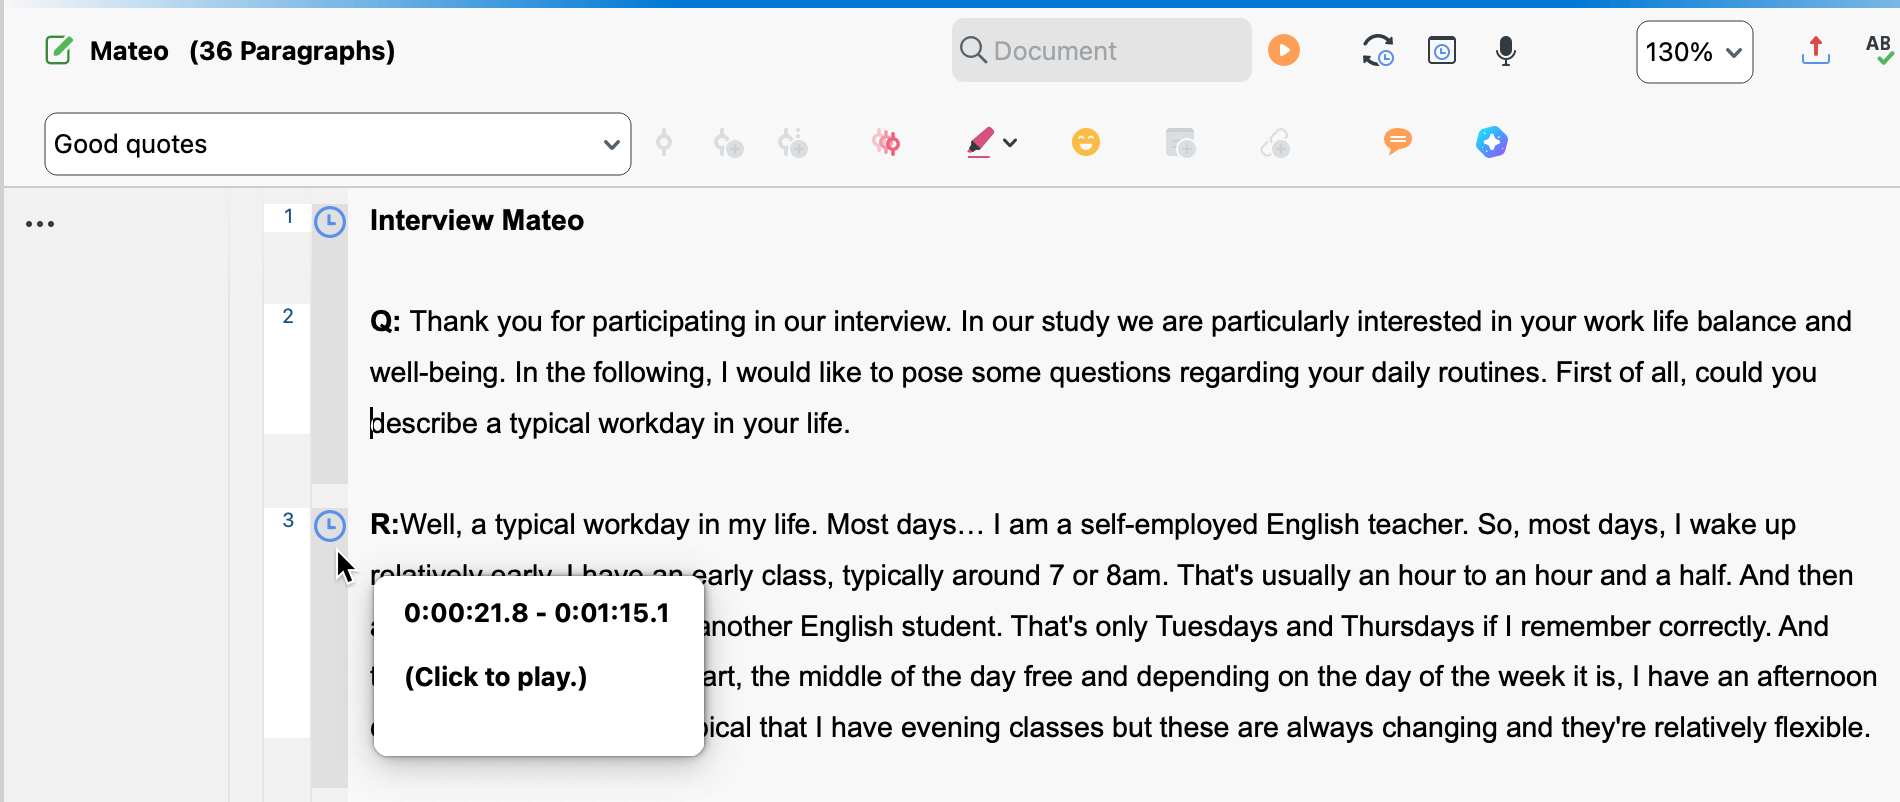
MAXQDA’s Document Browser provides an optimized reading environment specifically designed for deep engagement with qualitative data. You can adjust font sizes for comfortable extended reading sessions, open multiple documents simultaneously for comparison, and seamlessly navigate between different data sources. For audio-recorded interviews, clickable timestamps allow you to instantly access the original audio to capture nuances of tone, emotion, or emphasis that enrich your understanding—particularly valuable when you haven't conducted interviews yourself or when using MAXQDA's automatic transcription feature.
Capture Your Emerging Insights with Memos
MAXQDA's comprehensive memo system proves invaluable for documenting your developing understanding throughout the familiarization process.
- In-Document Memos attach directly to specific text segments, perfect for capturing immediate reactions to particular quotes, observations about participant emotions, or questions that arise while reading.
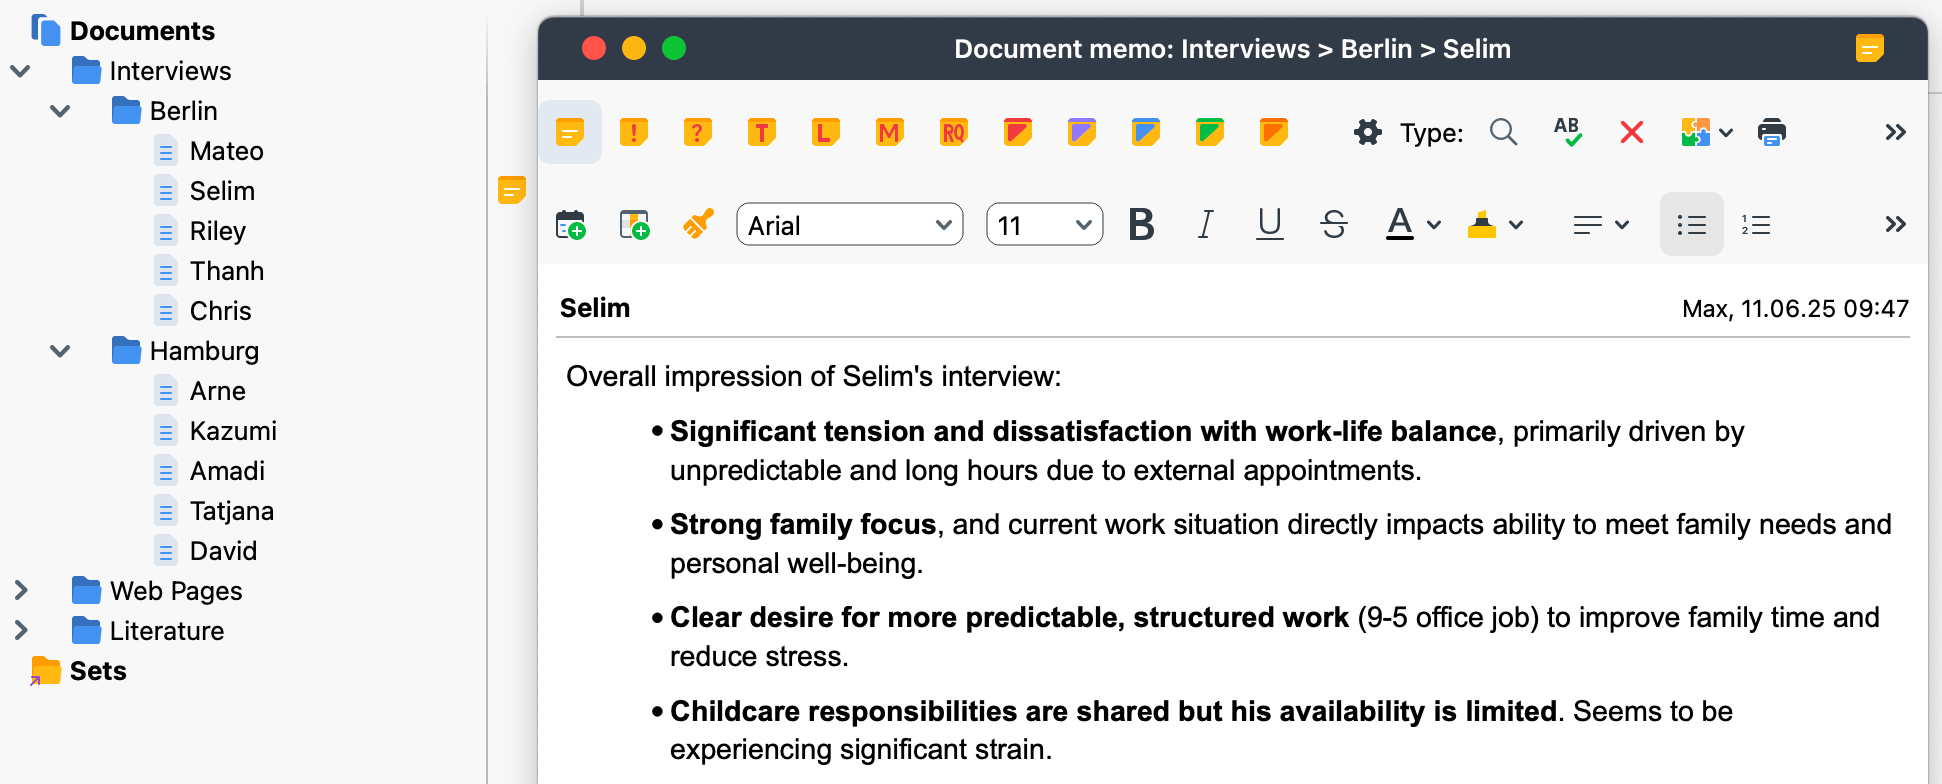
- Document Memos provide space for broader reflections about entire interviews or documents, where you might summarize overall impressions, note dominant topics, or highlight contradictions within a participant's narrative.
- Free Memos and the Project Memo support your developing understanding of the dataset as a whole, allowing you to track overarching patterns and document evolving questions about your research focus.

You can recognize memos by their yellow sticky note symbol. These symbols are fully interactive: simply hover your mouse over a symbol to read the memo, or double-click to open and edit the text.
Explore Language with Word-Based Tools
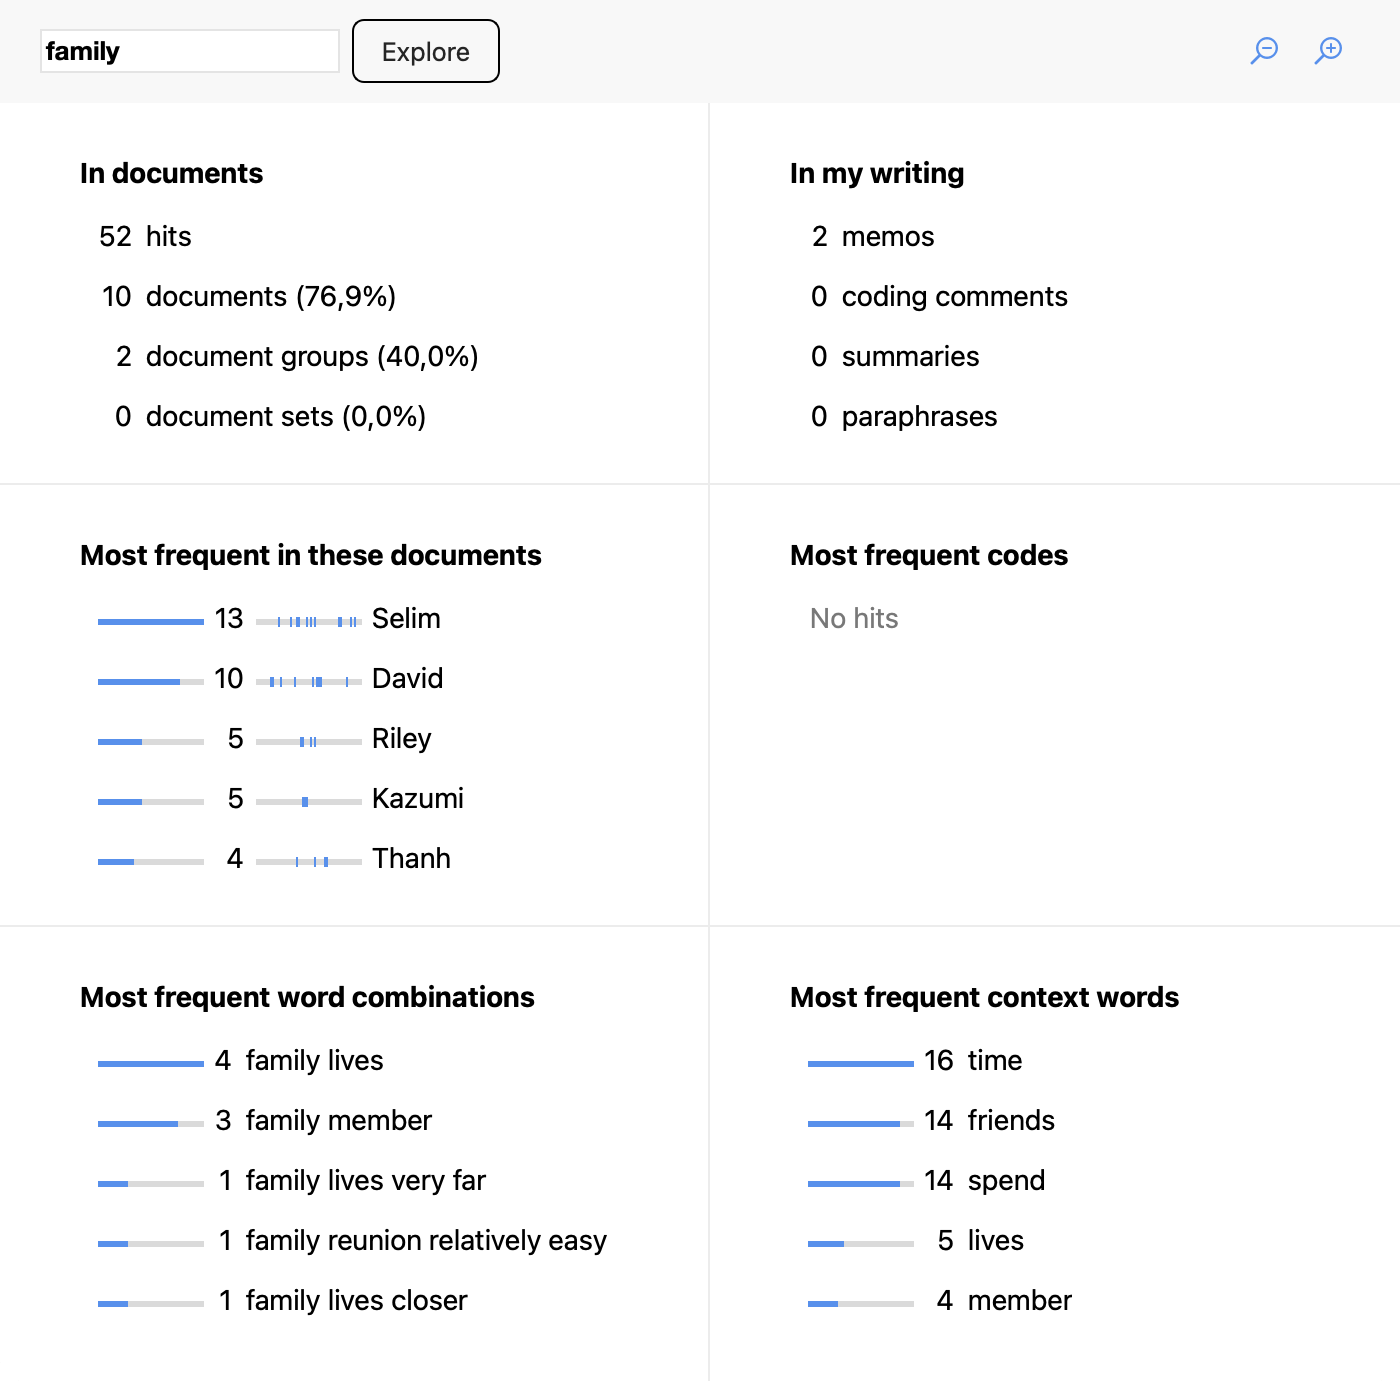
You may supplement your close reading with MAXQDA's word-based exploration tools. Are there any specific word usages? Who used a specific word? Which words are often used together?
- Text Search helps locate specific concepts across documents (optionally including synonyms for your search terms)
- Word Clouds, Word Frequency Lists, and Word Combination Lists reveal interesting patterns in language use.
- Word Explorer examines how particular terms are used in context.
- Word Tree uncovers metaphors, implicit assumptions, or conceptual frameworks that participants employ.
These tools also help identify differences between cases or participant groups.
Phase 2 of Thematic Analysis: Coding
Phase 2 of Reflexive Thematic Analysis, Coding, marks the transition from familiarization to systematic analysis. After thoroughly immersing yourself in the data, coding represents the systematic process of identifying and labeling segments of data that are interesting, meaningful, and relevant to your research question. Braun and Clarke (2022) emphasize that codes capture singular aspects of the data related to the research focus—they are the essential building blocks for themes, though at this stage, a code is not yet a theme.
Coding in Reflexive Thematic Analysis is inherently interpretive work. You're not simply organizing data into predetermined categories, but you’re actively engaging with the content to identify what matters most for understanding your research questions.
Key activities in this phase include:
- Working through your entire dataset and applying code labels to all relevant segments
- Creating codes as concise labels that capture the essence of data segments, ranging from explicit/semantic codes (close to the surface meaning of the data) to implicit/latent codes (beyond explicit content to interpret underlying ideas, assumptions, or implications)
- Maintaining analytical inclusivity by generally over-coding rather than under-coding initially
How MAXQDA Facilitates Coding
MAXQDA transforms the coding process from a potentially cumbersome task into an efficient, organized, and analytically robust experience through its comprehensive suite of coding tools.
Intuitively Create and Apply Codes
The Code System window allows you to easily create new codes and organize them hierarchically as your analysis evolves. While hierarchical organization becomes valuable later, flat code lists are common at the beginning of Thematic Analysis—MAXQDA accommodates both approaches seamlessly: you can rearrange code order anytime by simply dragging codes with your mouse.
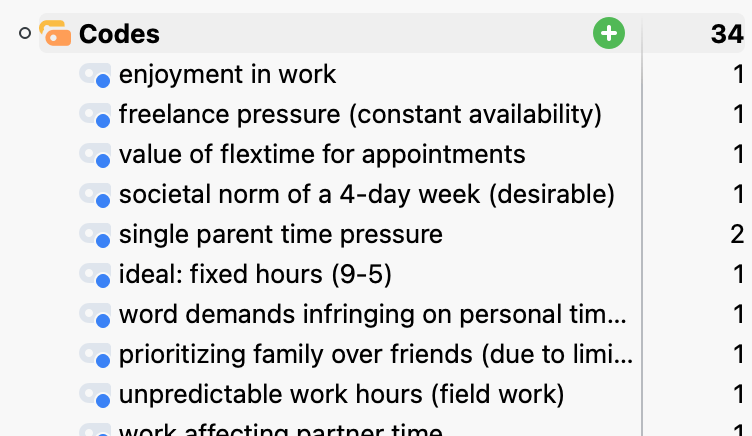
MAXQDA's flexible drag-and-drop functionality makes coding intuitive: simply select text segments in the Document Browser and drag them onto codes in the Code System. Need to create a new code on the fly? The Code with a new code feature (accessible by right-clicking any highlighted segment) lets you create and apply new codes in one smooth motion, keeping you in the analytical flow during intensive coding sessions.

As the image illustrates, coded segments are instantly recognizable by coding stripes alongside the text and codes can overlap—perfect for capturing the rich, multi-layered meanings in your data.
Visually Organize Your Codes Using Colors
Using MAXQDA’s option to color your codes creates a powerful visual infrastructure that supports pattern recognition throughout your analysis. Use colors strategically to group related codes, distinguish between different code types (such as semantic versus latent ones), or highlight codes at different analytical levels. This visual organization becomes increasingly valuable as your code system grows and patterns begin to emerge.
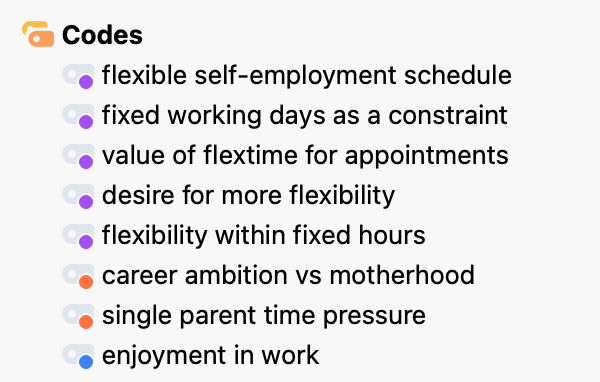
Tip: Leverage Highlight Coding to capture compelling quotes for presentations and theme illustrations. Highlighted passages appear in your chosen colors for easy identification. Highlight coding is available in the toolbar above your text:

Just double-click the code name in the Codes window to instantly display all associated quotes—perfect for building evidence for your themes.
Document Your Coding Process and Insights Using Memos
MAXQDA’s Code memos serve as essential analytical records attached to individual codes. Use these memos to define code meanings, document why codes were created, track evolving ideas about their significance, or note relationships with other codes. These memos become crucial for maintaining consistency across your coding work and supporting the reflexive analytical process that characterizes Braun and Clarke's approach.
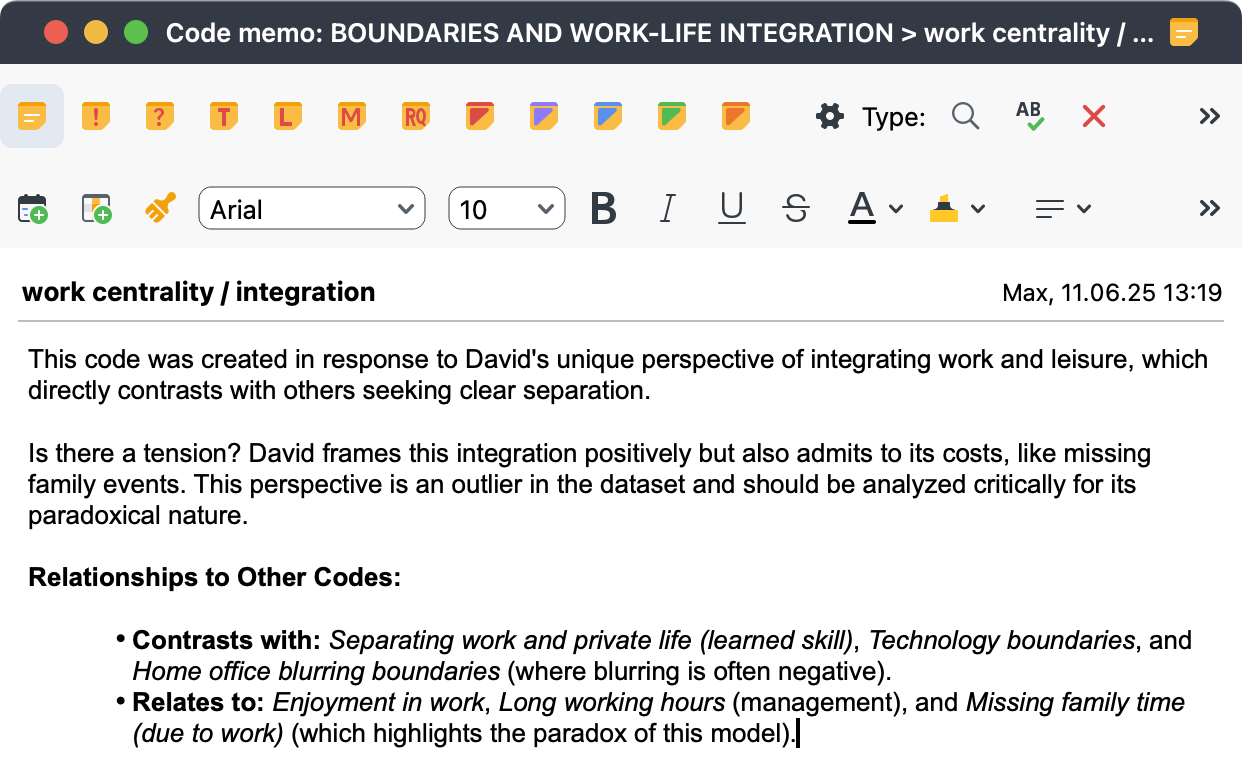
By combining intuitive coding tools with robust organizational features, MAXQDA doesn't just store your codes—it actively supports your analytical thinking, helping you move from initial data familiarization through to compelling theme development.
Phase 3 of Thematic Analysis: Generating Initial Themes
Phase 3 of Reflexive Thematic Analysis, Generating Initial Themes, marks a crucial shift in your analytical focus from individual codes to broader patterns of meaning. After systematically coding your data, this phase involves stepping back to see the forest rather than the trees—identifying how different codes might cluster together around shared concepts or central organizing ideas. This transition requires a fundamental shift in analytical thinking, moving from the detailed, segment-level focus of coding to the broader conceptual level where themes reside.
As Braun and Clarke emphasize, themes are not simply descriptive headings for groups of codes. Instead, they are "rich, multifaceted patterns of shared meaning situated around a central organizing concept" (Terry & Hayfield, 2021, p. 50). This phase challenges you to think analytically about relationships between codes and begin constructing themes that capture broader underlying meanings and concepts addressing your research questions.
Key activities in this phase include:
- Reviewing your codes systematically by examining your complete code list and associated data extracts
- Creating visual representations through concept maps, tables, or other visualizations to explore code relationships
- Identifying relationships between codes by examining how different codes might relate to each other and to your research questions
- Clustering codes around shared concepts by grouping codes that seem to share a common underlying idea or theme
- Articulating the central organizing concept for each cluster by defining what shared idea makes each group of codes a potential theme
How MAXQDA Facilitates Generating Initial Themes
MAXQDA provides powerful analytical tools that support the crucial transition from codes to initial themes, helping you visualize emerging patterns and test your developing theoretical ideas.
Start with Strategic Code System Review
Begin your theme development by leveraging MAXQDA's flexible Code System for systematic pattern exploration. The intuitive drag-and-drop functionality allows you to experiment with code arrangements, testing potential groupings and exploring hierarchical relationships that might reveal thematic connections. Use code colors strategically to create visual clusters of related codes—this visual experimentation often illuminates connections that weren't apparent during initial coding and establishes a solid foundation for sophisticated analytical work.
Visually Develop Themes: Creative Coding
MAXQDA's Creative Coding workspace becomes your analytical playground during Phase 3, offering a dedicated visual environment where abstract thinking meets concrete data exploration. This powerful feature allows you to:
- Spatially arrange codes to test different thematic relationships
- Merge related codes
- Experiment with groupings before committing to specific theme structures
- Generate higher-order codes that represent initial themes
- Update your code system directly from your visual explorations
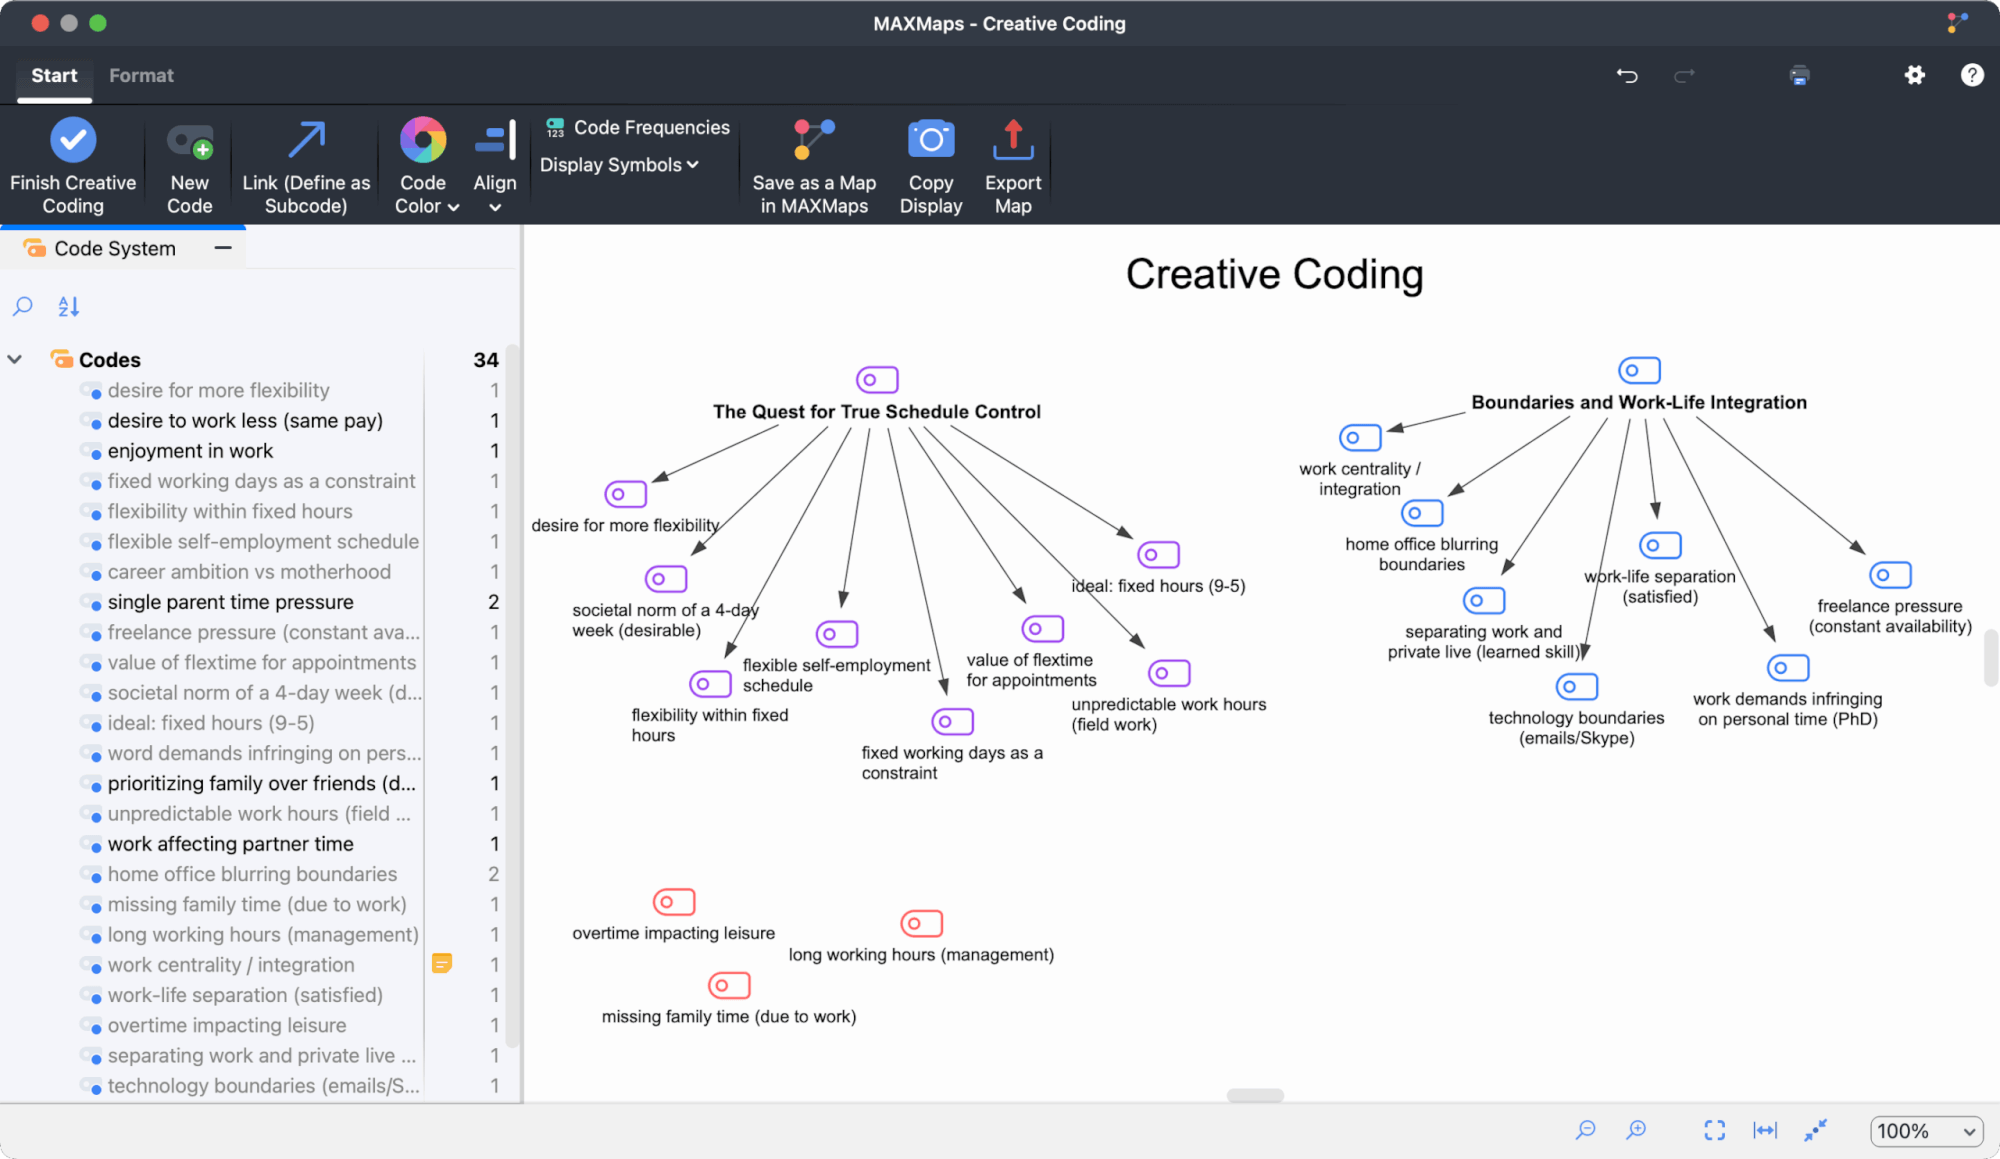
Tip: Double-clicking any code in Creative Coding instantly compiles all segments coded with that code, allowing immediate data verification of your themes.
The visual nature of Creative Coding stimulates analytical thinking about connections and enables rapid testing of different thematic configurations. It's particularly valuable for researchers who think visually or need to present their analytical process to supervisors or team members.
Ground Your Themes in The Data
Use the Retrieved Segments feature to test your emerging thematic ideas against your actual data. First, activate all documents. Then activate multiple codes you believe might belong together and systematically review their associated data segments in the Retrieved Segments window (to activate documents or codes, click on their icon in the Documents or Codes window). This allows you to examine whether the data actually supports the idea of a shared concept underlying these codes, providing crucial empirical grounding for your developing thematic framework.
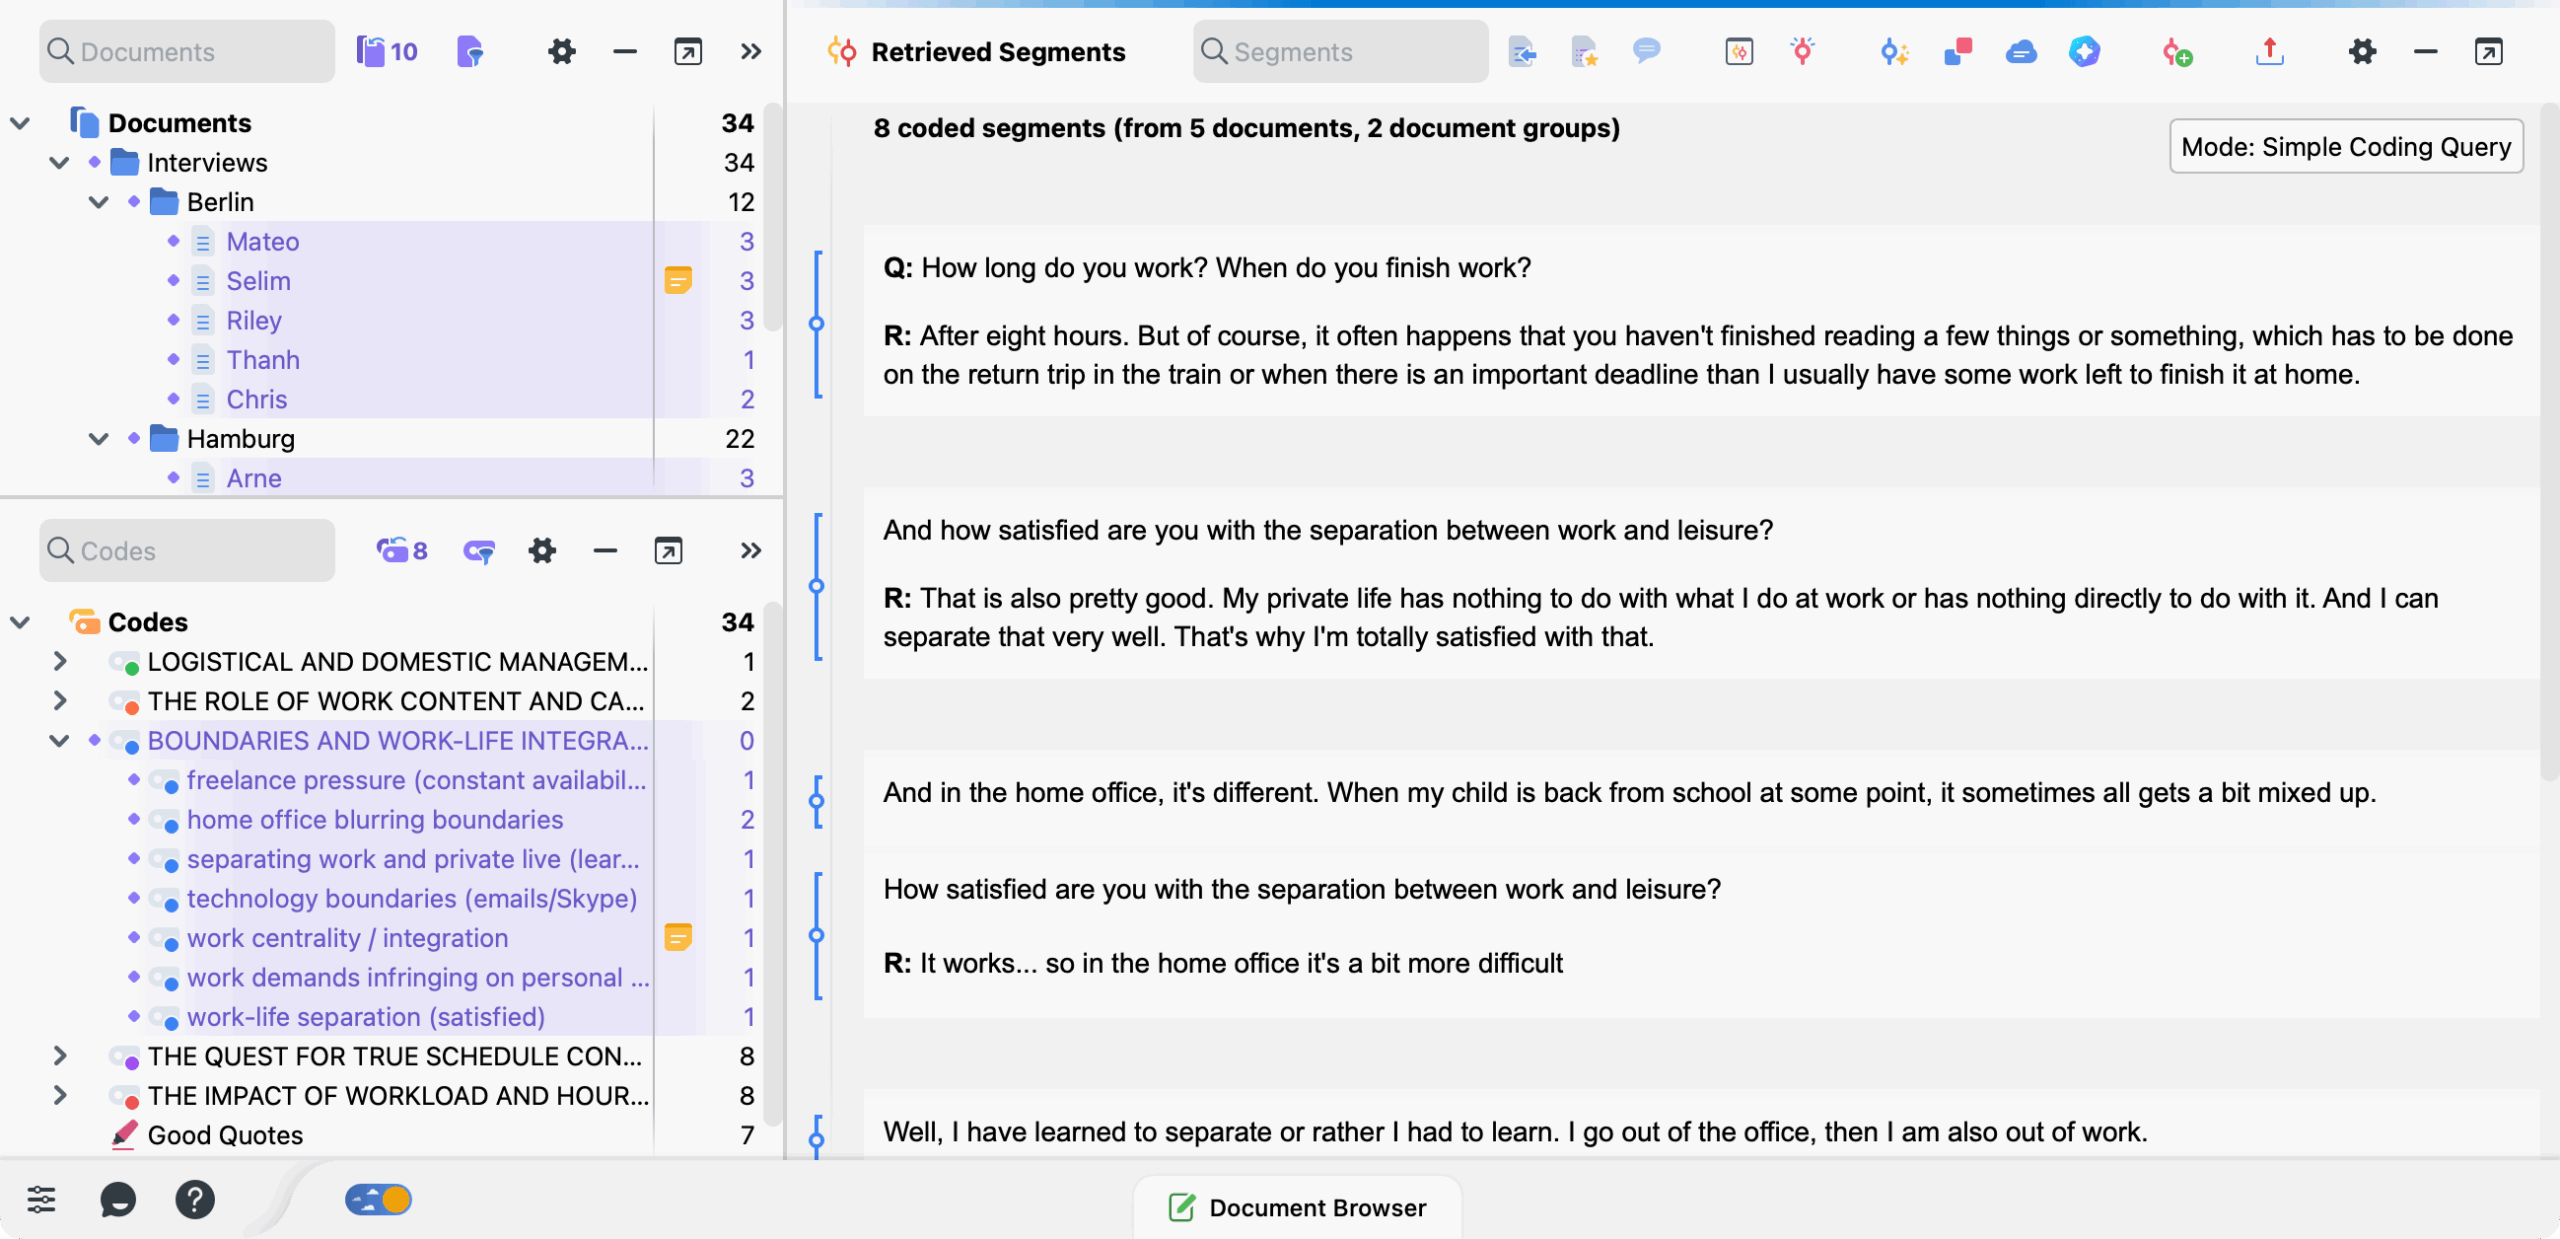
Document Your Thoughts on Initial Themes with Memos
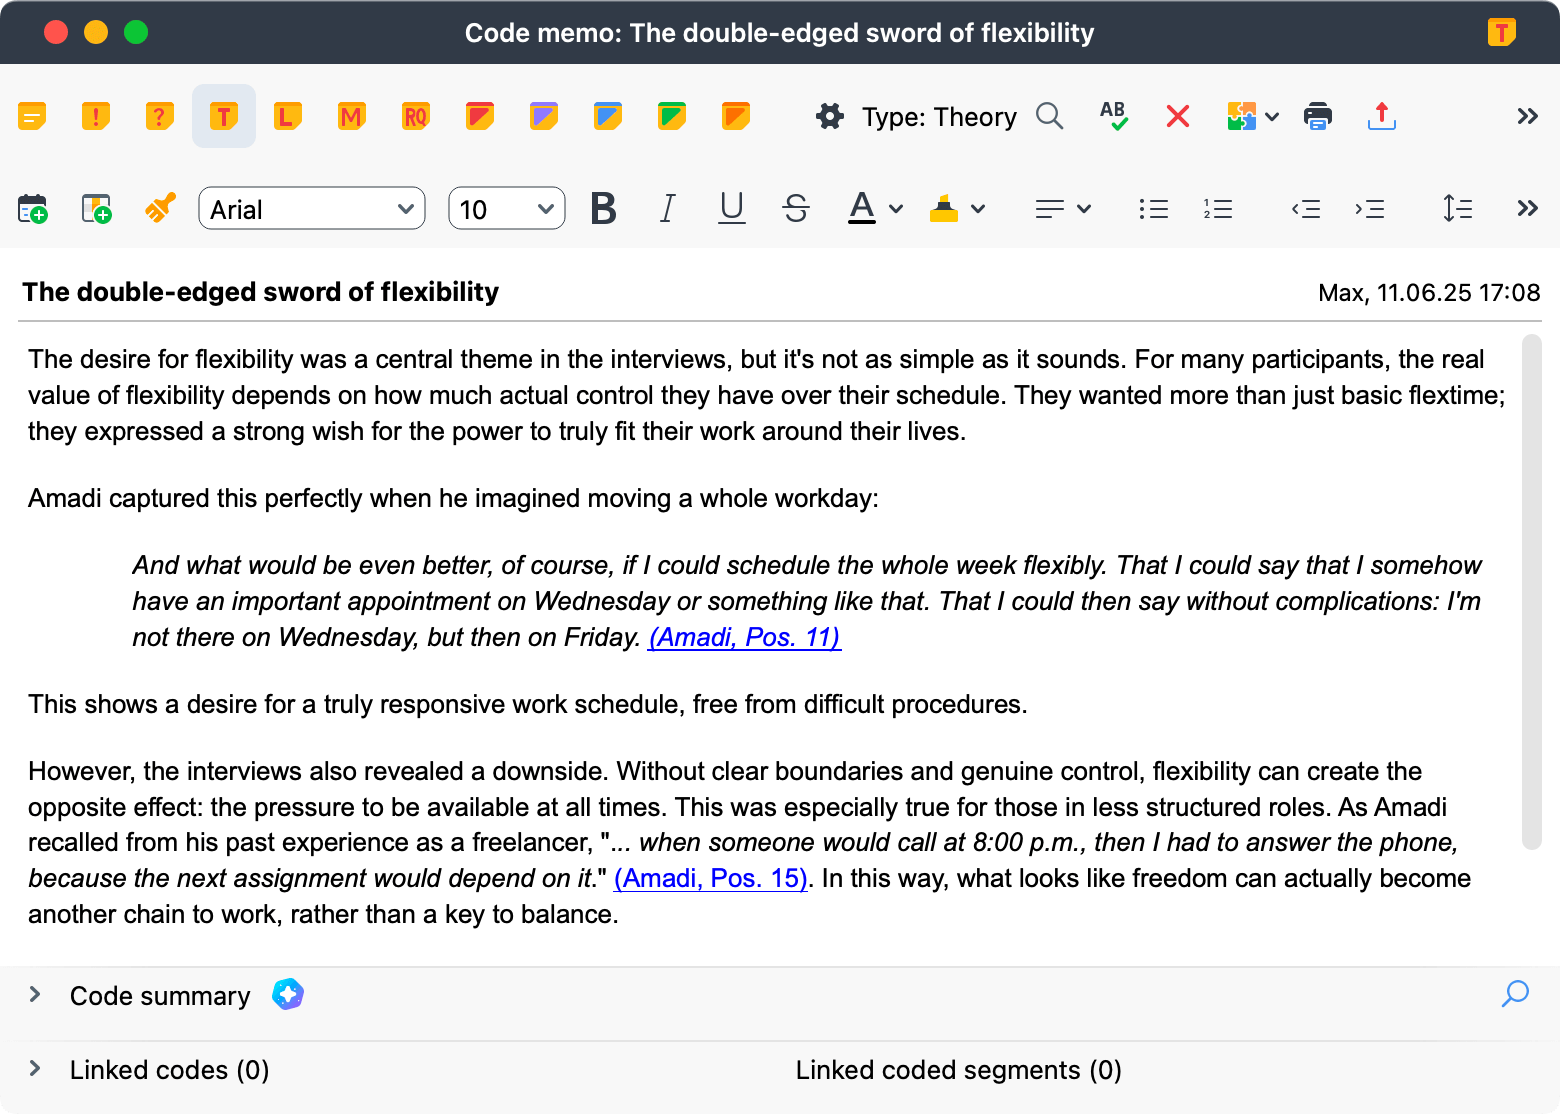
Memos become crucial during theme development for capturing your evolving thinking about potential themes. You should create memos that articulate the core idea of each emerging theme, document why certain codes seem to belong together, and explore questions about thematic boundaries and relationships.
Tip: While Thematic Analysis distinguishes between codes and themes conceptually, you'll use MAXQDA's code memo feature to document your notes on themes. It’s just the software's terminology for this essential analytical function.
For easy differentiation, you can use the T-symbol, selectable at the top of each memo, for all your theme-related memos.

Remember that Phase 3 generates initial themes—tentative patterns representing your first attempts at identifying broader meanings in your data. These early themes will likely undergo significant refinement, merging, splitting, or even elimination in subsequent phases. This iterative evolution isn't a flaw in your analysis; it's the hallmark of rigorous Reflexive Thematic Analysis.
Phase 4 of Thematic Analysis: Developing and Reviewing Themes
Phase 4, Developing and Reviewing Themes, represents a critical and iterative evaluation process in Reflexive Thematic Analysis. As Braun and Clarke (2022) describe, this phase involves rigorously testing and refining your initial, potential themes from Phase 3 against your data. The goal is to ensure your themes are coherent, distinct, and accurately represent important patterns in your data that address your research questions. This phase typically involves moving backwards and forwards between the data and your developing themes, ensuring the resulting thematic framework is both empirically grounded and comprehensive in its coverage.
Key activities in this phase include:
- Reviewing themes against coded segments to assess coherence and fit (Does the theme accurately capture the essence of these segments? Are there extracts that don't quite fit?)
- Evaluating themes against the entire dataset for comprehensive representation (Do they represent the data well? Have you missed anything important?)
- Assessing theme distinctiveness and scope (Does each theme have a clear, central organizing concept? Are the themes clearly different from each other? Is a theme too broad or too narrow?)
- Refining, merging, splitting, or discarding themes based on systematic review
How MAXQDA Facilitates Developing and Reviewing Themes
MAXQDA provides sophisticated tools that support this crucial theme evaluation phase, making the systematic review process both manageable and analytically robust.
Review and Restructure Codes and Data per Theme
Building on the Retrieved Segments workflow established in Phase 3, Phase 4 deepens your thematic evaluation through systematic restructuring. MAXQDA's flexible Codes window enables you to create new higher-level codes for refined themes, relocate subcodes between different themes, merge related codes that strengthen thematic coherence, or eliminate codes that no longer serve your analytical framework. Of course, you can also rename themes directly within the Codes window to reflect your refined conceptual understanding.
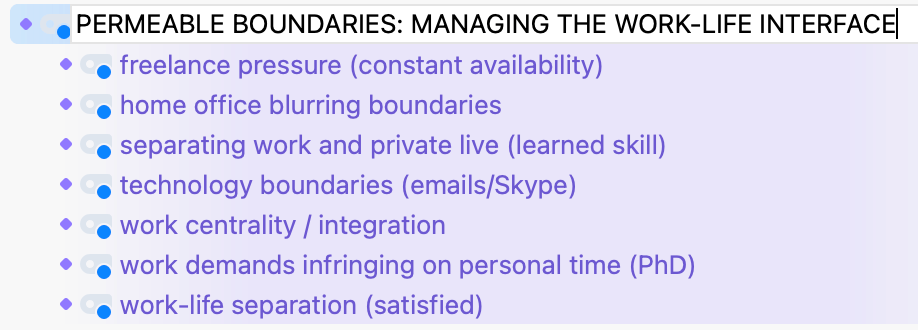
Visualize Distribution of Themes
The Code Matrix Browser (available in the Visual Tools ribbon menu) enables sophisticated exploration of how your themes are distributed across different participants, cases, or demographic groups. This powerful visualization tool reveals whether themes appear consistently throughout your dataset or concentrate within specific subgroups, helping identify important nuances that might require theme refinement or subdivision. Such distribution analysis often uncovers patterns that inform both your thematic framework and your broader analytical narrative.

Visualize Themes' Structure and Relations
MAXMaps provides a dedicated workspace for visualizing your evolving thematic structure and exploring relationships between themes. You can use it to create visual representations that map themes and their interconnections, experiment with different organizational configurations, and examine how individual themes contribute to addressing your research questions.
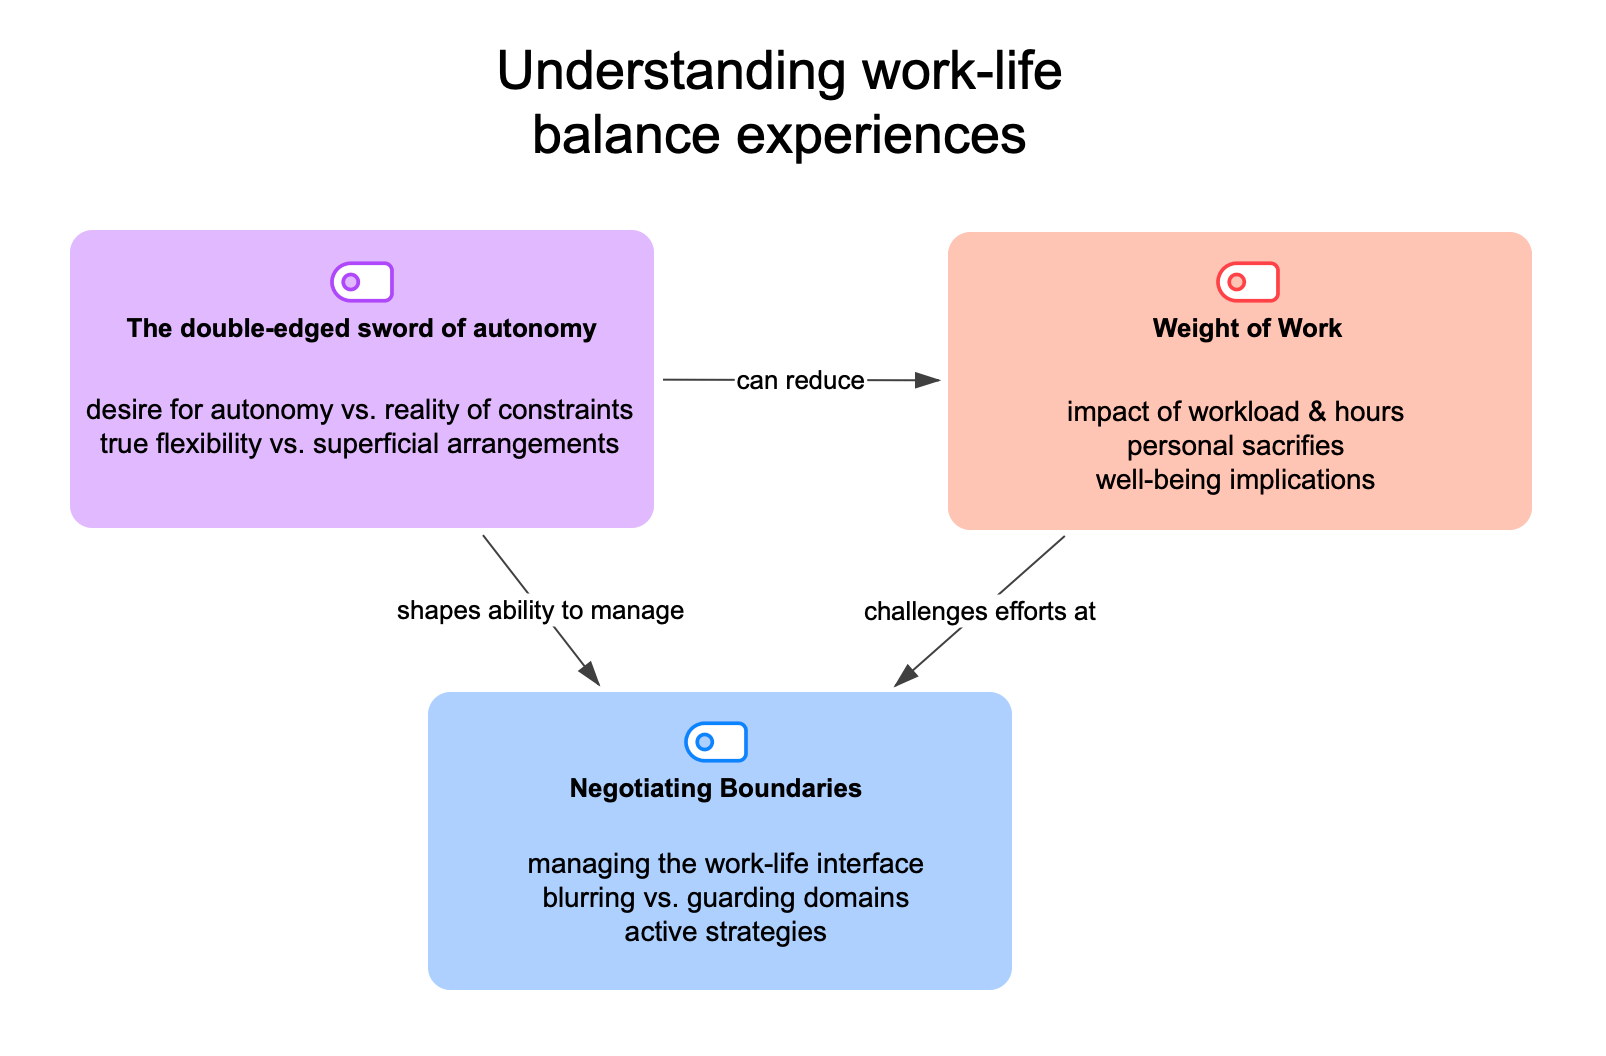
Update Your Memos for Themes
Phase 4 presents an ideal opportunity to update your theme memos from Phase 3, ensuring they reflect your latest decisions and rationale. To document your analytical evolution, consider adding your newest insights at the top of existing theme memos to create a clear record of how your understanding has developed.
Phase 5 of Thematic Analysis: Refining, Defining, and Naming Themes
Phase 5 of Reflexive Thematic Analysis, Refining, Defining, and Naming Themes, represents the crystallization of your analytical work. Building on the review process in Phase 4, this stage focuses on finalizing each theme to ensure it captures a unique and coherent core point with rich nuance drawn from the dataset. According to Braun and Clarke (2022), you're essentially preparing your themes for presentation by ensuring they are theoretically sound and can be clearly understood by others.
This phase requires precision in your analytical thinking. Each theme needs to be refined to its essential core while maintaining the complexity and richness that makes it meaningful. The work involves both analytical finalization and communicative preparation for your research presentation.
Key activities in this phase include:
- Conducting final refinement (ensure themes are distinct, well-supported, and work coherently together)
- Writing detailed definitions (articulate core concept, boundaries, and contribution to research questions)
- Choosing evocative names (select concise, engaging names that capture each theme's essence)
How MAXQDA Facilitates Refining, Defining, and Naming Themes
Phase 5 builds on the same MAXQDA tools introduced in Phase 4, but shifts focus from evaluation to finalization. You can leverage Retrieved Segments for final coherence verification across all theme data, MAXMaps for visualizing how your themes work together as a complete framework, and Theme Memos as your primary documentation tool for capturing definitive theme definitions.
Finalize Theme Definitions and Names
Theme memos serve as the central repository for your finalized analytical work. Create comprehensive memos for each theme that include
- the carefully chosen theme name,
- a concise but detailed definition of the theme's core concept,
- clear articulation of the theme's scope and boundaries (what it includes and excludes),
- and explanation of the theme's specific contribution to understanding your research questions.
These memos become your definitive theme documentation—essential reference materials for writing up your analysis and ensuring consistency in how you present each theme throughout your research report.
Phase 6 of Thematic Analysis: Writing up
Phase 6, Writing Up, is the culmination of your analytic journey. According to Braun & Clarke (2022), this is where you weave together your analytic narrative, using your defined themes and compelling data extracts to tell the story of your data in relation to the research question. While presented as the final phase, writing often begins informally much earlier—through memos, theme definitions, and notes. In this final phase, however, writing becomes more structured and formal.
Key activities in this phase include:
- Presenting a coherent narrative that logically organizes themes into a coherent story
- Illustrating themes with compelling quotes that demonstrate key patterns
- Interpreting findings and relating them to existing literature and theoretical frameworks
- Ensuring clear and engaging writing that avoids jargon while maintaining analytical rigor
How MAXQDA Facilitates Writing Up
MAXQDA transforms the writing process from a potentially fragmented task into a streamlined, well-supported endeavor through its comprehensive documentation and export capabilities.
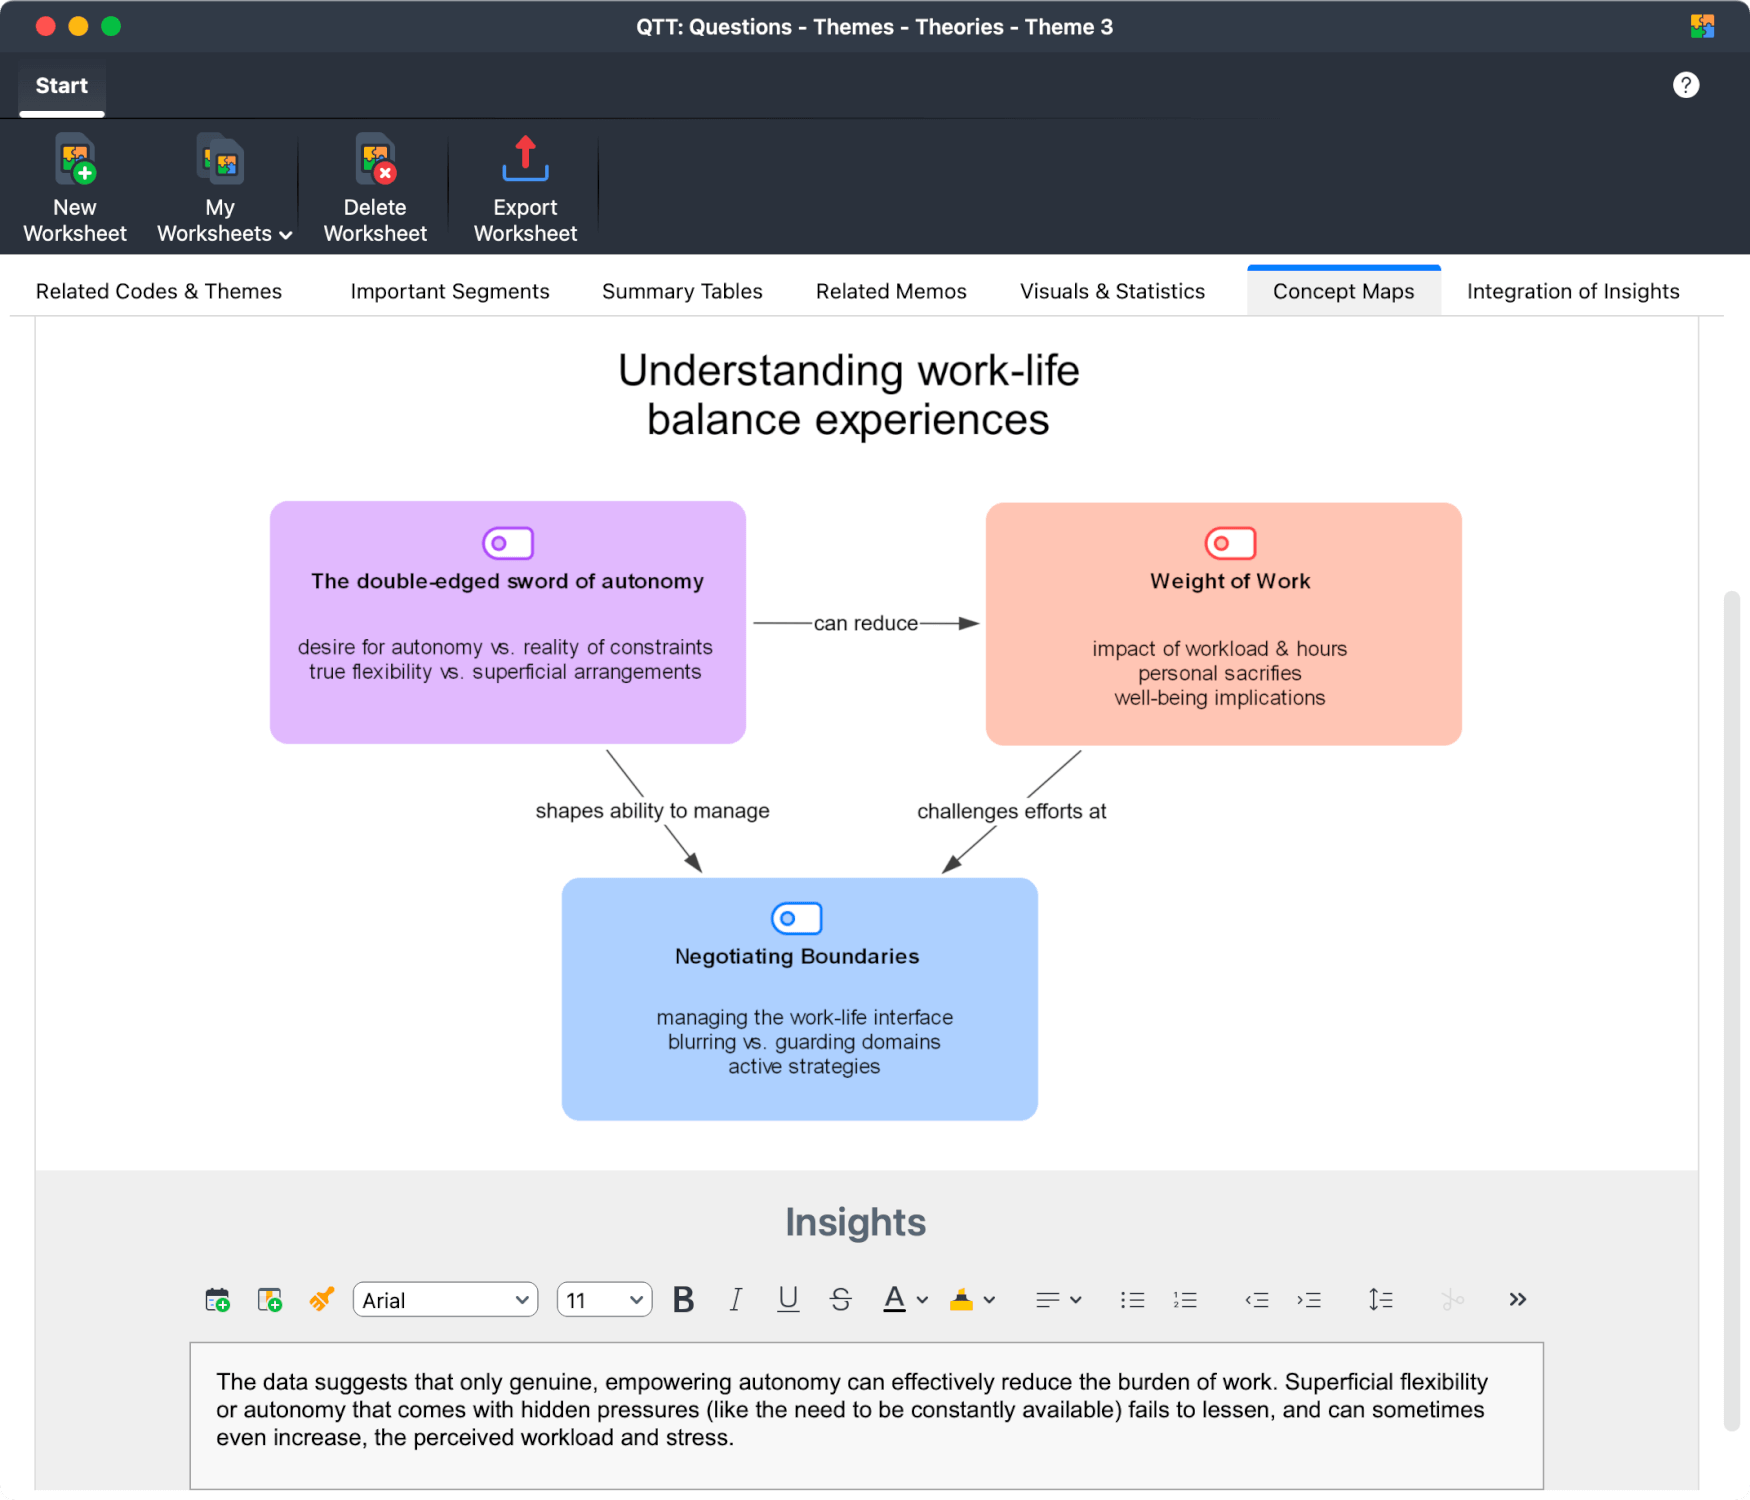
Organize your Insights with QTT Workspace
MAXQDA’s Questions-Themes-Theories (QTT) workspace serves as your bridge between analysis and your research report. In QTT, you can bring together all essential elements of your analysis: research questions, finalized themes, key memos, representative quotes, theoretical insights, and visual representations from MAXMaps. For every element you add to QTT, you can add your analytical insights, which automatically flow into an "Integration of Insights" section.
Leverage Additional Writing Support Features
Beyond QTT, MAXQDA provides several specialized tools that streamline the transition from analysis to polished research narrative, including:
- Memo Manager: Navigate to Memos > All Memos to compile all your analytical documentation in memos in a centralized view—theme definitions, methodological decisions, and theoretical reflections.
- Export Quotes Using Drag-and-Drop: You can easily include quotes from your data by dragging data segments directly from MAXQDA into your document. The software automatically adds proper source attribution, maintaining academic rigor while streamlining your workflow.
Using MAXQDA’s AI Assist to Support your Thematic Analysis
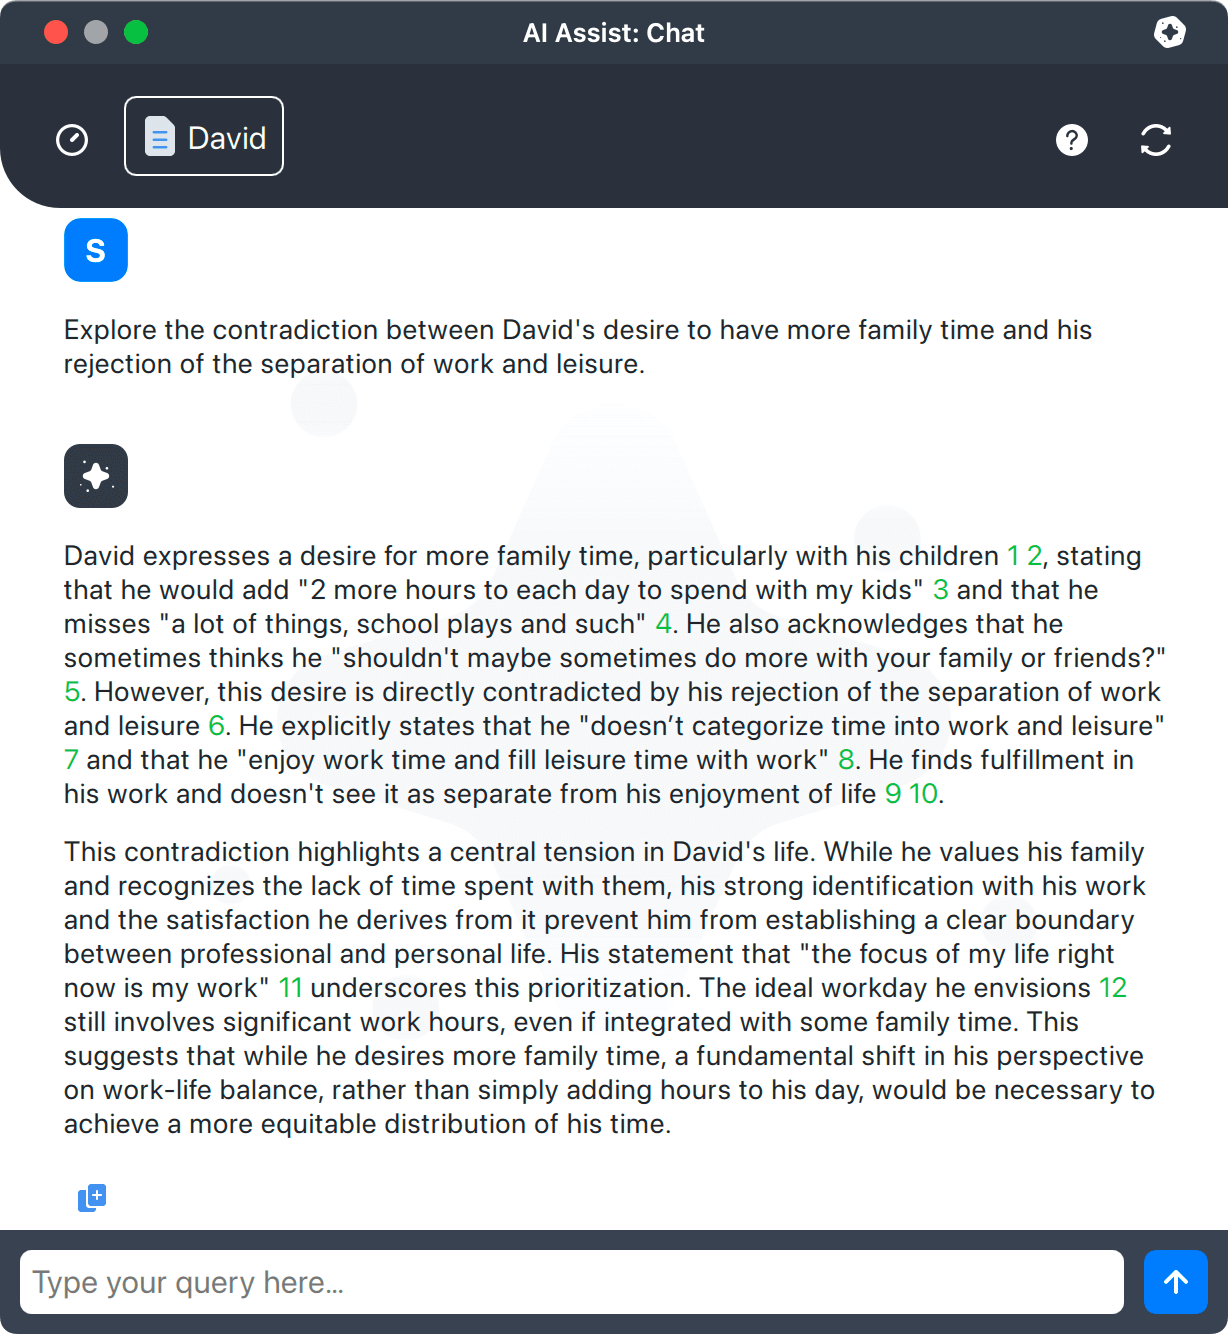
MAXQDA's add-on AI Assist serves as an analytical companion throughout your thematic analysis journey, offering targeted support that enhances rather than replaces your analytical thinking. This sophisticated tool adapts to each phase of Braun and Clarke's framework, providing contextually relevant assistance. To showcase AI Assist’s capabilities, one key feature is presented for each phase, although multiple AI functions support each phase:
- Phase 1: Familiarizing Yourself with the Dataset – Use Automatic Summarization of entire documents to rapidly get overviews per cases.
- Phase 2: Coding – Suggest New Codes for selected text segments helps you identify potential codes you might have overlooked during manual coding.
- Phase 3: Generating Initial Themes – Summarize Coded Segments provides comprehensive overviews of all data supporting potential themes, helping assess thematic coherence.
- Phase 4: Developing and Reviewing Themes – Chat with Coded Segments facilitates dialogue about patterns within relevant text data, supporting identification of overarching themes.
- Phase 5: Refining, Defining, and Naming Themes – Chat with Documents supports theme refinement by enabling targeted questioning about thematic boundaries and definitions.
- Phase 6: Write Up – Summarize All Coded Segments produces comprehensive theme summaries that serve as foundations for detailed theme descriptions in your report.
Throughout all phases, AI Assist functions as a supportive analytical partner that amplifies your interpretive capabilities while ensuring all analytical decisions remain under your control.
Final Remarks
MAXQDA transforms Thematic Analysis from a potentially overwhelming manual process into a systematic and well-organized experience. The software supports every phase of Braun and Clarke's framework, from initial data exploration through final report writing, while maintaining the rigor and depth in the complete process.
This guide covered key MAXQDA features for Thematic Analysis, though many more tools are available to enhance your analytical work. Some features, like Memos and the Code System, support you throughout the entire process, while others work best at specific phases. For example, Creative Coding excels in Phase 3 for initial theme generation, while QTT proves essential for organizing and writing in Phase 6.
The key to success lies in adapting MAXQDA's tools to fit your research needs and analytical style. Combine features that support your thinking, customize your workflow, and use AI Assist where it helps rather than replaces your analytical judgment.
MAXQDA serves as a powerful research partner that enhances your analytical capabilities while ensuring your insights, interpretations, and contributions remain authentically yours.
References
- Boyatzis, R. E. (1998). Transforming qualitative information: Thematic analysis and code development. SAGE. https://us.sagepub.com/en-us/nam/transforming-qualitative-information/book7714
- Braun, V., & Clarke, V. (2006). Using thematic analysis in psychology. Qualitative Research in Psychology, 3(2), 77–101. https://doi.org/10.1191/1478088706qp063oa
- Braun, V., & Clarke, V. (2014). Thematic Analysis. In T. Teo (Ed.), Encyclopedia of Critical Psychology. Springer New York. https://doi.org/10.1007/978-1-4614-5583-7
- Braun, V., & Clarke, V. (2022). Thematic analysis: A practical guide to understanding and doing. SAGE. https://us.sagepub.com/en-us/nam/thematic-analysis/book248481
- Braun, V., Clarke, V., Hayfield, N., & Terry, G. (2019). Thematic Analysis. In P. Liamputtong (Ed.), Handbook of Research Methods in Health Social Sciences (pp. 843–860). Springer Singapore. https://doi.org/10.1007/978-981-10-5251-4_103
- Guest, G., MacQueen, K. M., & Namey, E. E. (2012). Applied thematic analysis. SAGE.
- Terry, G., & Hayfield, N. (2021). Essentials of thematic analysis. American Psychological Association. https://www.apa.org/pubs/books/essentials-of-thematic-analysis
About the author

Dr. Stefan Rädiker is a consultant and trainer for research methods, specializing in computer- and AI-assisted analysis of qualitative and mixed-methods data. He has (co-)authored several textbooks, guides, and book chapters on data analysis, including Qualitative Content Analysis (with Udo Kuckartz) and Doing Grounded Theory with MAXQDA. With more than 25 years of experience using MAXQDA, he supports the MAXQDA team with his methodological expertise in the further development of the software. www.methoden-expertise.de
Additional Resources for your Thematic Analysis
Video Tutorial by Christina Silver (40 min.)
In this video, Christina Silver walks you through the six steps of (reflexive) Thematic Analysis.
Book: Essentials of Thematic Analysis Video Tutorial by Gareth Terry and Nikki Hayfield
Looking for a short introduction to Thematic Analysis? We recommend checking out this 100-page book by Gareth Terry and Nikki Hayfield.

