With MAXQDA 2020, analyzing Twitter data is faster and easier than ever before! Learn how to analyze Twitter data here in 6 easy steps:
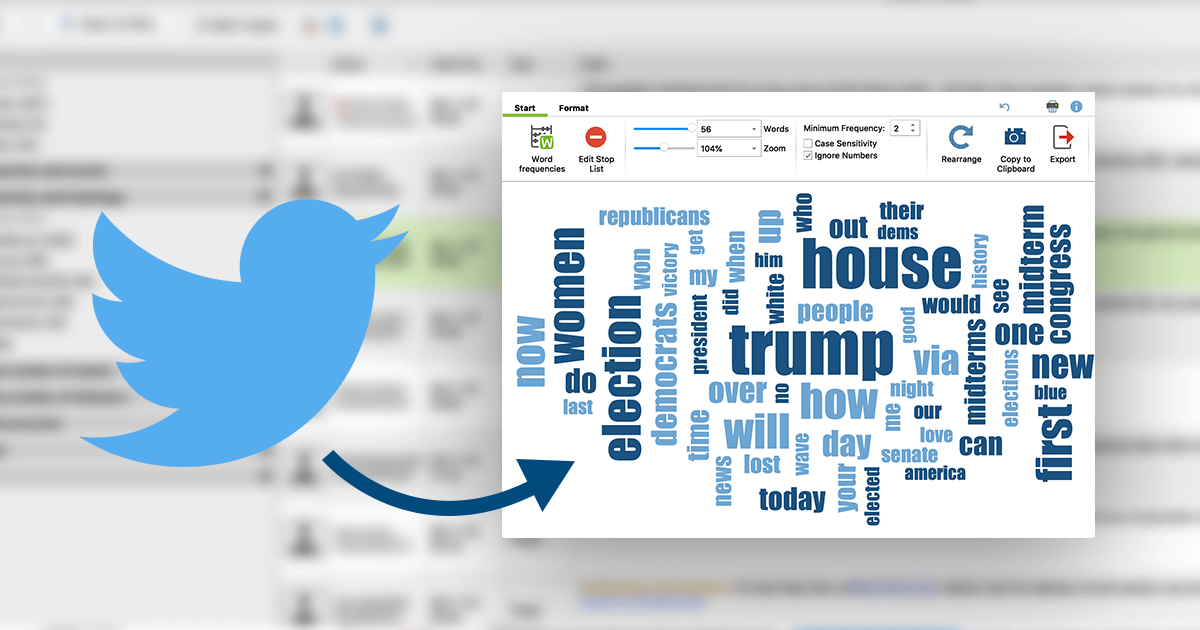
What is Social Media Analysis?
To say that social media plays an important role in modern society and academia would be an understatement. In view of its relevance, prevalence, and its sheer volume, social media data is now being analyzed for both scientific and practical purposes by researchers in every field. Not just academic researchers analyze social trends and behavior. Businesses use Social Media Analytics to gather objective feedback on their performance and marketing returns, and even politicians use social media as a way to get the word out on issues that are important to them, as well as to poll public opinion in real time.
Today’s internet users spend more than 20% of their online time on social media platforms, making ‘social networking’ the most popular online activity today. Twitter alone counts more than 300 million active users
However, alongside its many advantages, one of the biggest challenges in analyzing Twitter data (or any social media data) is that it’s a relatively new area of study with inhomogeneous data and therefore lacks the concrete theoretical background that can be found for other types of data. Twitter user profiles also contain quantitative data (frequency of tweets, number of likes, etc.) as well as qualitative data (the content of posts, the meaning behind hashtags, etc.) and require a mixed methods approach.
These challenges could, however, be overcome in the future by researchers using interdisciplinary approaches to develop new theories that can evolve and adapt to the rapidly changing social media data they are studying. Luckily, MAXQDA has a range of tools for both qualitative and quantitative data analysis, which helps make social media research much simpler.
Stages of Social Media Analysis
The process of social media analysis is commonly divided into three stages: capture – understand – present. These stages follow one another, but the analysis process is not linear and is better imagined as a circle:
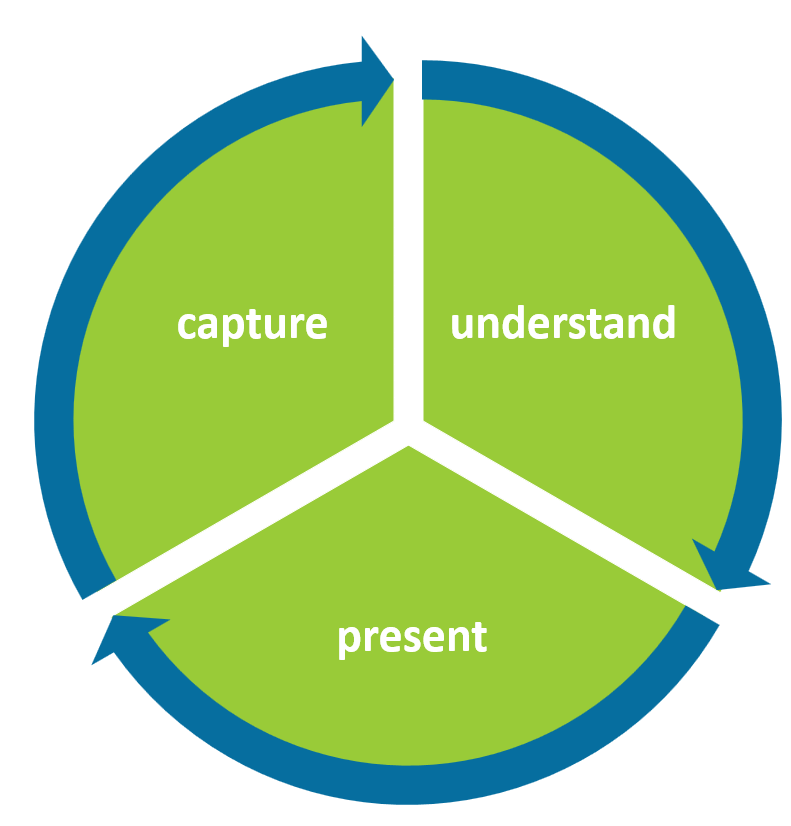 Stages of social media analysis
In order to take a closer look at each stage of the process, let’s analyze some current Twitter data with MAXQDA. In this example research project, we will analyze tweets related to a generally important topic that – in times where many are working from home– is as relevant as ever: work/life balance. Specifically, we have imported tweets with the hashtag #WorkLifeBalance from the last 7 days.
How to Analyze Twitter Data with MAXQDA 2020
MAXQDA has a wide range of features to help you analyze Twitter data that will be useful during all three stages of the social media analysis process. The analysis steps during each stage will, of course, depend on the methodological framework and analysis goals in your project, but we suggest starting with this approach if you are new to social media analysis:
- Importing the Twitter data into MAXQDA,
- autocoding the tweets to create categories,
- filtering the categorized data based on relevancy,
- analyzing the sentiments of the imported tweets,
- presenting the frequency of relevant aspects, and
- visualizing the results for presentation.
Capture
In this initial stage, the researcher must identify what data on the social media platform is relevant to the research project. Remember: social media analysis is a cyclic process and not all the data gathered during this initial stage will be useful during the subsequent stages. Conversely, the following stages may reveal that not enough data was collected during the ‘capture’ phase, which may require the researcher to continue to broaden their data collection efforts.
Needless to say, make sure that you have a Twitter account and MAXQDA license before you start. If you don’t already have a MAXQDA license, download the 14-day free trial to get started:
Step 1: Importing Twitter Data into MAXQDA
MAXQDA’s Twitter Analysis feature allows you to quickly and easily import Twitter data directly into your project. First, open your MAXQDA project (or create a new one) and click the Twitter logo under the Import tab. Link your project to Twitter using the Connect to Twitter function in the dialogue window that opens.
You can then search for relevant tweets with the help of the ‘complex search’ fields. Fill out the fields to filter the results according to specific words, phrases, hashtags, authors, language etc., and create a search query specific to the information you are interested in for your research project.
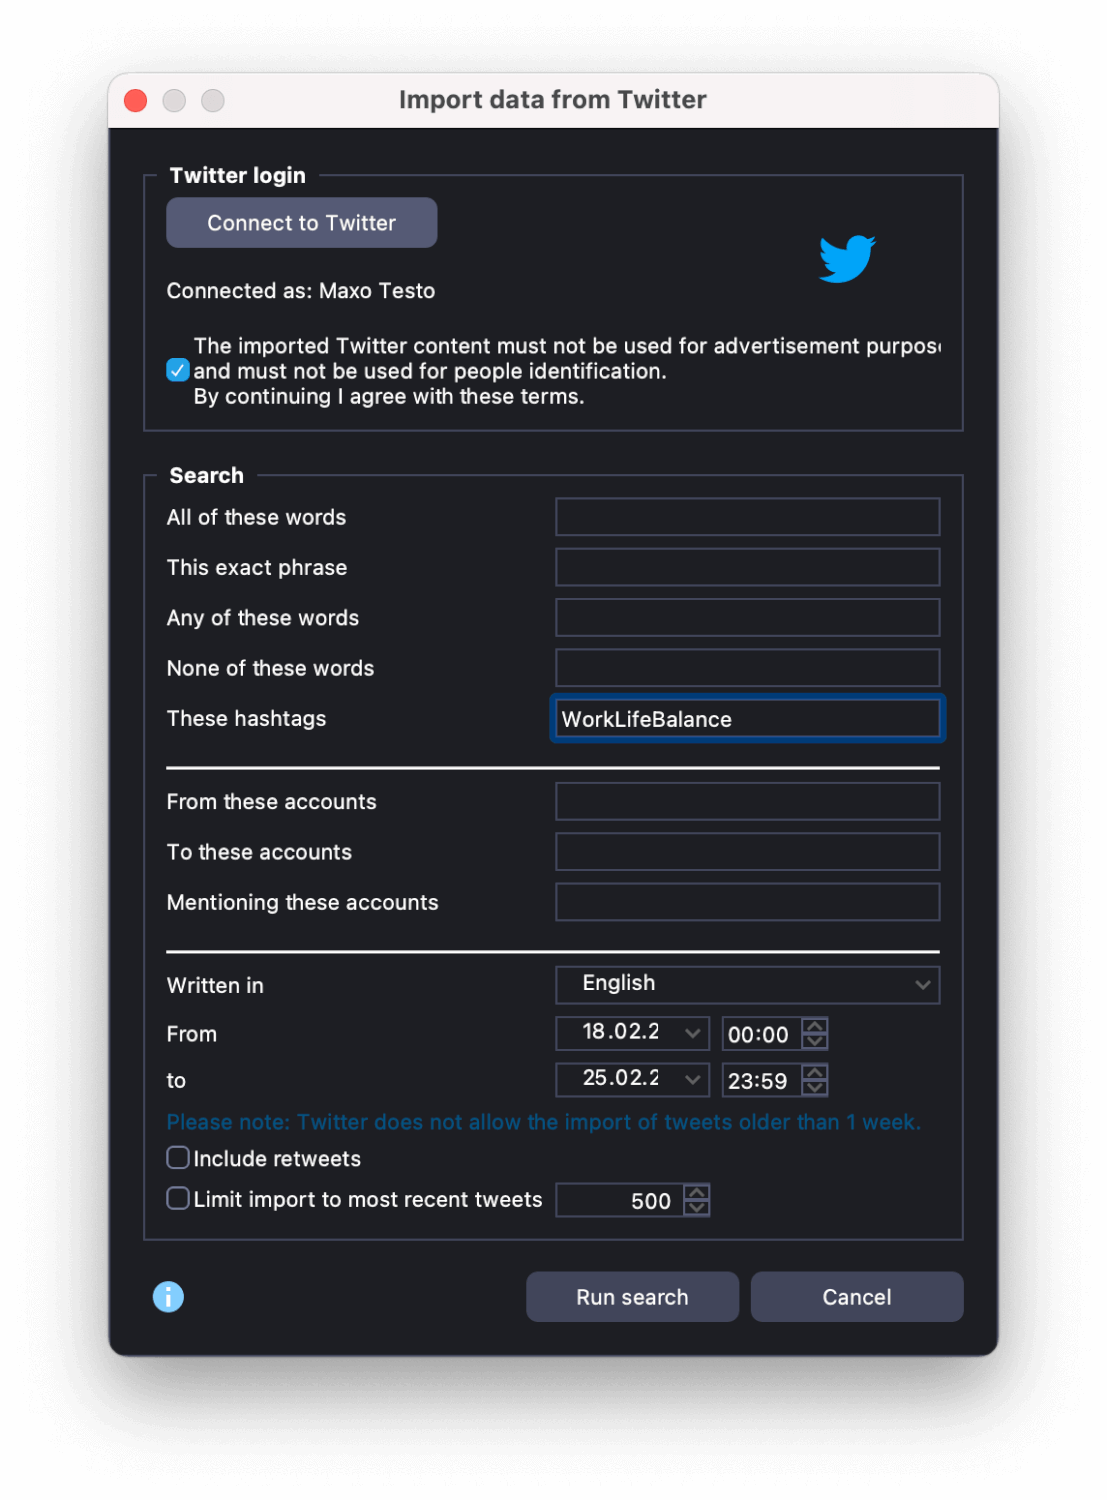 Specify your Twitter data import
Let’s enter the hashtag ‘#WorkLifeBalance’ and set the timeframe to the last 7 days before we click Run search to narrow down the parameters. Next, we will see a preview window with the first 100 search results. If you are happy with the search parameters based on the preview, you can start importing the data. Up to 10,000 tweets can now be imported into your project. A new document group will automatically be created in the “Document System” window, in which a table document is generated for every 1,000 tweets:
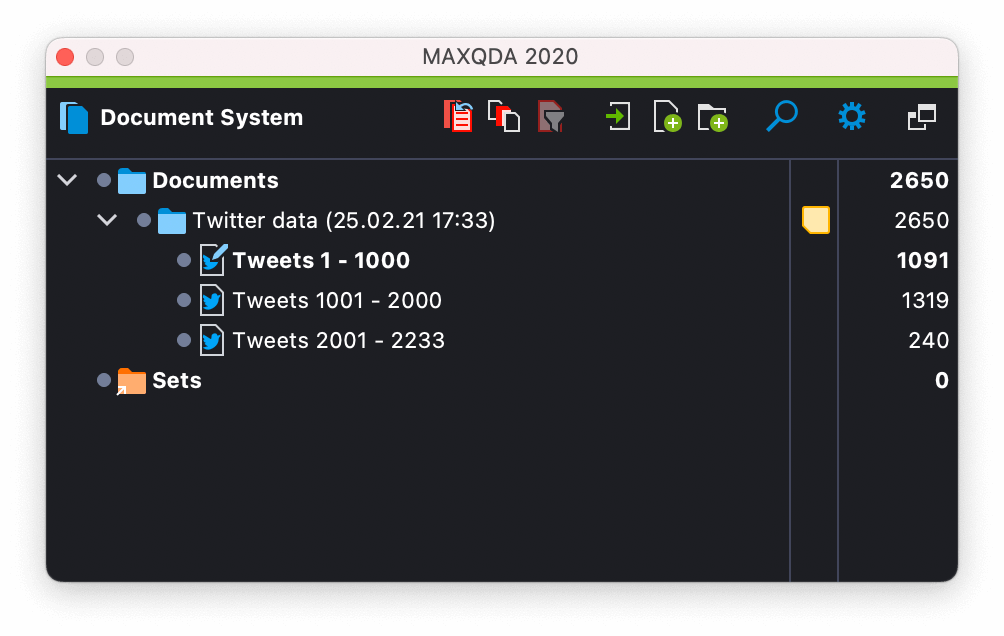 Imported Twitter data in the MAXQDA Document System
When you double-click on the new document, the Twitter data will be displayed in the “Document Browser” window in table format. This table contains all necessary information about the tweet itself (date, language, hashtags, etc.) and about the author of the tweet (name, location, time zone, number of followers, etc.). Now that all the data has been imported, we can begin analyzing your data, simple as that!
Understand
The next step in the social media analysis process after you have imported the data is to begin making sense of the data based on your research project’s methodological approach. In the ‘understand’ stage, the researcher must select the data that is most relevant to the research question and begin analyzing it.
If you are new to qualitative data analysis (QDA) or would like a refresher about coding your data before learning about autocoding, click here to get a quick overview of the QDA process with MAXQDA:
How to Analyze Qualitative Data with MAXQDA
Step 2: Autocode the imported tweets
As Twitter imports are often very large, we suggest beginning with autocoding to make the first step in your analysis process faster. No need to go through thousands of tweets and code them by hand!
MAXQDA allows you to automatically code Twitter data of up to 100 authors and 100 hashtags at a time. You can start in the dialog window that will automatically appear after you have completed your Twitter data import. Later, you can always open the autocode function via Analysis > Twitter > Autocode Twitter data.
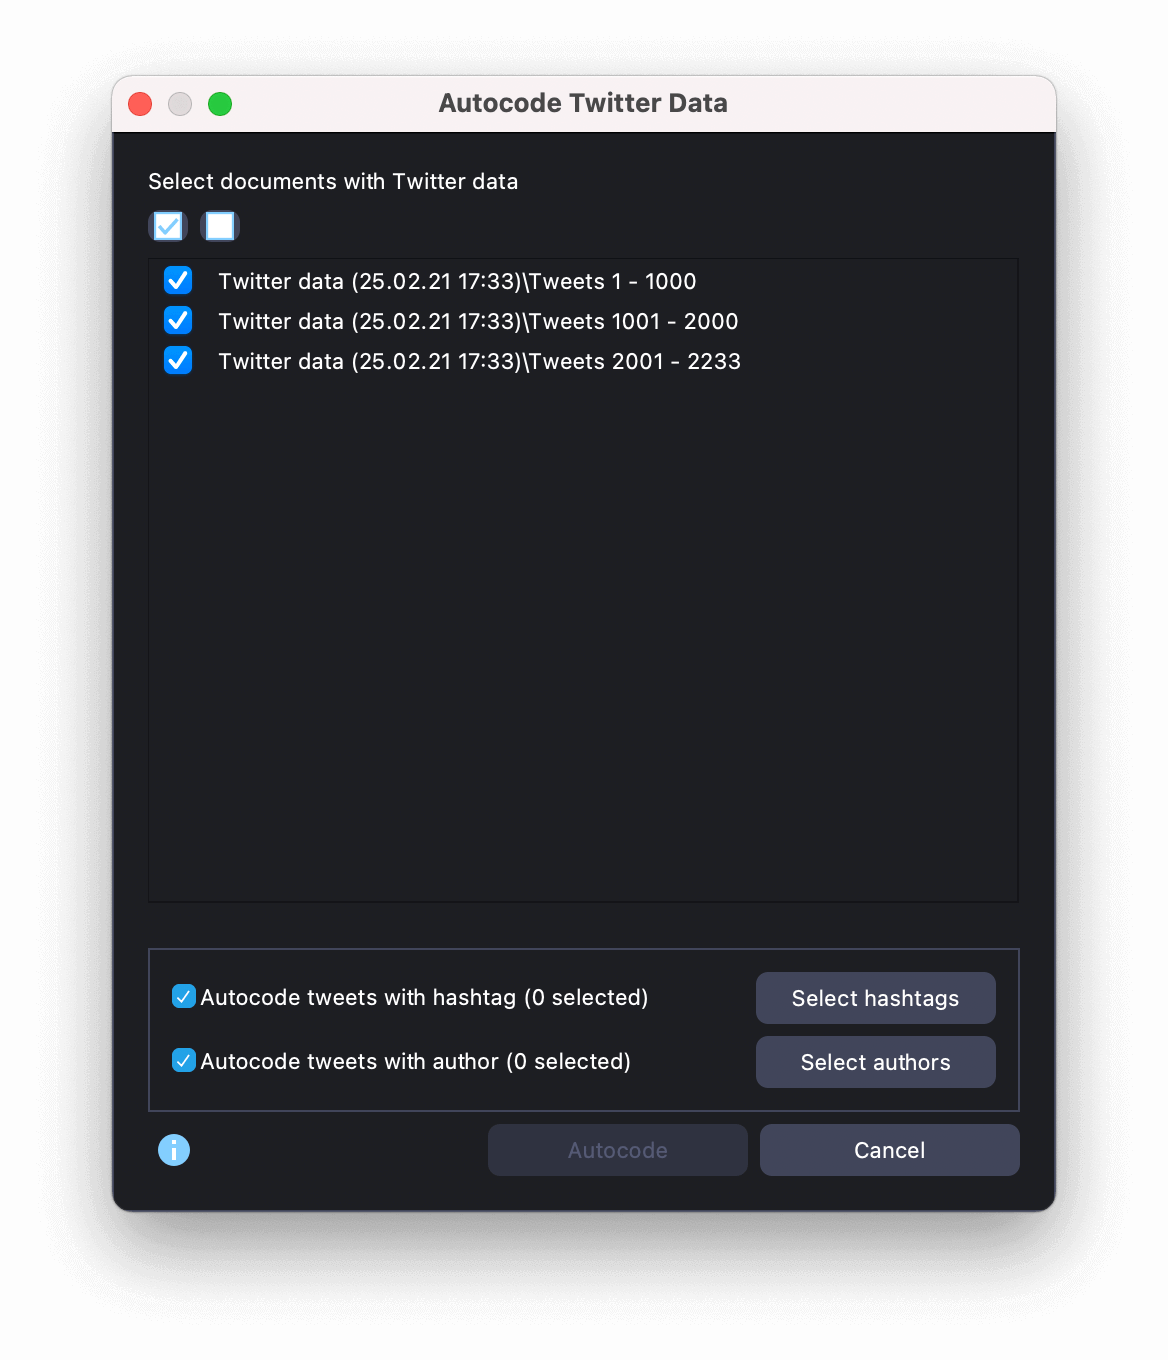 Autocode large volumes of data to save time
First, choose the documents you want to autocode, followed by the hashtags, authors, and/or other information you wish to code. In this example, we will autocode both the hashtags and author names. When you click on the filter categories, a new dialog window with the hashtags or author names will open, from which you can choose the relevant ones. After that, simply return to the autocode window where you can start the process by clicking the Autocode button.
A new code called “Autocode Twitter data” with the date will be inserted at the top of the Code System with the subcodes ‘Tweet hashtag’ and ‘Tweet author’ automatically sorted in descending order of frequency. Once your data has been imported and autocoded, it will be displayed in your MAXQDA project as shown here:
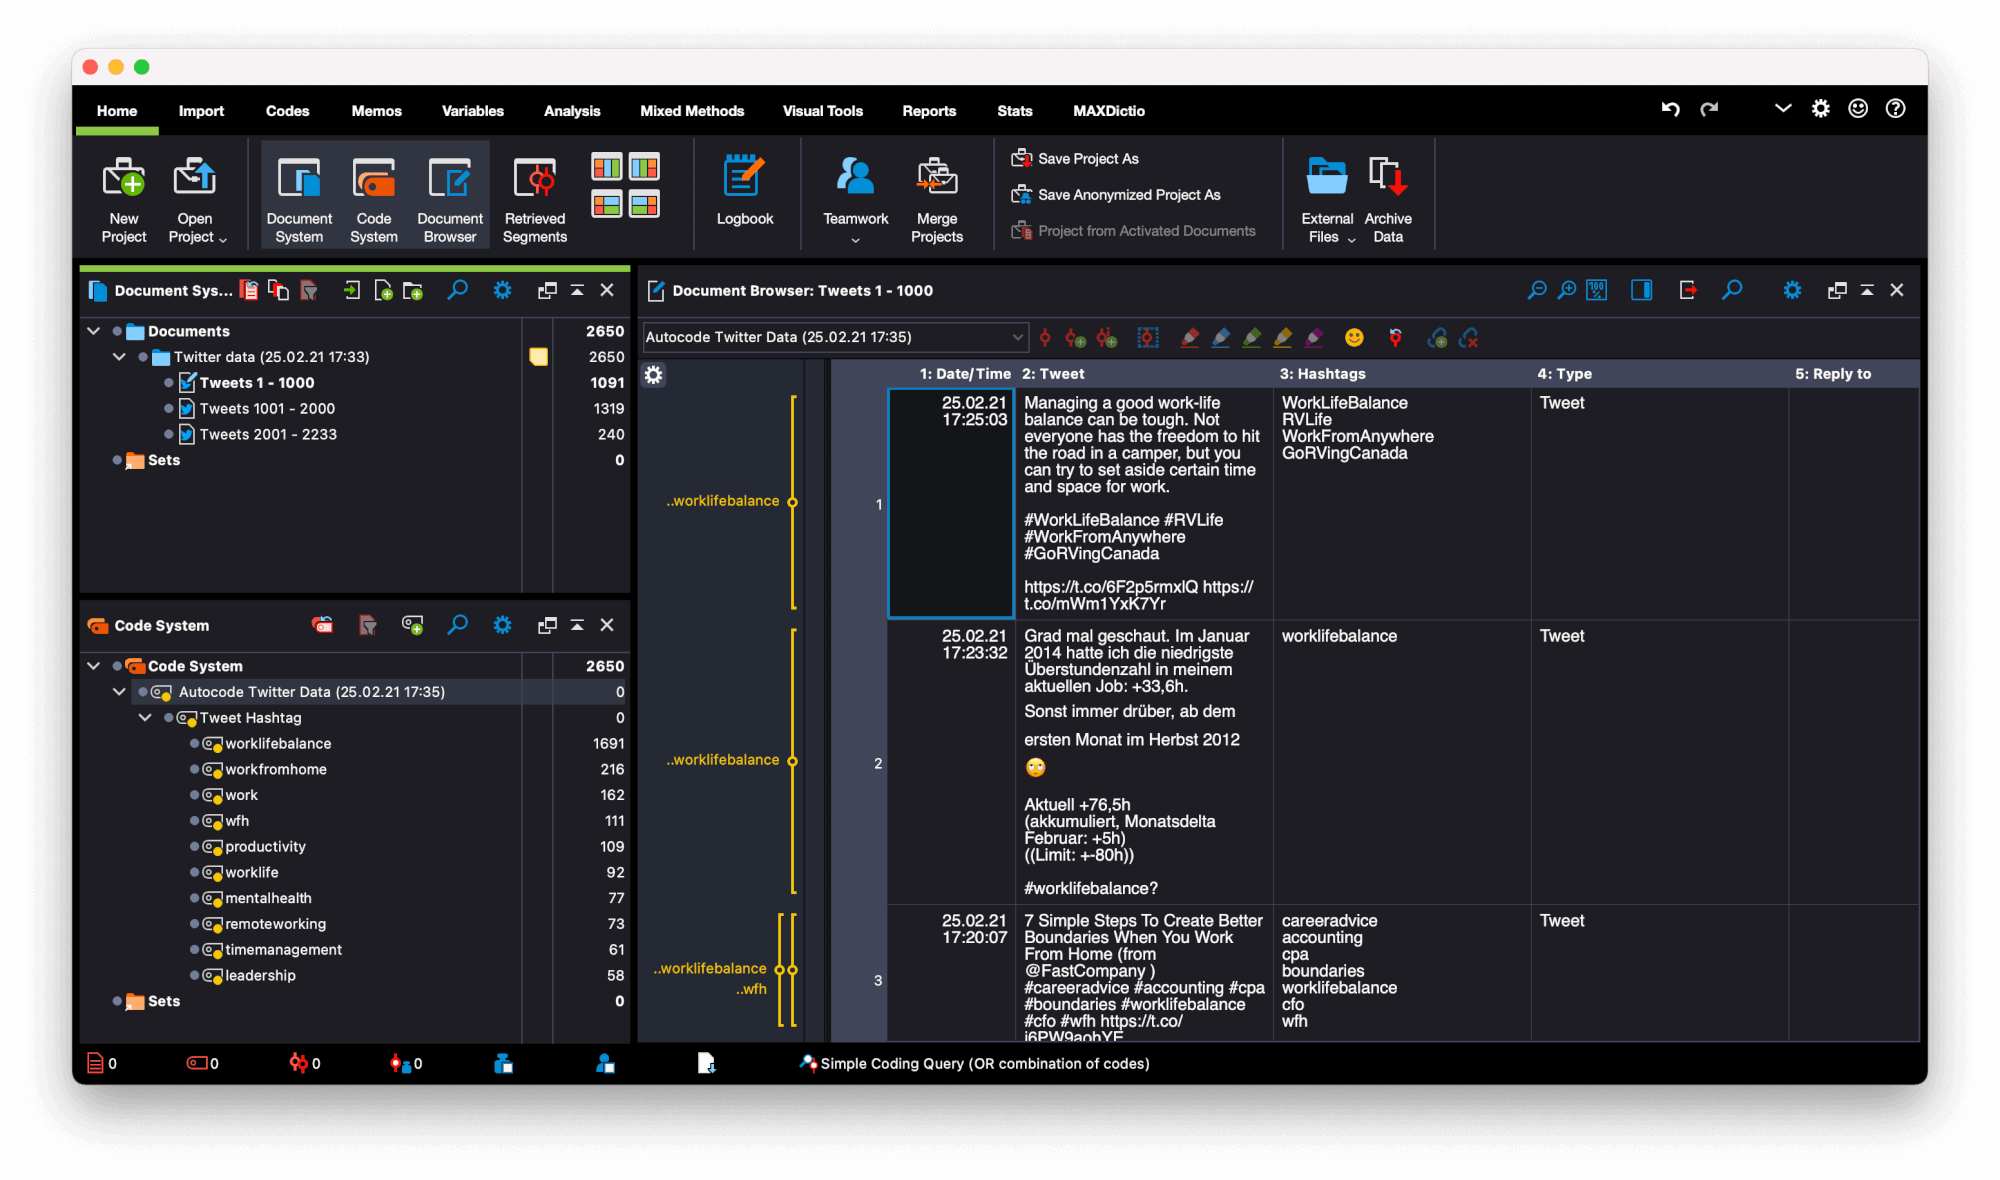 Imported and autocoded Twitter data
In our example project, you can now clearly see the new codes on the bottom left and the autocoded tweets on the right. All tweets have been assigned the code “WorkLifeBalance” as that was the subject of our import, but you can also see several more specific issues being discussed on Twitter, such as “workfromhome”, “productivity”, and “mentalhealth”. So far, the very first conclusion we can draw from the data is that there are several topics related to work/life balance.
Step 3: Filter the data
Now that your Twitter data has been imported and coded automatically, you can fully integrate it into your research project. You can analyze it with the same approaches as your other research data, such as text documents, interview transcripts, photos, videos, etc. And you can also always go back and retrieve tweets with a particular hashtag or written by a particular author using the MAXQDA’s Simple Coding Query function.
The next step is to filter your Twitter data using the Twitter analysis display. Go to Analysis > Twitter > Analyze Tweets and select all twitter documents that you would like to include in your analysis. The results will be shown in a table, which includes information about the author and the tweet (for example, how often the tweet has been retweeted or the number of likes a tweet received). In the filter panel on the left, you can then arrange the tweets according to the most frequently used words, hashtags, languages, sources, and so on.
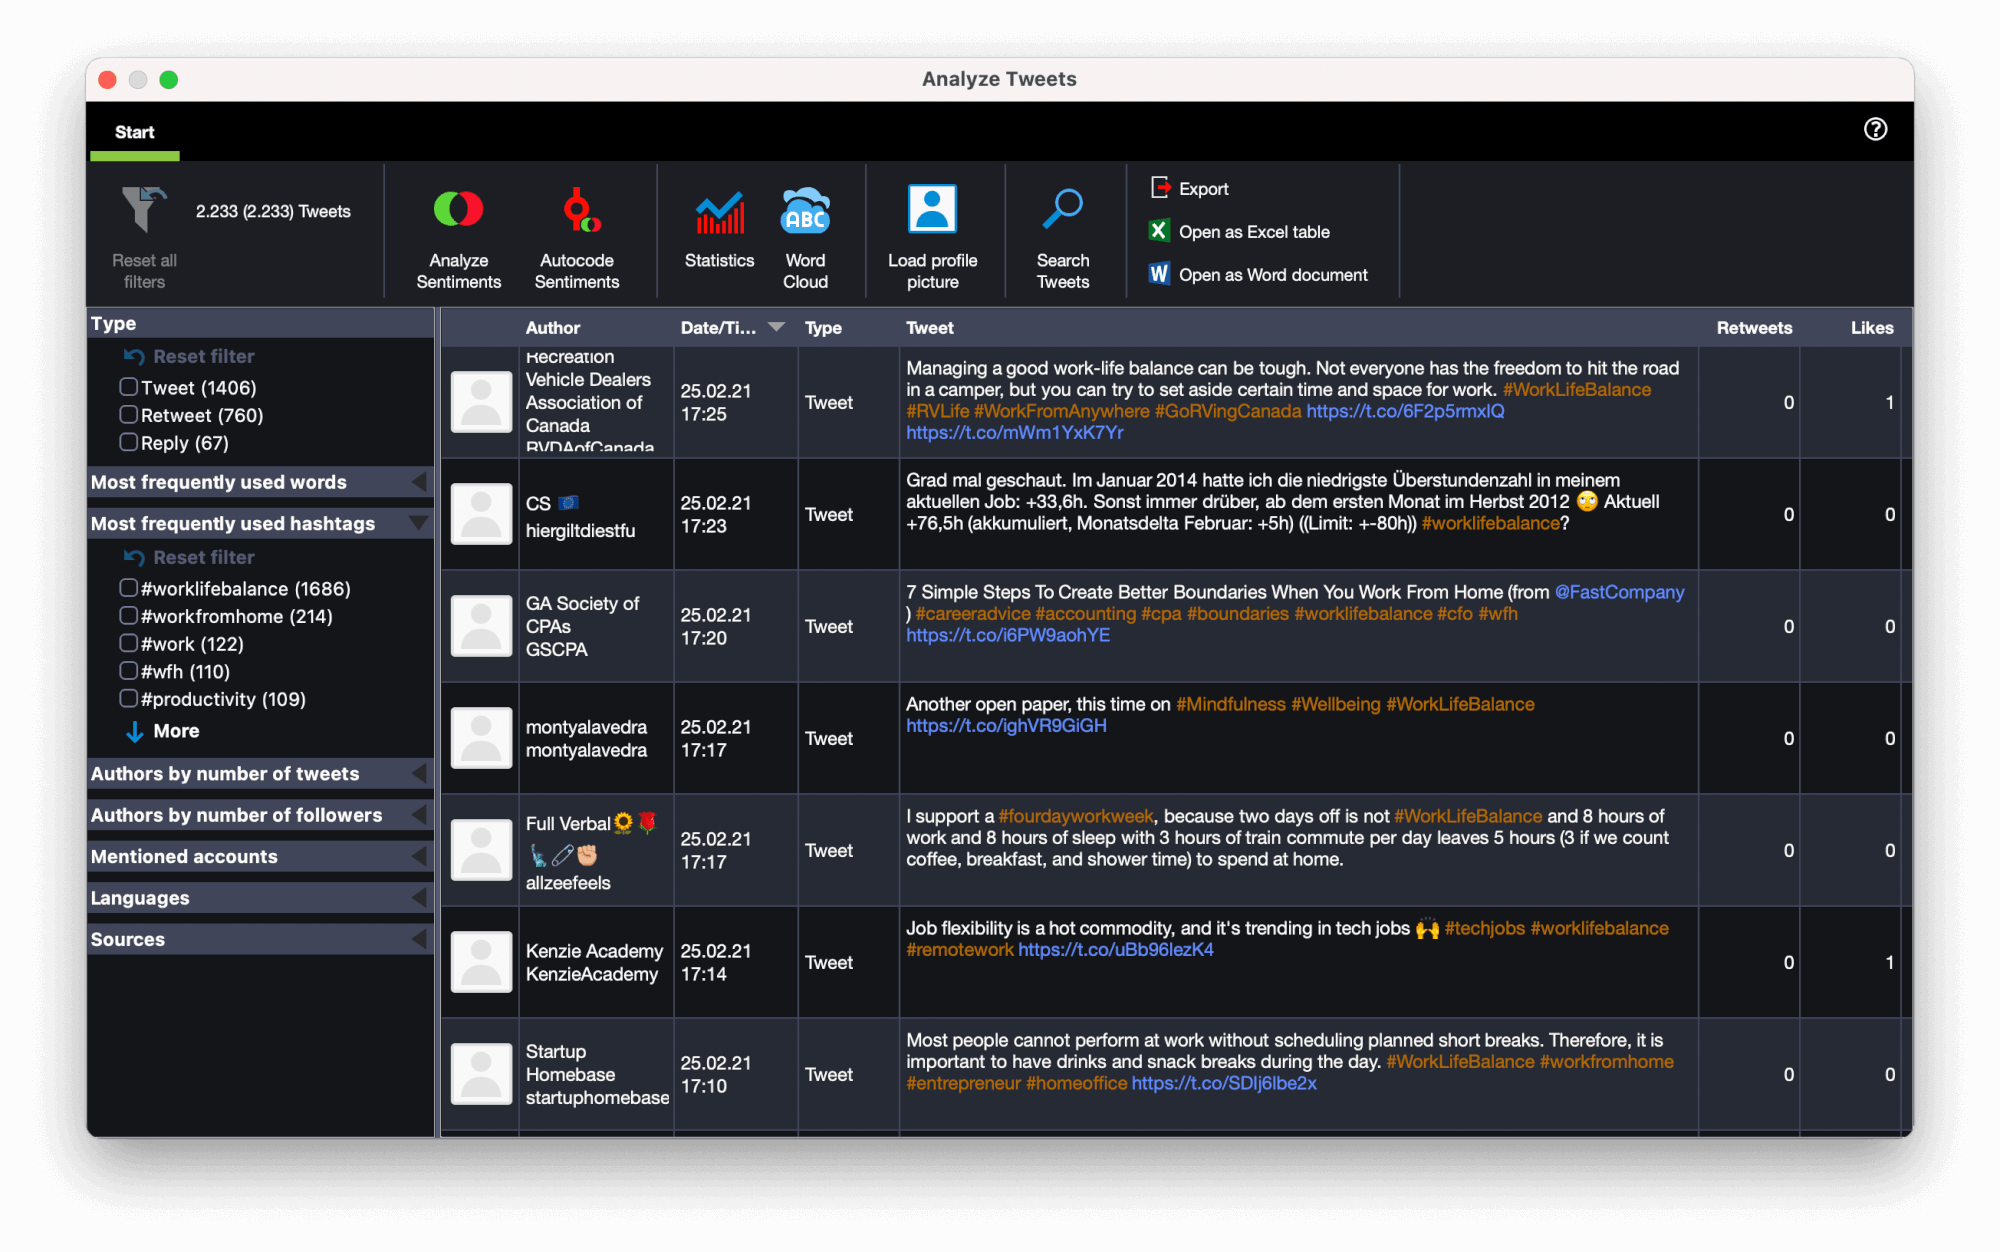 Filter the data with an easy-to-use table format tool
This filtering tool allows you to explore the early observations made after autocoding the data. For example, we can now test the prevalence of a certain topic during a specific news cycle by sorting the data based on date and time. We can also analyze the relatability of a certain topic by filtering the data based on a certain hashtag and then sorting the table in descending order of number of retweets. Or, we can test which topics are the most controversial and most likely to start debate by filtering the most frequently used words and then sorting the table based on the number of replies. The possibilities are endless and can be entirely adapted to fit your research question. The choice is yours!
Step 4: Analyze sentiments for your Twitter data
With MAXQDA 2020.4.0 you can also perform Sentiment Analysis for Twitter data! Using Sentiment Analysis it’s possible to quickly perceive the emotions, feelings, and opinions of individuals towards a certain issue. The core idea is to classify a large amount of unstructured data based on sentiment polarity and categorize it as positive, negative, or neutral.
By autocoding Twitter data with sentiment labels, you can rapidly get a sense of public sentiment toward a particular research topic, like work/life balance. After running the sentiment analysis, a sentiment label and score is applied to each tweet.
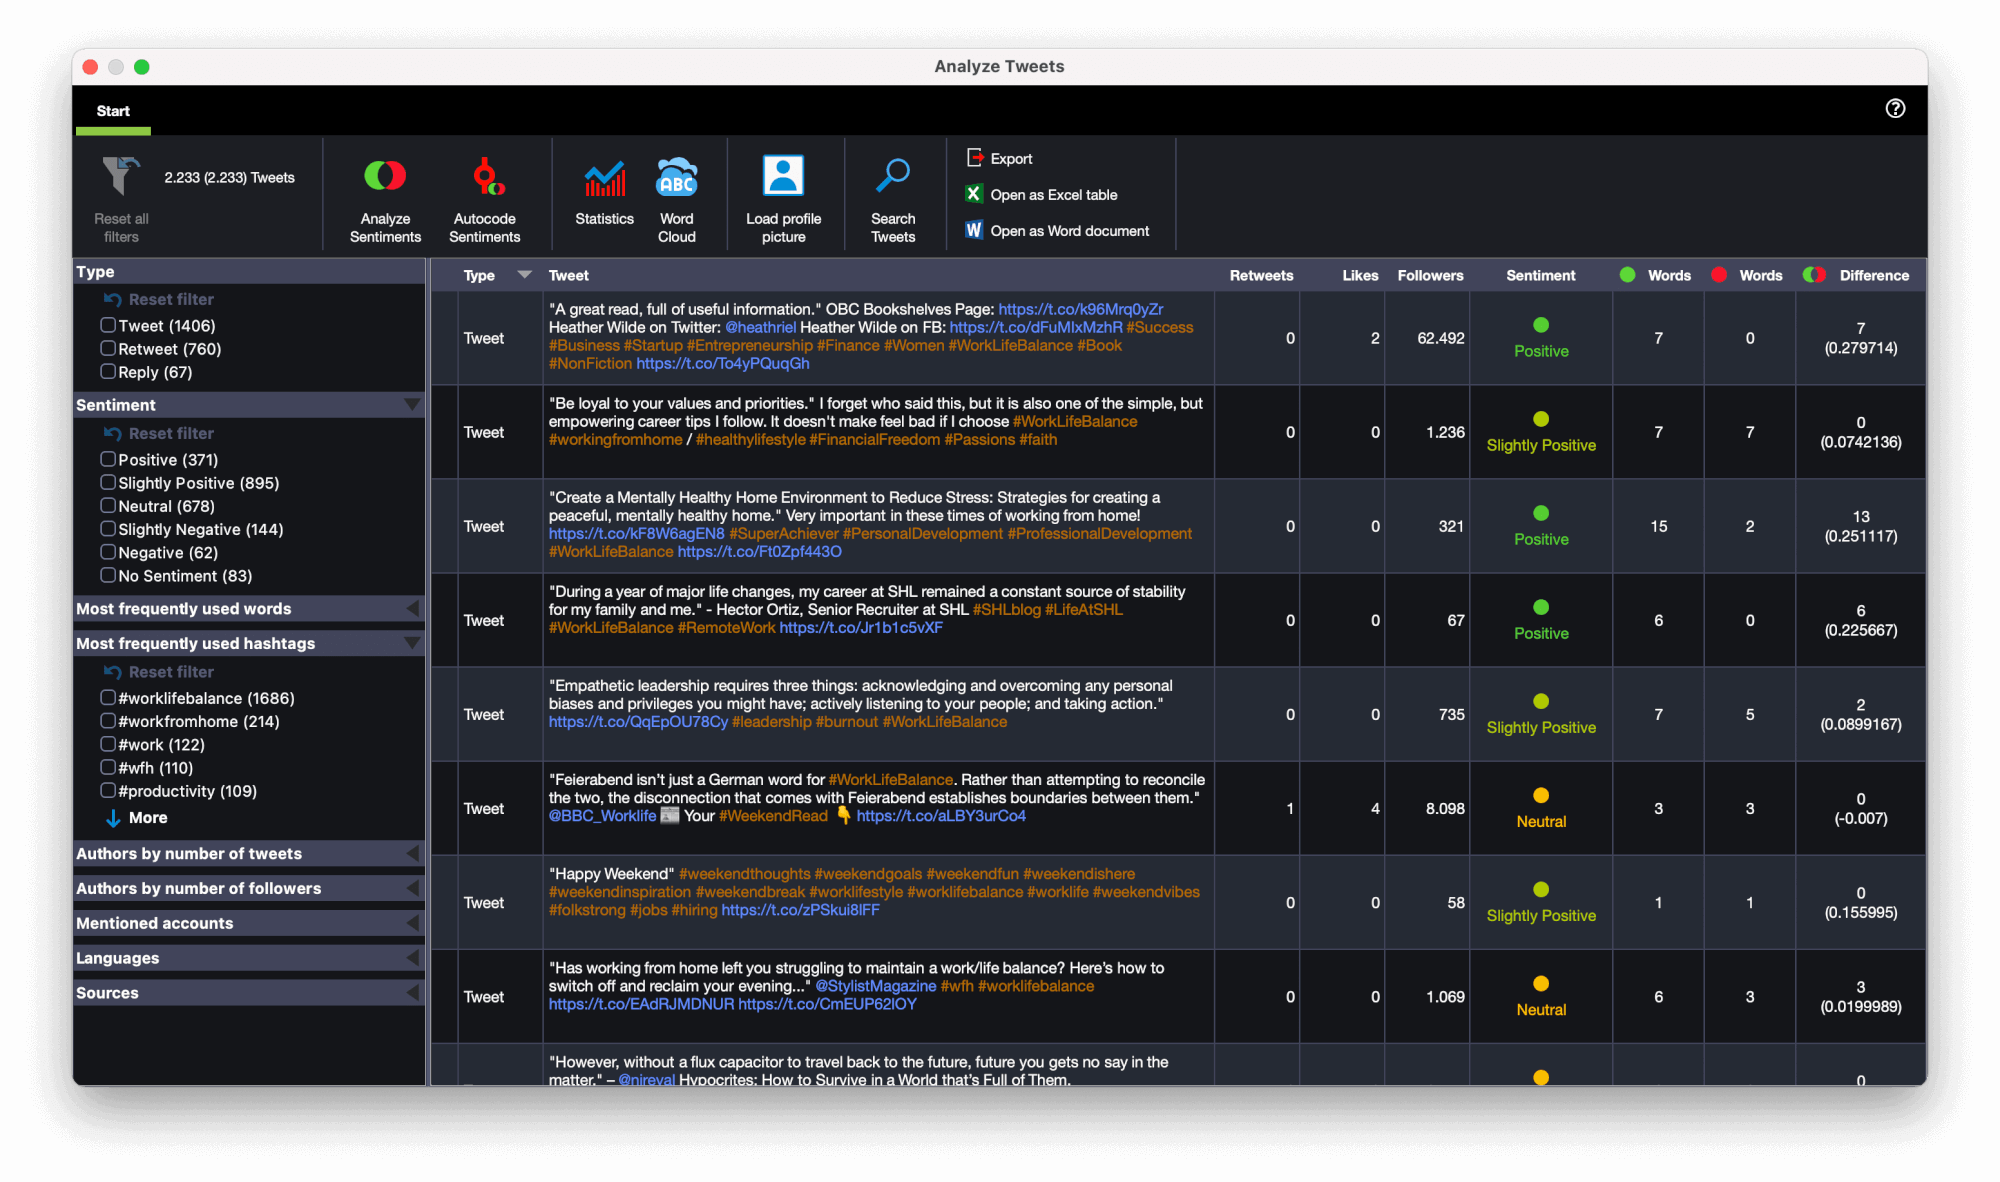 Label your Twitter data with sentiment labels
Present
In the final ‘present’ stage of the social media analysis process, the researcher summarises their evaluation and visualizes the results of their data gathering and analysis efforts during the two previous stages. If you are new to MAXQDA’s visual tools, have a look at this video to get an overview of the numerous options at your disposal:
Step 5: Create frequency tables and charts
Once you have filtered the tweets according to the criteria relevant to your research project, MAXQDA offers you numerous exciting options to present your research results. To display the results of the analysis tests we looked at in the last stage, we will now create frequency tables and charts. Click the chart icon in the top toolbar to request a frequency analysis.
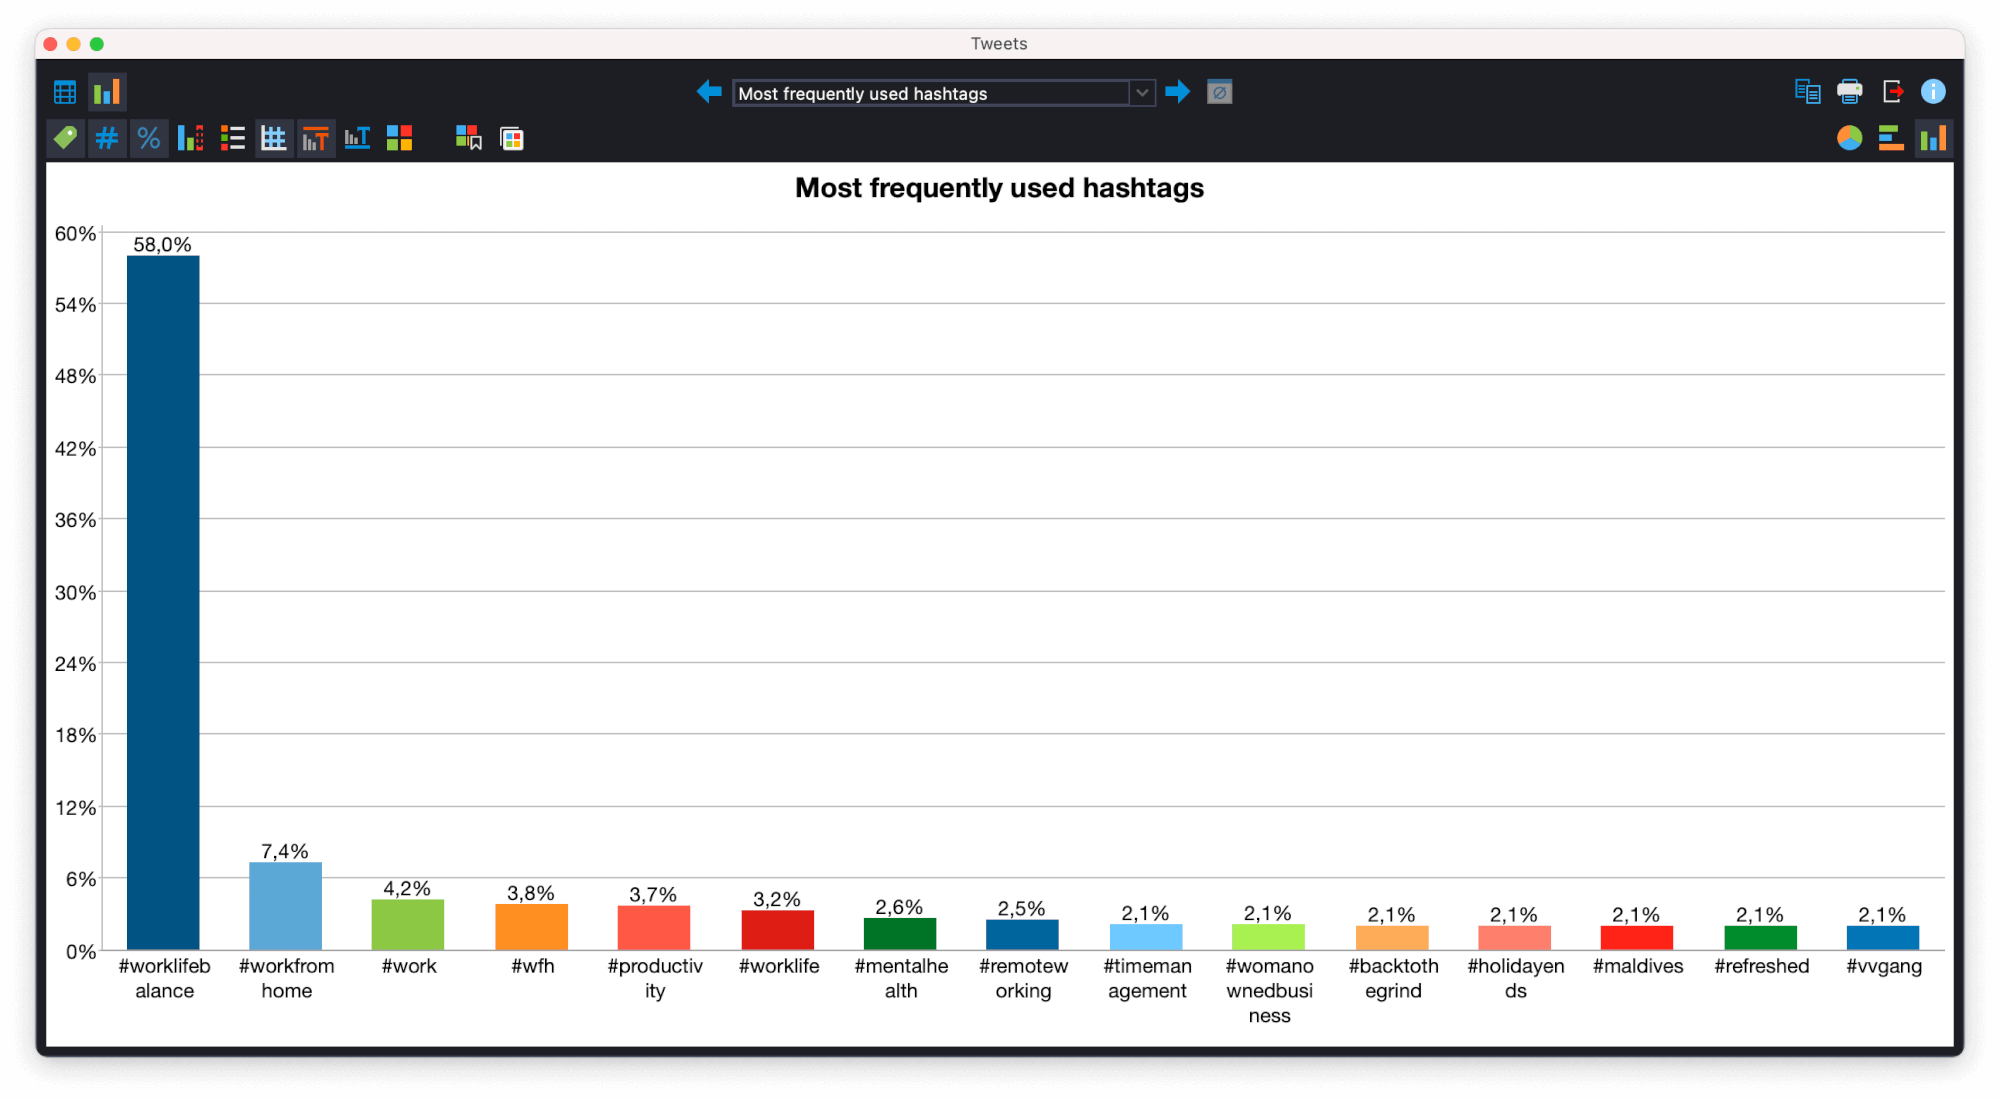 Create frequency tables and charts directly in MAXQDA
The arrows at the top of the window enable you to switch between individual frequency tables. And if you click on the chart symbol in the upper left corner, the table will be displayed as a bar chart (vertical or horizontal) or a pie chart. This is a great visual tool for your research and makes it easy to analyze Twitter data! You can now clearly display the different aspects we looked at earlier without having to import the numbers by hand to create charts and graphs with other software programs such as Excel or PowerPoint. Simply export your results as images or PDFs and include them directly into your report!
Step 6: Visualize the Data with Word Clouds
With MAXQDA, you can now create word clouds with a custom-made design to suit the style of your presentation. A star, a pyramid, or even a Twitter bird, the possibilities in MAXQDA’s Word Cloud feature are endless! You can use the predefined layouts and color schemes or add your own to get deeper insights into your Twitter data and present them in an interesting way.
This visual tool is the perfect next step in word frequency analyses, especially when working with large volumes of data, such as the thousands of tweets we are looking at in this example. Simply click on MAXQDA’s Word Cloud icon to create a word cloud like the following:
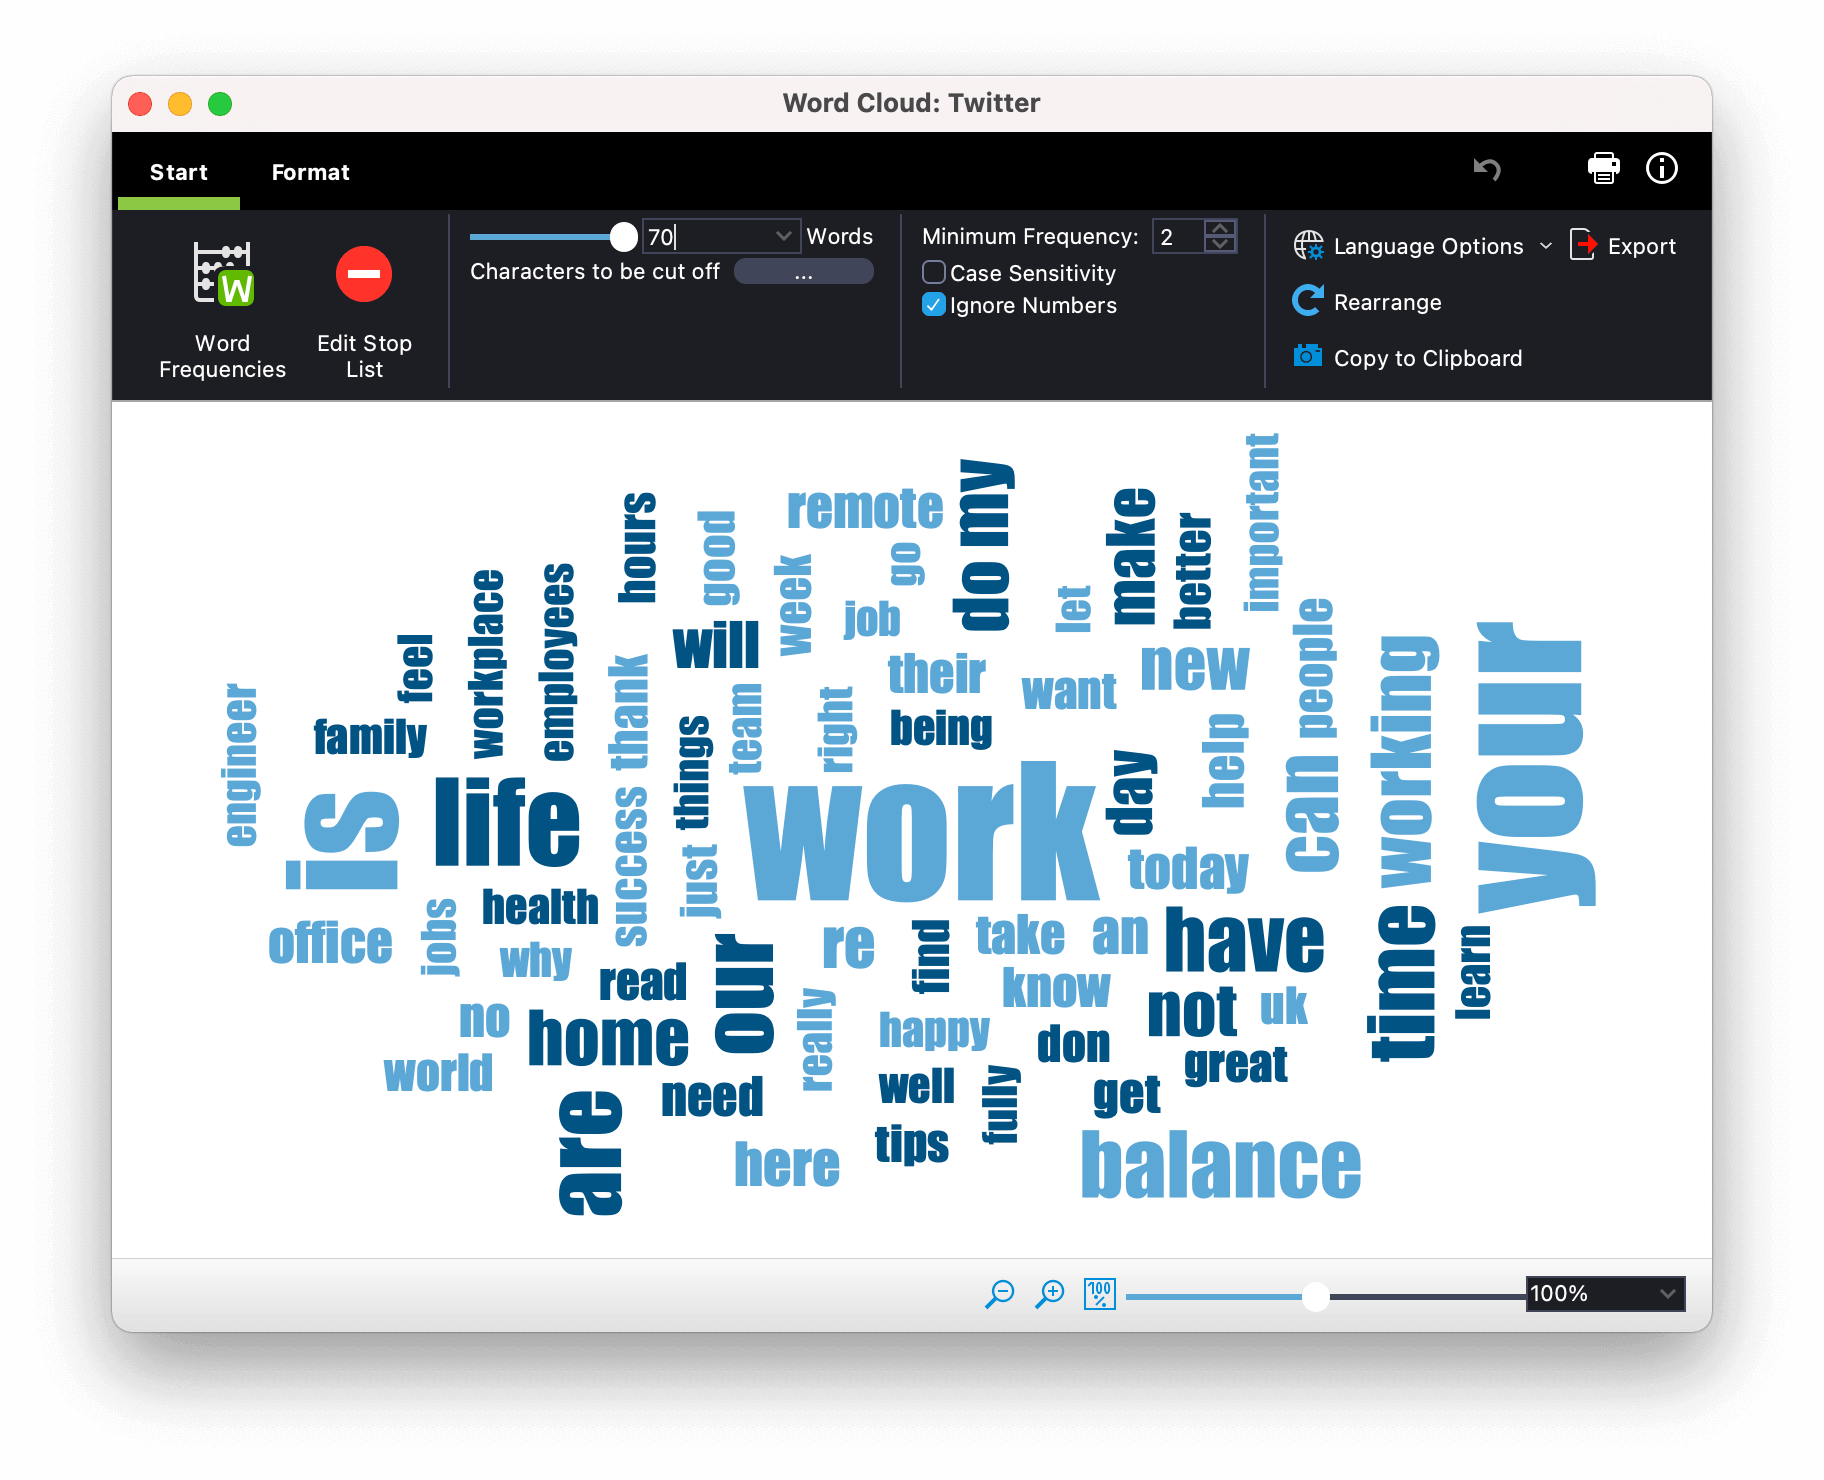 Visualize frequency in a creative and eye-catching way
If you want to exclude insignificant words or words bearing very little meaning from your word cloud, you can create a ‘stop list’ of these words. The easiest way to do this is to open the Word frequencies function in the Start tab. In the displayed table, double-click on the green icon in front of a specific word – and it will be put in the stop list and it will not appear in word clouds anymore.
Well, here we are! We got an impression of public feeling regarding work/life balance in six steps. You can now easily and clearly present the results of your analysis. What about your work/life balance? Tweet at us @verbisoftware or use the hashtag #MAXQDA to let us know about your Twitter data analysis!
Additional resources for social media research with MAXQDA:
Helpful Literature:
- Fan, W., Gordon, M. D.: The Power of Social Media Analytics. Association for Computing Machinery. In: Communications of the Acm. June 01, 2014.
- Segerberg, A., Bennett, W. L.: Social Media and the Organization of Collective Action: Using Twitter to Explore the Ecologies of Two Climate Change Protests. In: The Communication Review. Washington, 2011.
- Ganis, M., Kohirkar, A.: Social media Analytics: Techniques and insights for Extracting Business Value Out of Social Media. In: IBM Press. New York, 2015.
- Zeng, D., Chen, H., Lusch, R., Li, S. H.: Social media analytics and intelligence. In: IEEE Intelligent Systems, 25(6). 2010.
Editor’s note: this post has been updated from its original version published in October 2018.


