Guest post by Raka Sen.
This fieldwork diary entry builds upon my article about Indexing by Typology and Coding for Variables with MAXQDA. Since I last wrote, there was a Cyclone in my fieldsite in early November 2019. After wrapping up my coursework for the semester I headed out to the Sundarbans for a couple of weeks to collect post-Cyclone data and check in with my interlocutors.
As I mentioned, before this, my research had been collected and used retrospective data to understand the ways that 2009 Cyclone Aila was a catalyst for increased salinity intrusion in the Sundarbans. This winter, it was a very intense experience to see some of my findings come alive off the page, like seeing how much work the cleanup process was every single day.
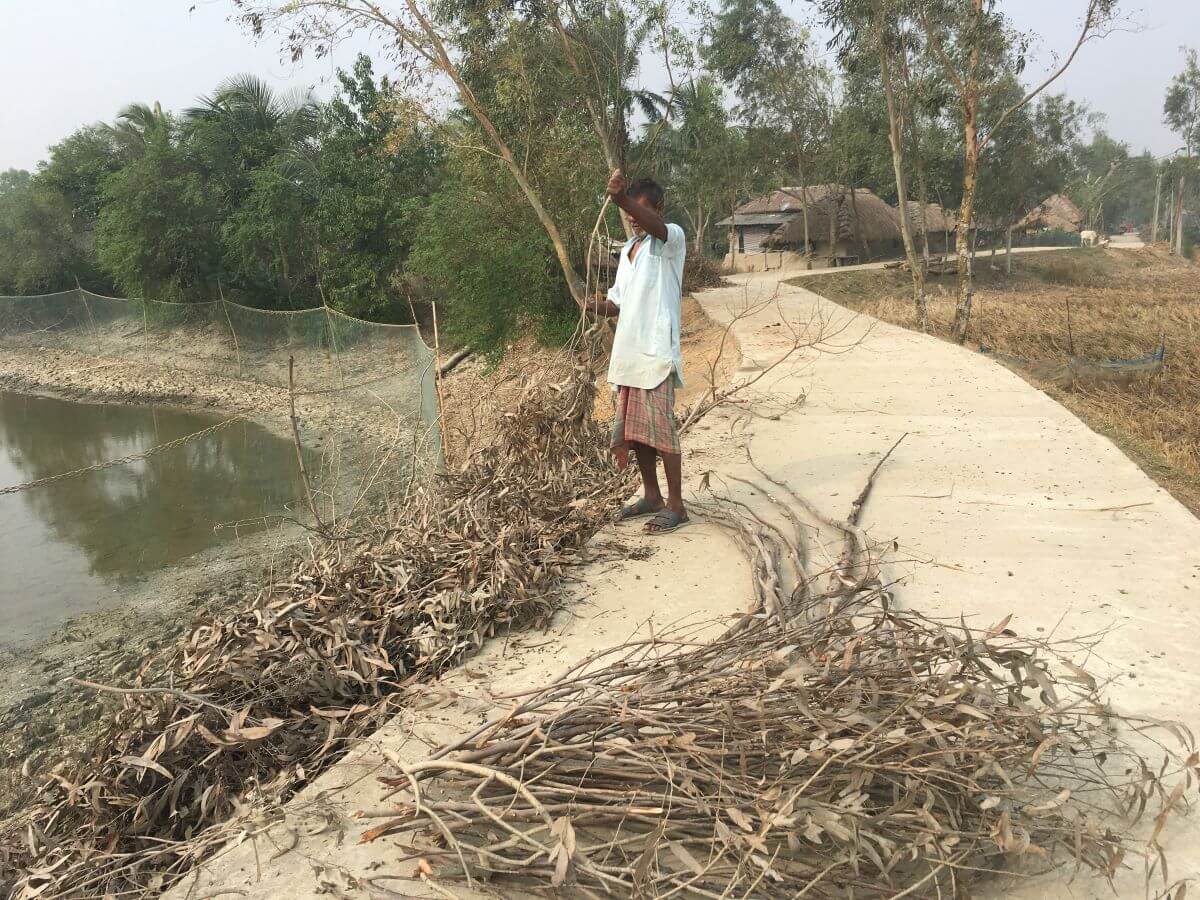
Post-cyclone cleanup process
The photo above is an example of how much work the post-cyclone cleanup process is. This man has been cutting up piles of fallen branches every day since the storm and still has a ways to go to clean up his land. He shared with me that after he cuts the branches, he places them on an embankment to be swept away by the tides. But that if he did not do this work, then his plants would not grow back the next year.
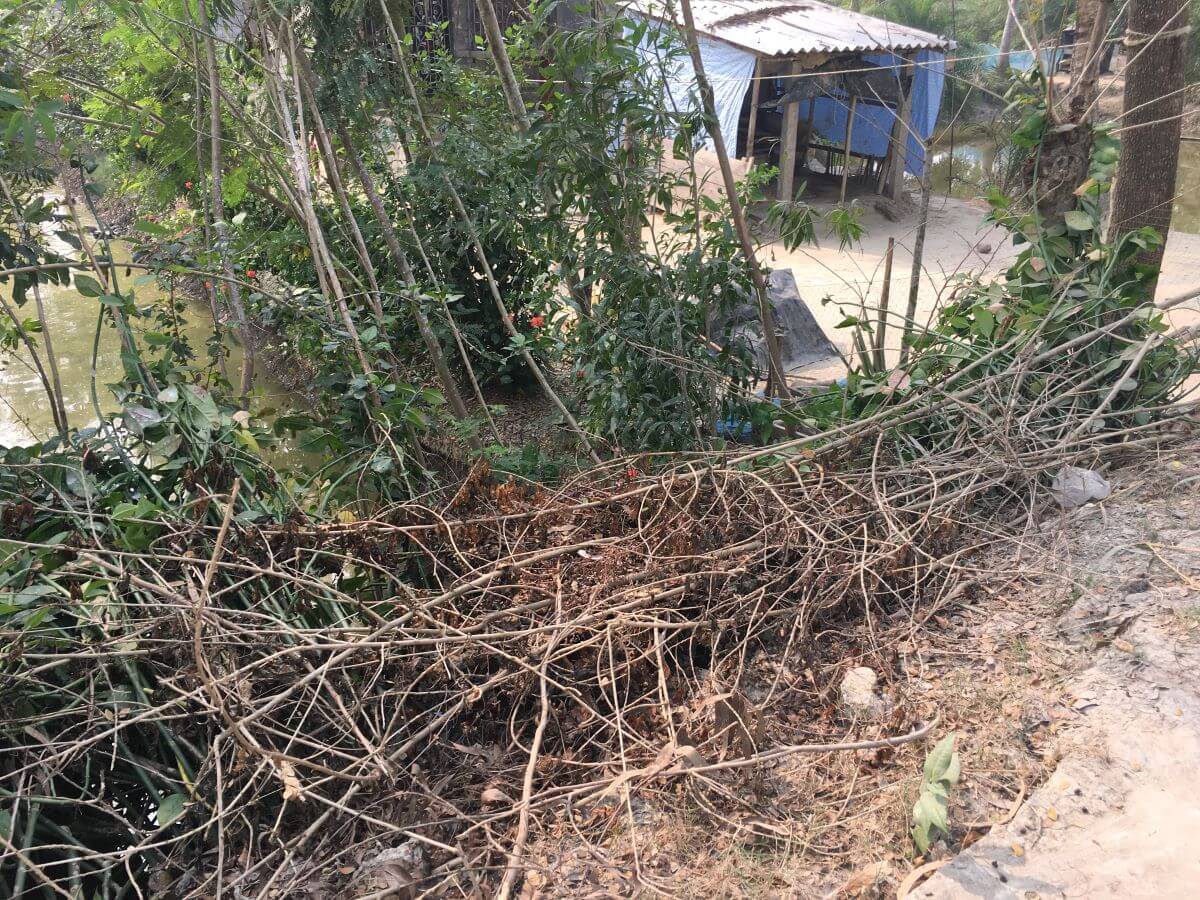
What the land would look like the villagers did not remove the branches
The next photo is an example of what his land would look like if he did not do the work to remove the branches. If left in this state, the remaining vegetation would die. This vegetation provides refuge from the everyday heat/weather and also provides protection during storms.
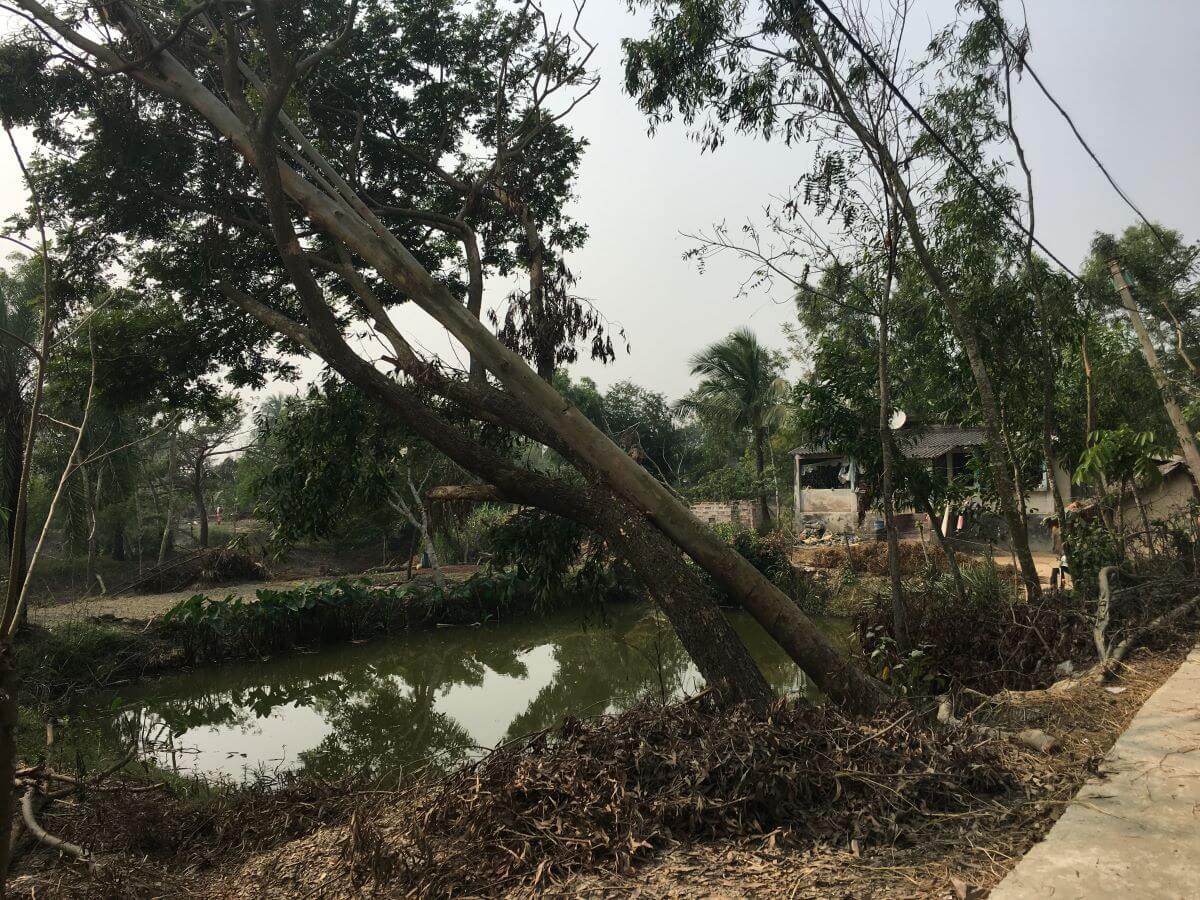
Many trees need to be cut down after a cyclone
Trees like the one shown in the photo above are a conundrum; they cannot be propped back up so decisions have to be made on whether to leave them be or cut them down. When 2009 Cyclone Aila hit, many of my interviewees noted that there were no longer any large trees and therefore the heat of summer and cold of winter were both more intense. Now, 11 years after Aila, trees like this are the largest around and are credited with providing this refuge.
The worst part of the storm though was how much of the rice crop was ruined. Rice is a staple of the everyday diet in the Sundarbans. And many people will need to completely rebuild their homes.
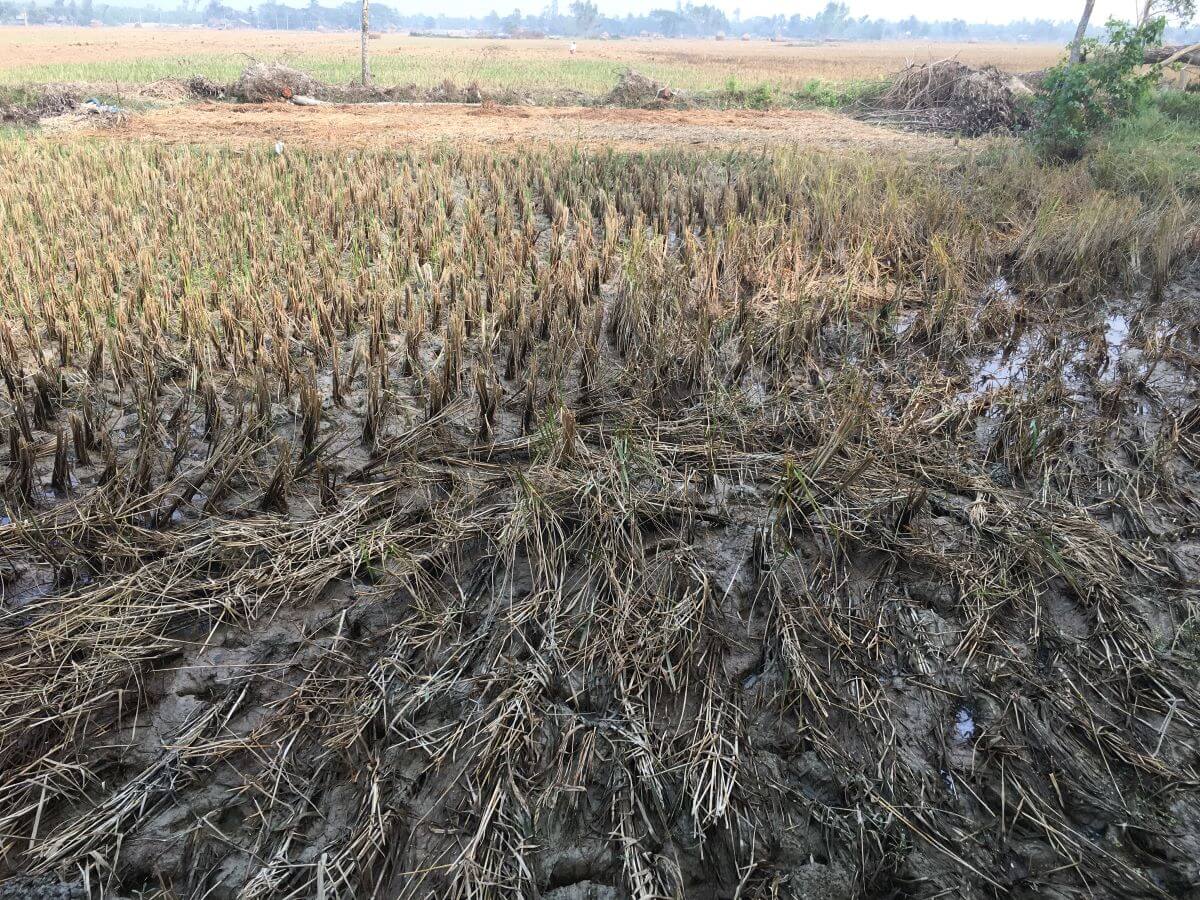
Ruined rice crops
The below photo shows what the damage to a home may look like. Because of the dynamic landscape settlements in the Sundarbans are purposely and traditionally not built to last so instead, its people have become experts in quickly building homes out of their surrounding elements.
But, there is a season where homes are typically built, it is the season before the hottest months. The underlying logic being that the hot months will ‘bake’ the mud homes into a hardened brick-like structure. Homes in the Sundarbans are usually made of mud. These types of homes can be built rather quickly and are usually built during the spring to give the mud the summer to harden enough to weather the winter and rainy months.
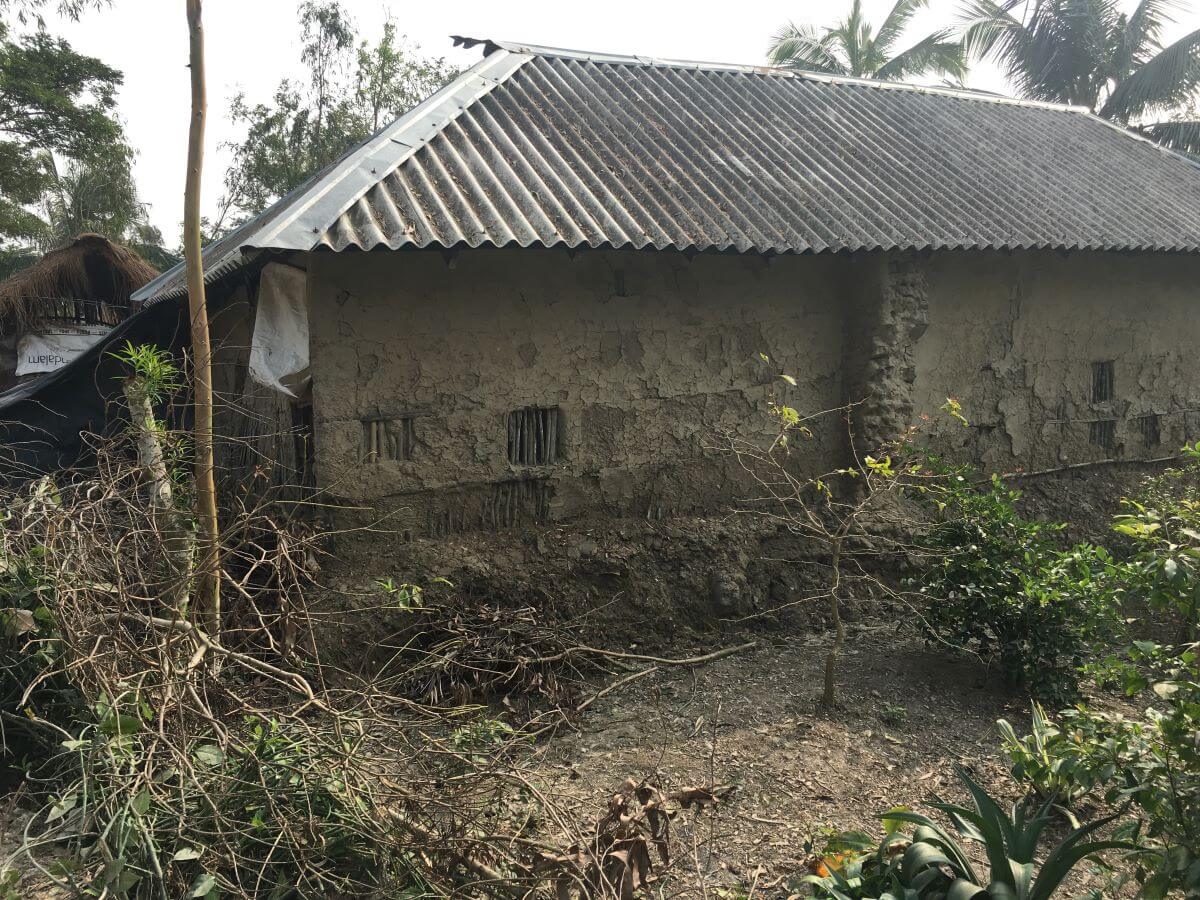
Mud homes effected by the cyclone
My interviewees conveyed that the salt in the mud changed the way it dried. They added that the additional rain each year made it so during the monsoon season their homes were perpetually damp. Aila occurred during the summer and many families had to rebuild their homes during an inopportune time. A few of my respondents stated that their homes never really dried because of this, which made them worry about the stability and longevity of these new homes.
Making Sense of My Data: Visualizing Code Co-Occurrences
In this fieldwork diary, I will write about how to create graphics using MAXQDA’s visual tools to help convey my data. Two tools that I have found particularly useful are the Code Relations Browser and the Code Matrix Browser.
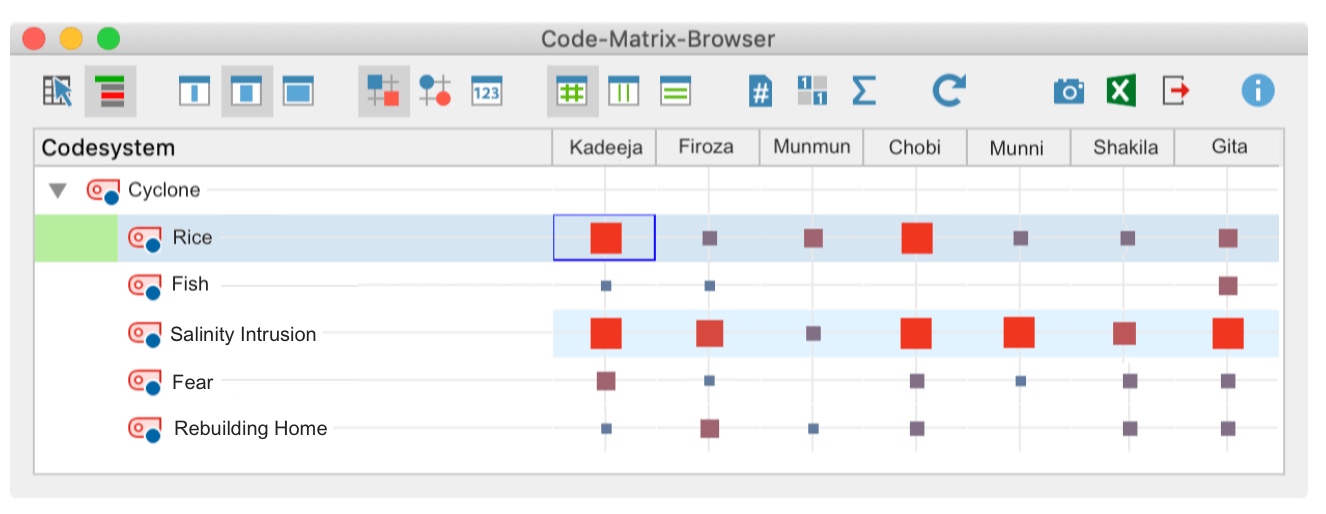
The Code Matrix Browser
Above is a screenshot from my analysis using MAXQDA’s Code Matrix Browser. The columns represent documents, each named after one of my interlocutors. Then the codes are listed by rows. I analyzed my data as follows:
- I coded sections of interviews where people are discussing the cyclone as entire chunks.
- I then coded by how they described the cyclone and its effects within it. For instance, the cyclone “hit during lunchtime” and also “affected the rice crop”.
- By the size of the square in the matrix, I can see that rice was mentioned very frequently across my interviews.
- You can also see that of the interviewees I selected, when talking about the cyclone and its effects, they mainly mention rice and salinity intrusion, though some respondents also mention fish, fear, and rebuilding their homes.
- These results helped me conclude that cyclones are seen as catalysts for bringing in salinity intrusion but also that that they are understood by the residents of the Sundarbans through micro every day changes that they create.
Closing Remarks
Climate change and cyclones will, unfortunately, continue to batter the Sundarbans in coming years. For instance, this past week (May 2020) right before I hit submit on this draft about Cyclone Bhulbul in November 2019, Cyclone Amphan hit the Sundarbans and was one of the worst cyclones to date. I will continue to research and try to understand the impacts of extreme weather as it continues to intensify and batter the region.
One of the things that I have learned is most important as a qualitative scholar is flexibility for change between collection and analysis of data. It is an iterative process that shifts my understanding every time I return to the field. MAXQDA is a wonderful software that allows for this flexibility and allows me to easily investigate new relationships between variables in my existing data.
I’d like to thank MAXQDA and the #ResearchforChange Grant for their support in doing this work that means so much to me both professionally and personally. I highly recommend working with the MAXQDA team. They not only have given me a platform to share my work and methods but also given me so much support in my qualitative data analysis skills.
About the Author
Raka Sen is a Ph.D. student in Sociology at the University of Pennsylvania, USA. The fieldwork phase of her research project titled “Adaptation Labor: Gender, Work, and Climate Change in the Sundarbans” is currently underway in rural Sundarban villages in Bangladesh. Her project will continue as she completes her dissertation in the next few years and hopefully beyond that. You can continue to follow Raka’s research journey and publications at rakasen.com and you can donate to relief funds at any of the many of the incredible organizations doing the on-the-ground work:
 Raka Sen is a Ph.D. student in Sociology at the University of Pennsylvania, USA. The fieldwork phase of her research project titled “Adaptation Labor: Gender, Work, and Climate Change in the Sundarbans” is currently underway in rural Sundarban villages in Bangladesh. Her project will continue as she completes her dissertation in the next few years and hopefully beyond that. You can continue to follow Raka’s research journey and publications at
 Amphan relief contacts and details