After more than two years of extensive software development, the time has finally come: MAXQDA 2018 is here!
The functionality you know and trust has a new design, complete with more than 60 new features and functions.

We are pleased to present seven new innovative analysis tools and showcase the improvements to existing features that you will find in MAXQDA 2018. It has never been easier for new users to get started with MAXQDA: accessing functions has been simplified throughout the interface and MAXQDA is more intuitive than ever before!
The New MAXQDA Interface
We have made sure that it will be a smooth transition for current MAXQDA users and enthusiasts – the tried and true four-window design is, of course, here to stay. So what has been kicked to curb, you ask? The age of endless toolbars is over! The functions in MAXQDA 2018 are sorted thematically, labeled, and have descriptive overviews in the Ribbon Menu. Many have even been integrated directly into the four-window interface, right where you need them.

You will find your way around easily in this entirely new menu structure – you might even discover functions you’ve never used before. Newcomers to MAXQDA and those of you testing out new data analysis methodologies will be able to better experience the “learning by doing” advantages that MAXQDA is renowned for. Start your analysis with ease!
MAXQDA 2018 New Feature Highlights
Check out the feature highlights waiting for you in MAXQDA 2018 here:
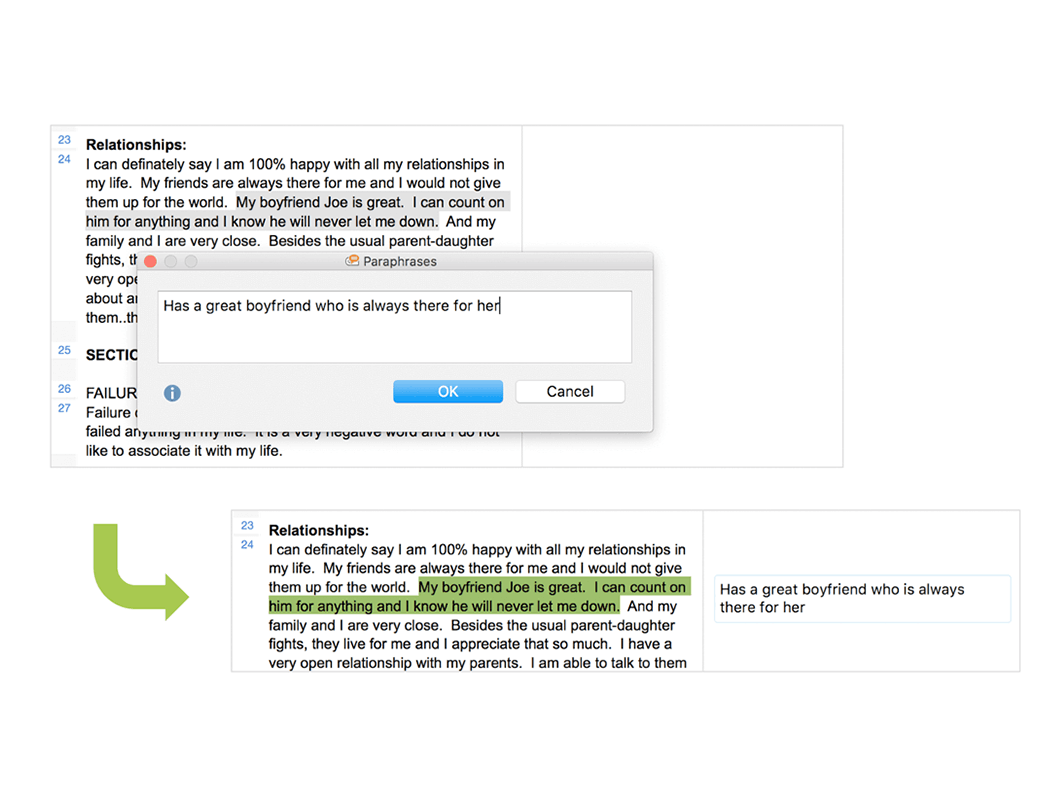
Paraphrasing
Let the data be your guide: summarize the material in your own words with inductive category building
Conveniently summarize individual sections of data and display them directly next to the text. The brand new “Categorize Paraphrases” overview function is ideal for inductively forming new categories, which can help you create a new code system.
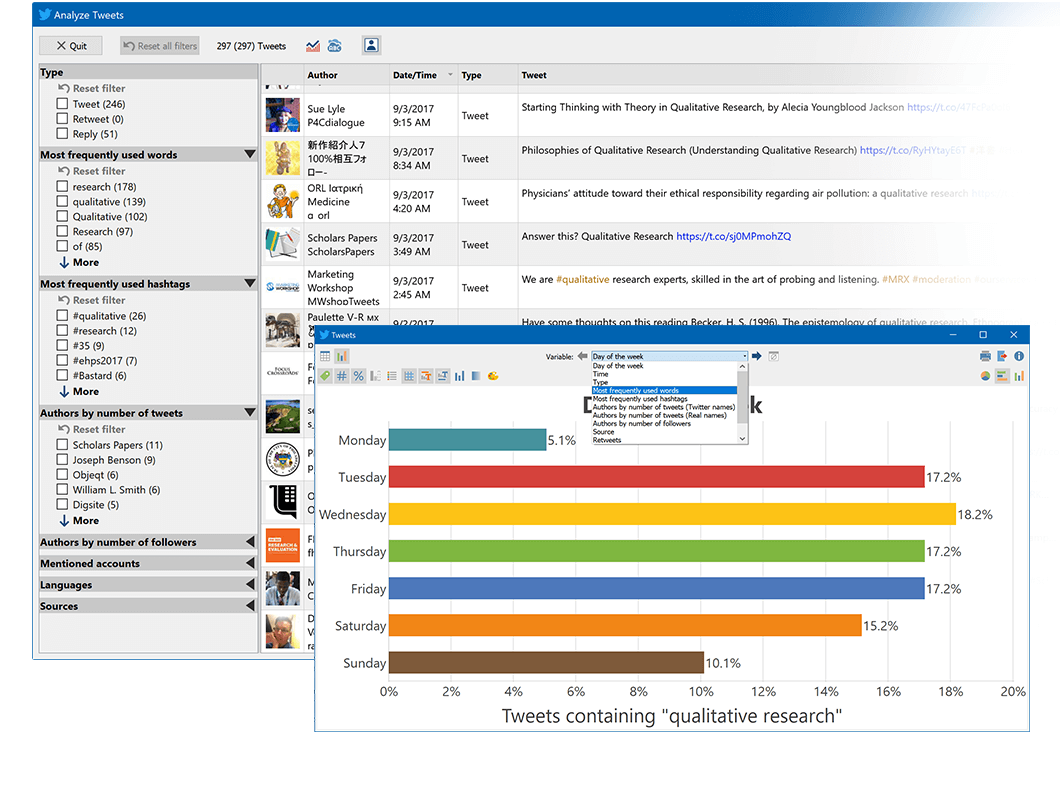
Twitter Statistics
#MAXQDA2018: The Latest in Twitter Analysis
The new and improved Twitter analysis tool includes multiple filters and automatically-generated charts that let you conduct a comprehensive statistical evaluation of tweets. You can even include the message type (Tweet, Reply, Retweet), profile image, language, device-type, and location information in your data evaluation processes.
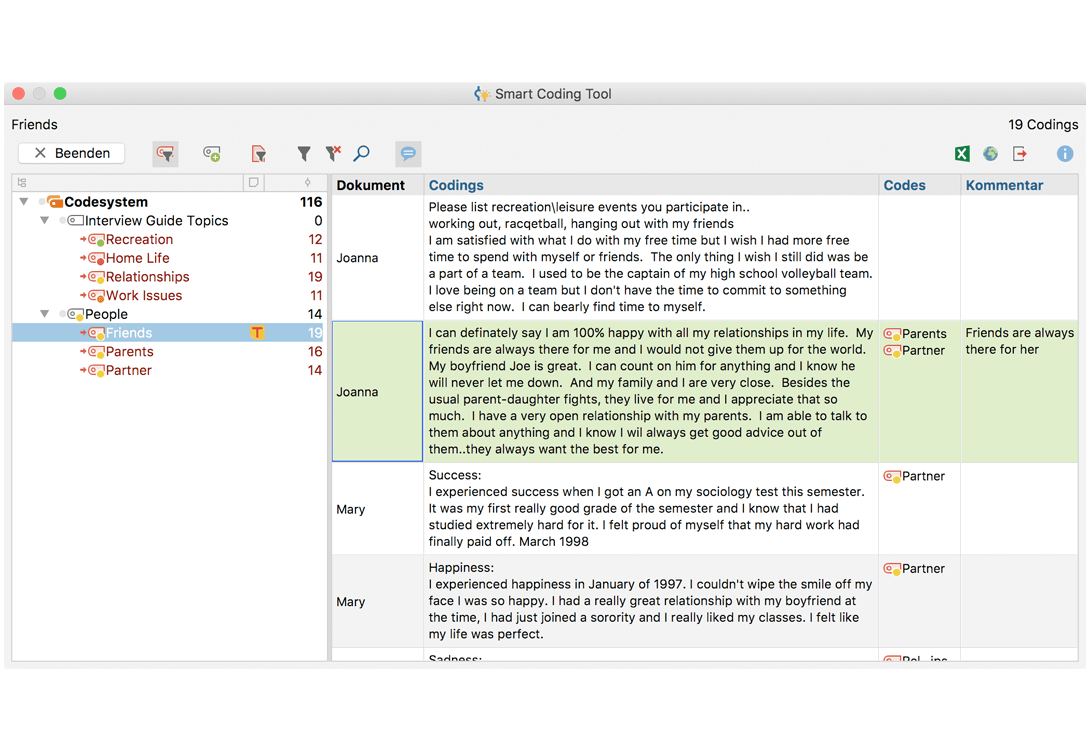
Smart Coding Tool
Stay on track: manage coded segments quickly and easily
We are delighted to introduce a new tool that makes assigning data segments to codes easier, faster, and – above all – clearer. The “Smart Coding Tool” feature helps you check code assignments, make corrections, and keep track of the overall picture, all of which is particularly essential in advanced stages of coding.
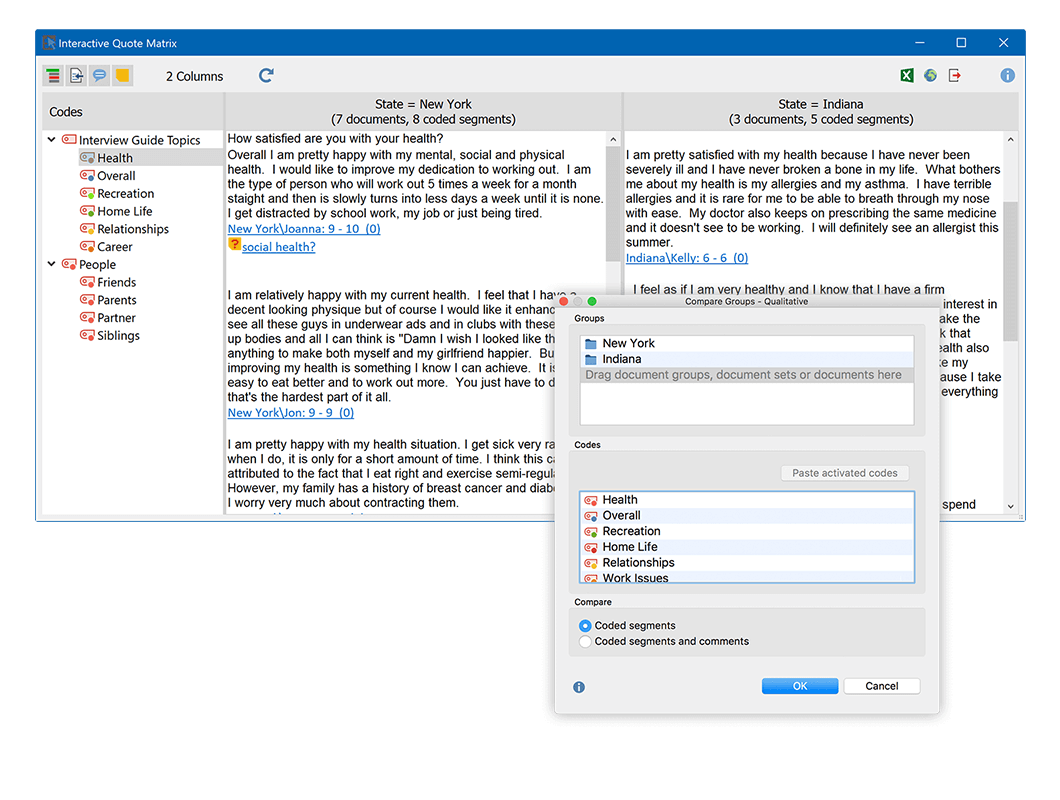
Group Comparisons
Expand the scope: comparing groups made easy
Compare coded segments from several data sources quickly and clearly with MAXQDA 2018: the “Compare Groups” feature offers researchers a simple and intuitive way to compare coded content or quantitative characteristics of different groups.
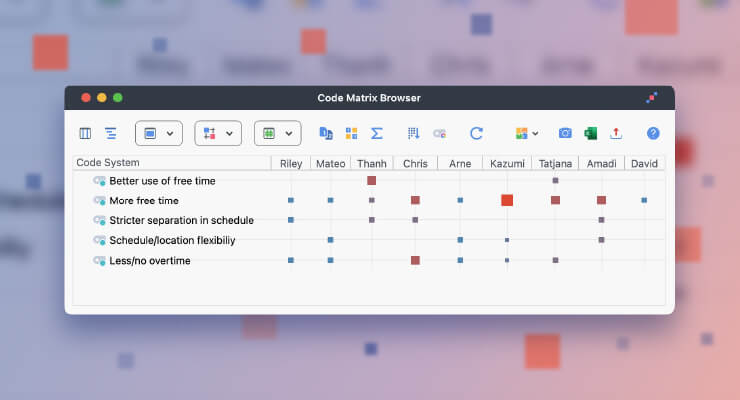
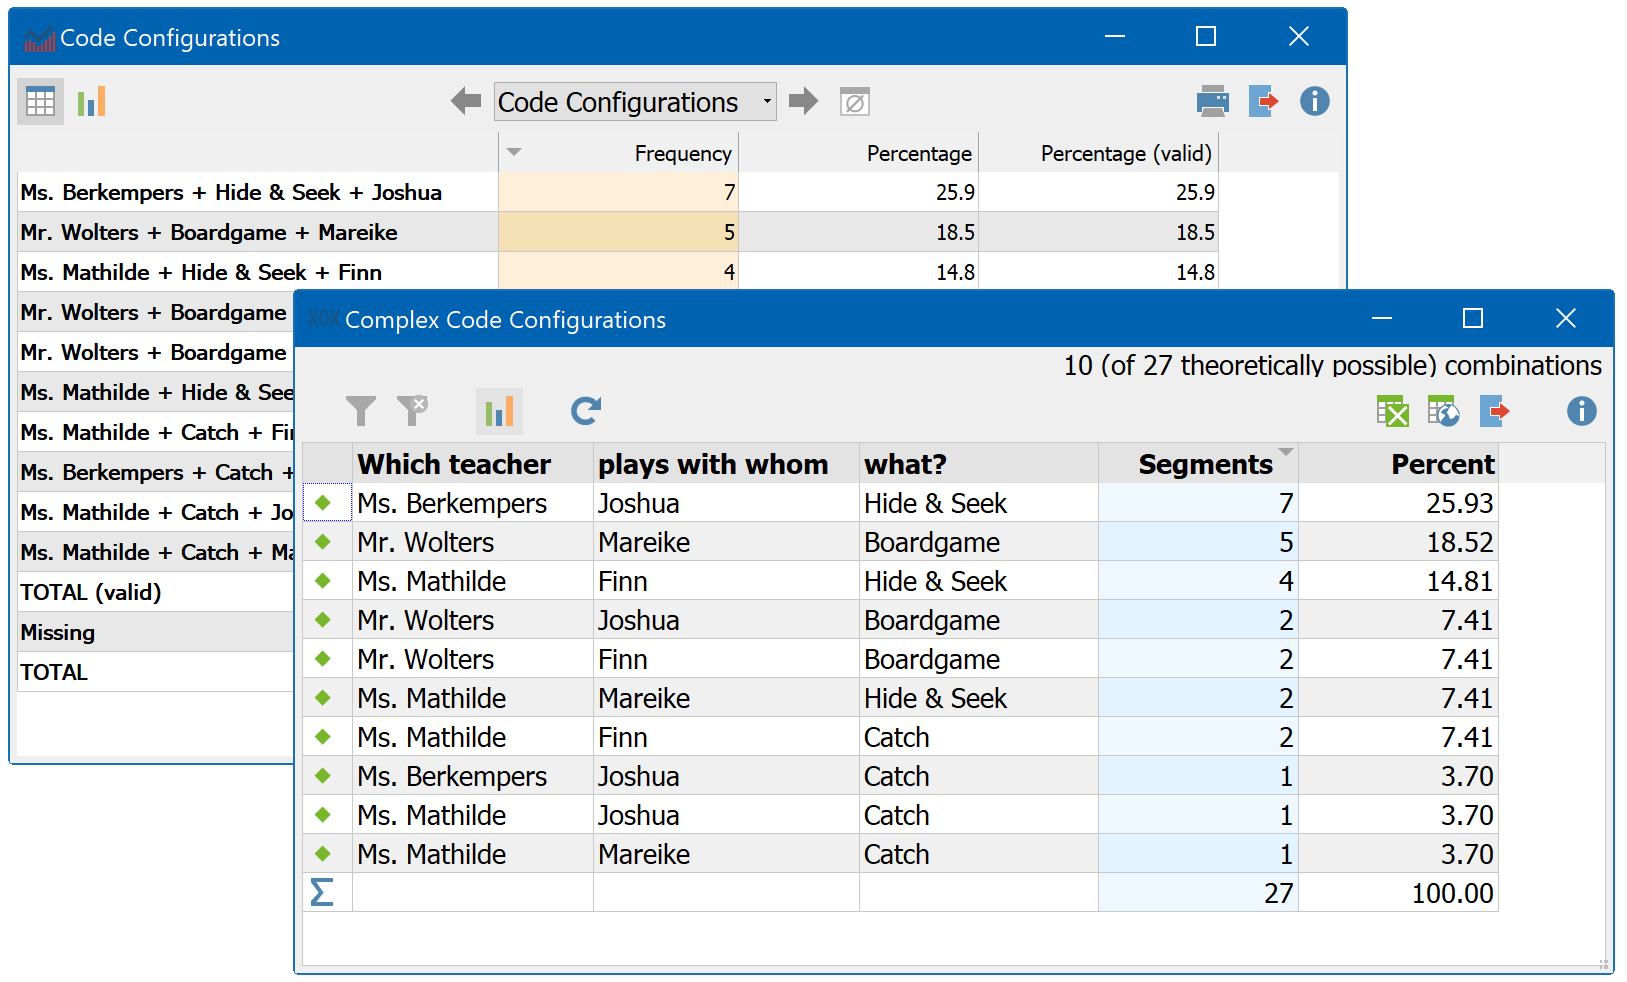
Code Configurations
Get complex: analyze code combinations with up to six dimensions at once
The “Code Configurations” feature enables you to quickly and easily display which codes occur in combination, as well as the frequency at which they do so. Everything can also be automatically visualized into chart diagrams!
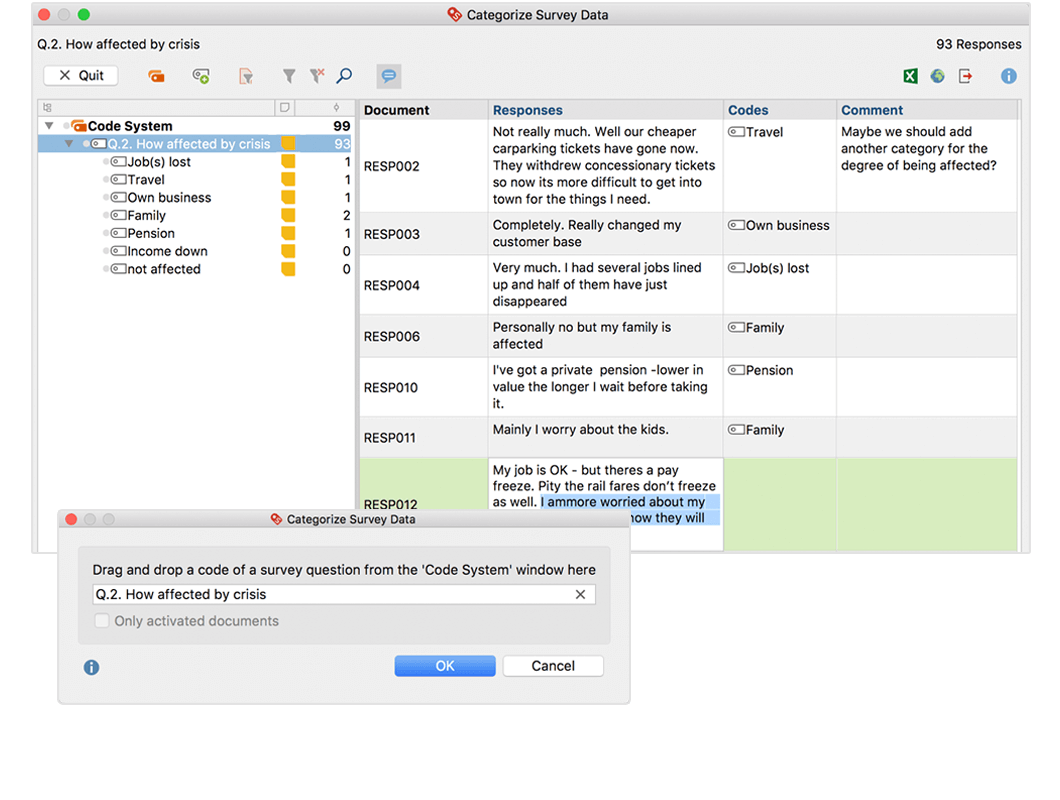
Survey Responses
Categorize your survey data: quick analyses of open question responses in surveys
MAXQDA 2018 expands on the advanced processing of partially standardized and open surveys – in the form of the new “Categorize” and “Evaluate Survey Responses” functions. You can now quickly and clearly display which responses have already been coded with a particular category and add comments to identify unclear code assignments.
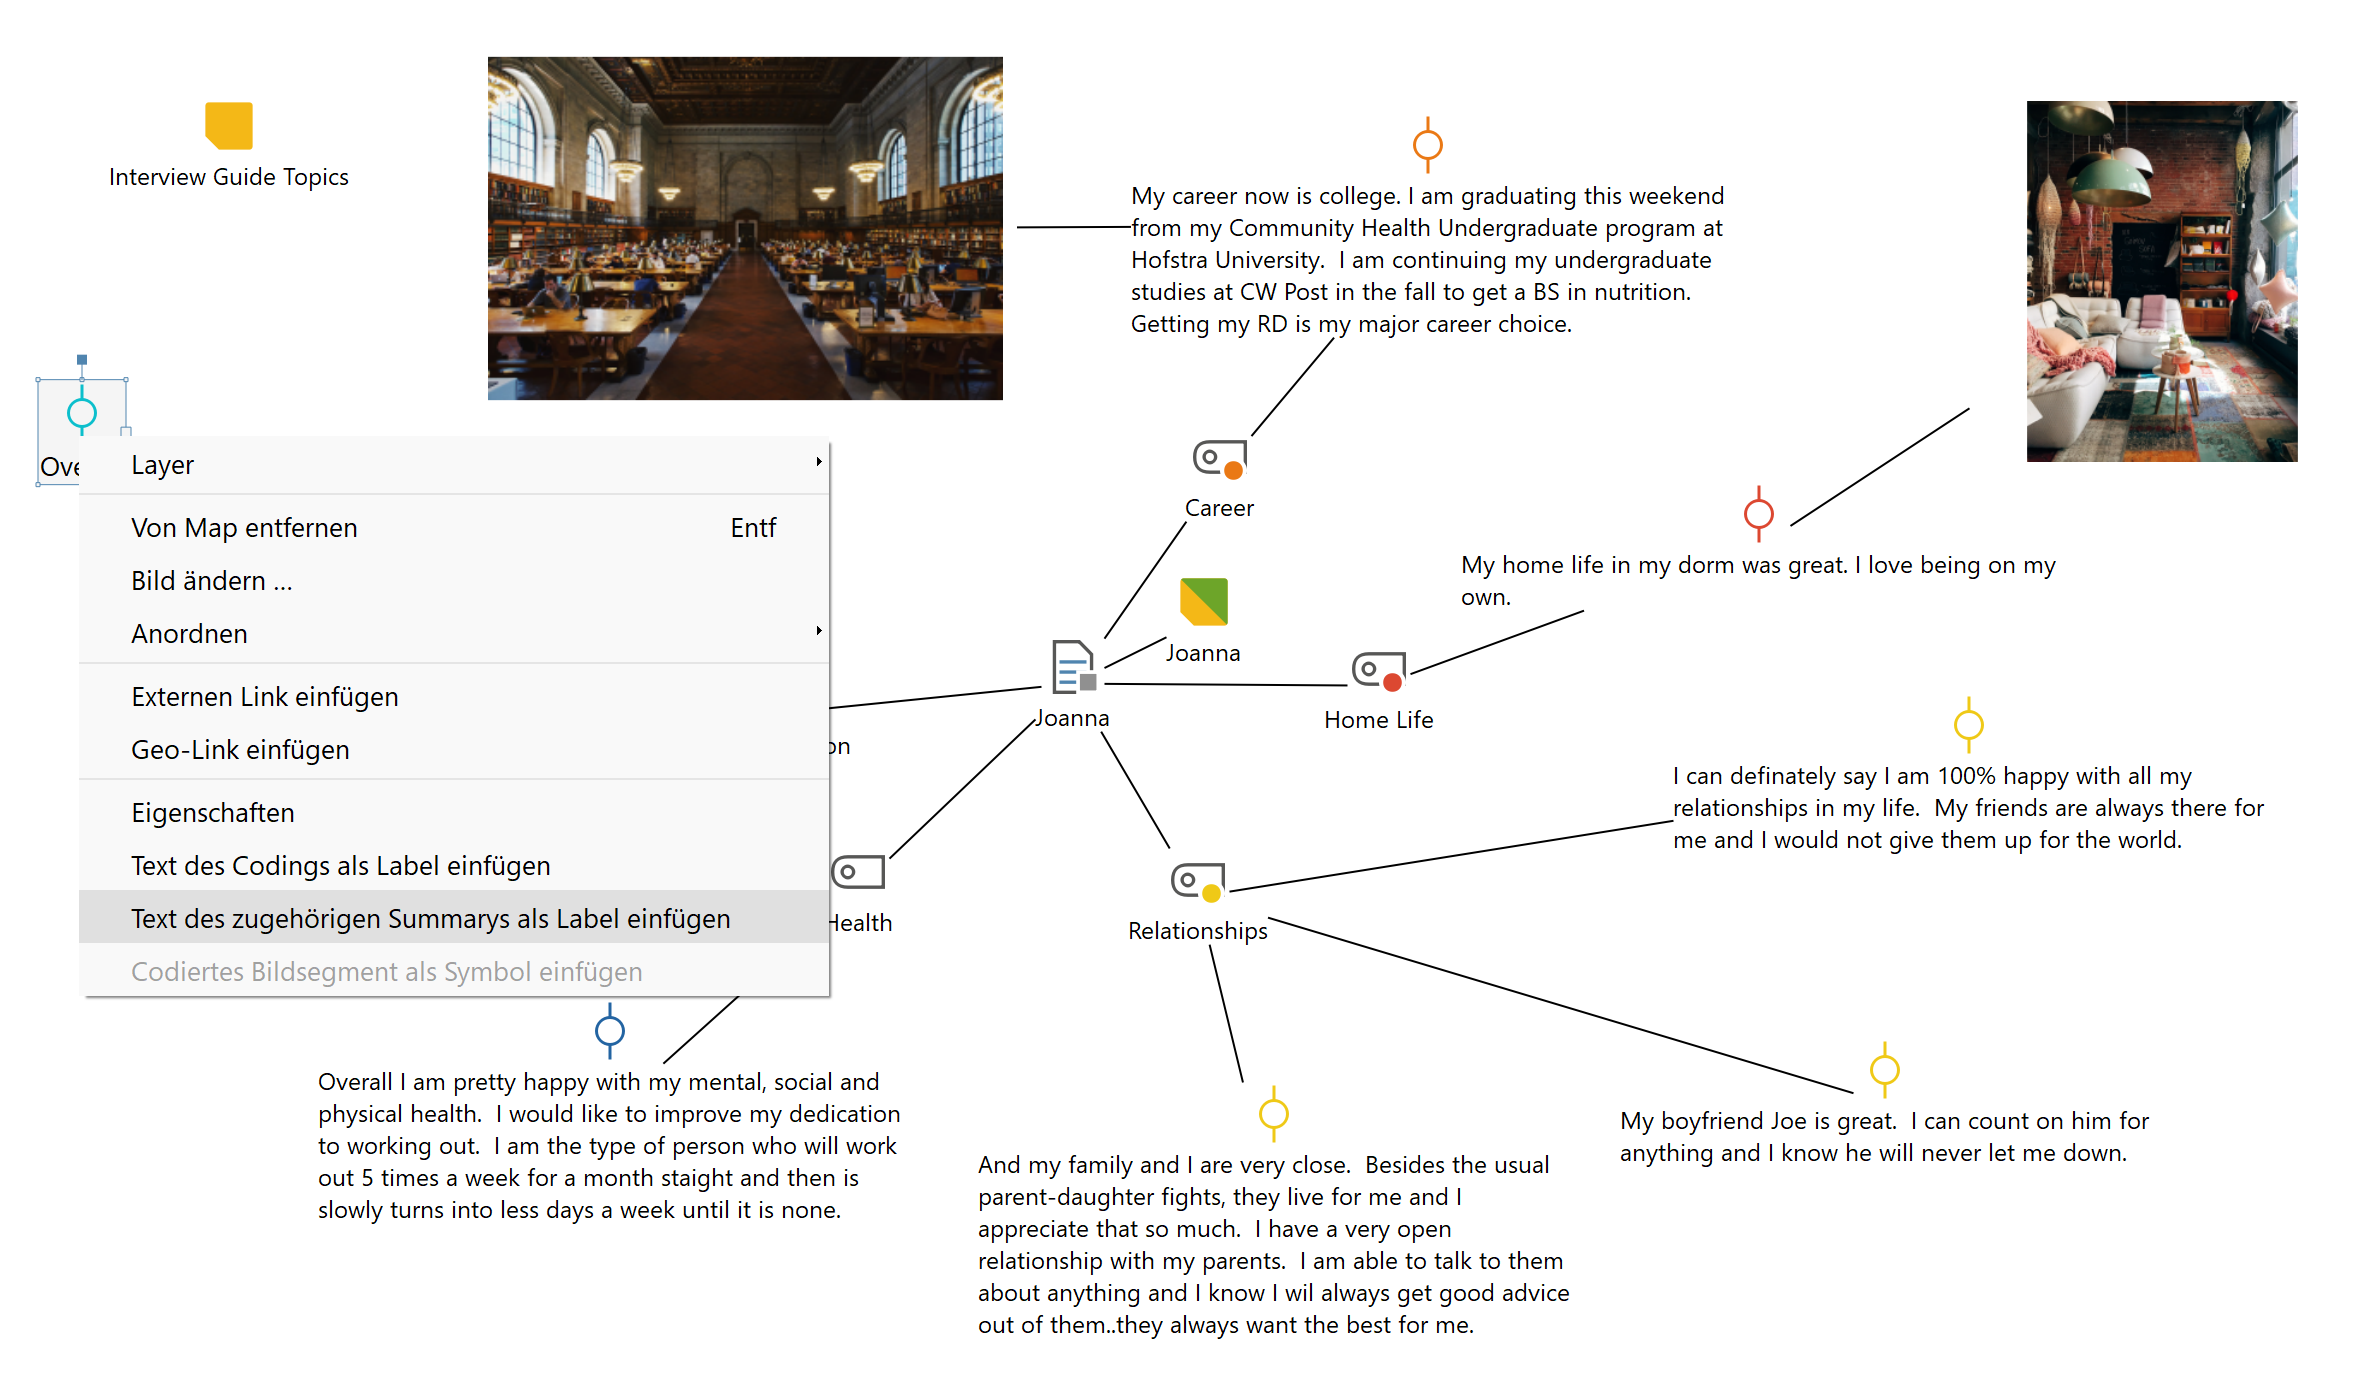
MAXMaps
Complete mapping makeover: MAXMaps instead of mind maps
With a new interface look, four new and unique MAXMaps models, new options for directly importing coded image segments, memo texts and summaries, new free objects, the ability to save maps as PDFs and DOCs, and so many small improvements, MAXMaps 2.0 has been completely reworked. We would have to dedicate an entire newsletter to cover them all! Curious? Explore the new MAXMaps today.
Transcription
All-In-One: transcribe quickly and analyze intuitively
Transcribing is a time-consuming affair. MAXQDA 2018 makes the job easier with a focused transcription view and automatic label changes for speakers whenever you start a new paragraph. You can also define your own shorthand symbols for words and phrases, e.g. where “1” changes to “Person 1” or “x” to “(incomprehensible)”. It’s fun and it saves a lot of time!
Drumroll please…now presenting the Global Undo button! This is a great feature, especially for researchers working with computer-assisted data analysis software for the first time – you can now undo every step in MAXQDA 2018:
Global Undo
Full speed ahead – or take it all back?
Research is a journey and sometimes you have to take a few steps back before you can move forward – this is especially true in the early stages of your data analysis process. With the Global Undo button in MAXQDA 2018, you can instantly reverse any step you take. Accidentally deleted a code? Retrieve it with one click!

Release Special
Limited Time Offer until January 31st, 2018:
Apply for a MAXQDA 2018 upgrade on your MAXQDA 12 license purchased on June 1st, 2017 or later and we’ll upgrade you for free! Click here to find out more about your free upgrade to the latest version of MAXQDA.
Don’t qualify for a free upgrade? Click here to find out more about how to upgrade with a 50% discount.