See Patterns in Your Qualitative Data Instantly
If you work with qualitative data, you already know the challenge: once coding is complete, the real analytical work begins. Patterns, overlaps, absences, and contrasts across your data can quickly become difficult to track.
That’s where the Code Matrix Browser in MAXQDA becomes surprisingly powerful.
At first glance, the Code Matrix Browser looks like an appealing visualization tool that quickly visualizes the appearance of codes within your data. But experienced researchers know it is much more than that: it’s a fast and intuitive way to move from coding to interpretation.
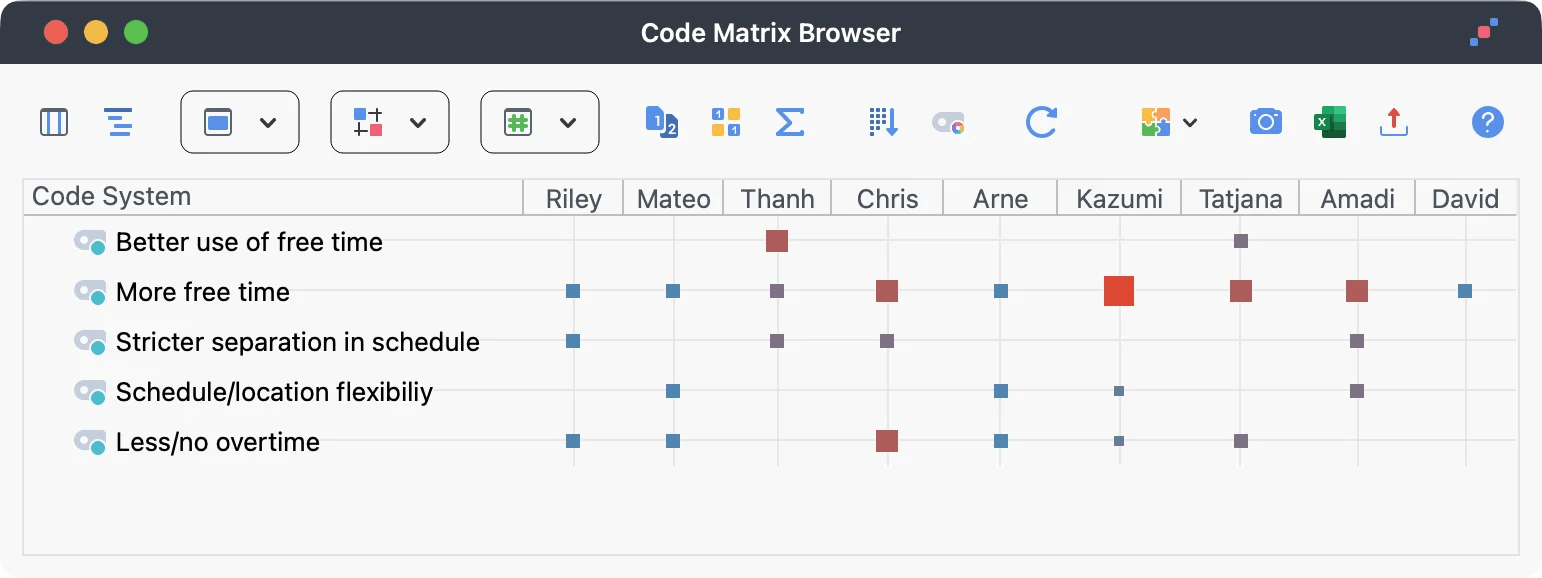
In the Code Matrix Browser, documents appear as columns and codes as rows. Each cell visualizes how often a code appears in a document. Larger symbols indicate more coded segments, making patterns immediately visible across your dataset.
From Visualization to Deeper Analysis
What makes this especially valuable for research projects is the flexibility of analysis. Instead of only comparing individual documents, researchers can aggregate data by document groups, document sets, or even focus group speakers. This allows you to quickly identify similarities and contrasts between cases, participant groups, or thematic clusters.
Several advanced options make the visualization even more insightful:
- Display code hierarchies to preserve the structure of your coding system
- Sort columns by similarity to uncover patterns between cases
- Switch between circles, heatmaps, percentages, or frequency displays
- Binarize the matrix to focus only on whether a code appears or not
- Export frequency tables directly to Excel or statistical software for mixed methods workflows
One particularly useful feature for deeper analysis is the ability to double-click any cell and immediately open all coded segments that underly. This means the Code Matrix Browser is not just a visualization – it is also a direct gateway back into your original data.
For research teams, the Code Matrix Browser is also an excellent communication tool. Complex coding results become easy to present in supervision meetings, workshops, or publications because the visual structure makes thematic distributions understandable immediately.
The takeaway? The Code Matrix Browser is not simply a “nice visualization.” It is a serious analytical tool that helps researchers identify structure, relationships, and meaning in qualitative data faster and more confidently.
And once you start using it strategically, you may wonder how you ever analyzed qualitative data without it.