Here comes an update on the Cheyenne River Voices Study which MAXQDA sponsored . The research team has coded 1/3 of the total transcripts (150). MAXQDA talked with Setarah V. Senthong, research associate of the Cheyenne River Sioux Tribal Ventures study about how the research team set up the code system, how it created and categorized its codes and how it connects qualitative and quantitative data.
How did you set up your code system within the research team?
 First of all, we just want to establish that we are a small working team of only three project analysts. Before we had the MAXQDA software, the job of coding in excess of 150 surveys with more than 160 questions each seemed impossible. With MAXQDA, it is possible for me to code whole transcripts in a fraction of the time it took to do it the old-fashioned way of copying each quote and pasting it to the correct area of a Word document.
Most of the codes were elaborated with a team work hand-coding procedure prior to acquiring MAXQDA. Although the original purpose was to do grounded theory and therefore focus on in-vivo coding, we realized that the team could add good insights creating codes from their previous experience in surveying and collecting the data. Transcripts were hand-coded by several research associates. Then, from the three different people who did this, we created a set of codes to plug into the newly created MAXQDA database.
You mentioned using inductive and in-vivo coding. What were your experiences with this approach?
 Inductive coding was used to build the database and then in-vivo coding was used to adjust the codes to the data. Generally, the main categories were inspired from the general format of the survey.
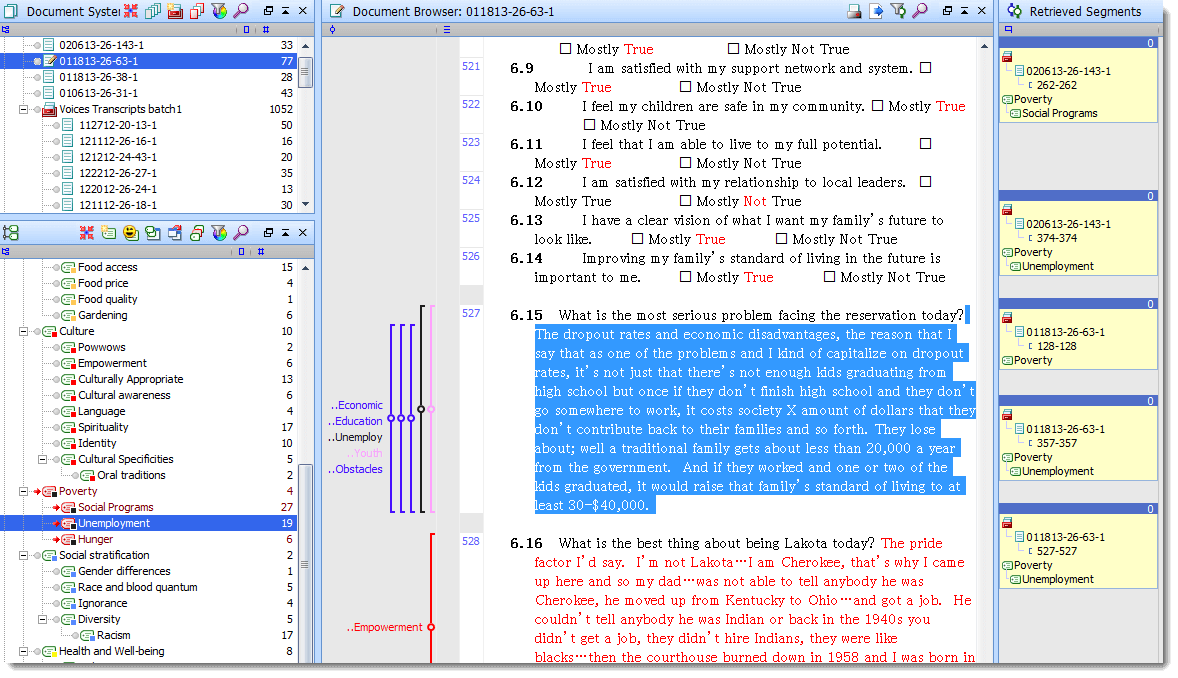
Our list of codes is always evolving and it is so nice that this software allows us to do so. After coding 40 documents, we were up to 189 codes. Then after exploring the visual tools of MAXQDA it became evident that our codes needed to be broader in order to make them more significant using the visual aids such as the matrix browser option.
During this sorting process, the document browser and retrieved segments windows were helpful in combining and eliminating codes. Also through this process, the main themes of our coding outline have surfaced. In no particular order of importance, the categories of the outline are: Communities, Governance, Tribal Ventures, Family, Food, Culture, Poverty, Social Stratification, Health and Well-being, Economy, Land, and Housing.
Have you been able to use quantitative data to gain additional perspectives on the qualitative data or vice versa?
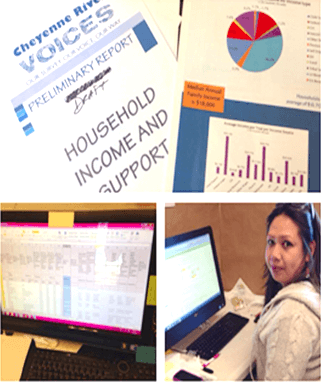
Originally, the qualitative data was to back up the quantitative analysis, since it comes directly from it. Keep in mind that the transcripts come from the side-information of the recorded surveys administered (150 recordings and 822 total surveys). However, with the help of MAXQDA and its functionalities, the systematization of the qualitative data allows us to explore a totally different and deeper level of the data collected.
The bulk of our report is going to be quantitative data, but without qualitative data, the picture is incomplete. And without the MAXQDA Software, making sense of the qualitative data would have been monotonous and taken many more man-hours.
We’d like to thank Setarah V. Senthong and her team for keeping us up to date and letting other researchers take a look behind the scenes of their research.