This is a guest article written by Matthew Loxton, a Principal Healthcare Analyst and Professional MAXQDA Trainer.
How MAXQDA can assist with Focus Group Analysis: analysis of differences and commonality of focus group perceptions
Focus groups and in-depth interviews are used in many industry domains to gather qualitative data to support or inform policy or operational decisions. This data can be analyzed to reveal key topics, risks, issues, and opportunities. An important part of such analysis is the identification of areas in which there is strong commonality between the participants, and conversely, areas in which there are large differences and in which few participants share interest.
One of the challenges in reporting on commonality vs differences is that they are often difficult to communicate to management or policy-making audiences in an engaging manner. While the commonality and differences can be accurately depicted in correlation matrices, or box-whisker plots (Figure 1), these are typically not well understood by non-quantitative audiences and lose much of the thickness of qualitative analysis.
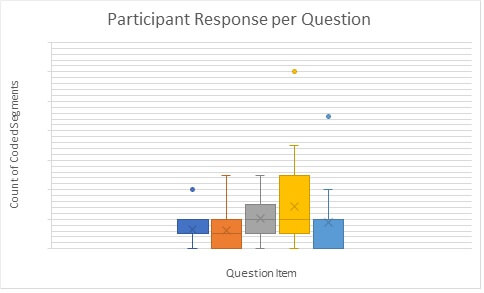
Figure 1: Participant Response Count of Coded Segments
In this article, we discuss the use of MAXQDA’s MAXMaps feature as a means to communicate differences and commonality of participant perceptions in an understandable and accessible way.
Case Example
Our team used MAXQDA 2018 as part of our analysis of the qualitative data from a nominal focus group of 15 senior executives. The executives were from a large healthcare organization, and the sessions were related to changes in policy. Due to participant travel and availability constraints, the interviews and sessions were held individually, but participants were in contact outside the interview sessions.
We conducted semi-structured interviews using a set of five topics that were communicated to the participants ahead of time. During the sessions, participants were prompted with each question in sequence. If they digressed from a topic and covered further information related to a previous or subsequent topic, the information was later coded to the appropriate topic during analysis.
Data Process
After conducting the sessions, recordings and interview notes were transcribed, and speaker changes were identified by means of a convention of <speaker><”: “> for later identification by MAXQDA’s Import Focus Group Transcripts function. E.g. The start of text for the first participant was marked with “Participant-1:”.
Once completed, the transcripts and notes were imported, resulting in the automatic creation of a document for each participant (Figure 2) and a code for each participant (Figure 3).
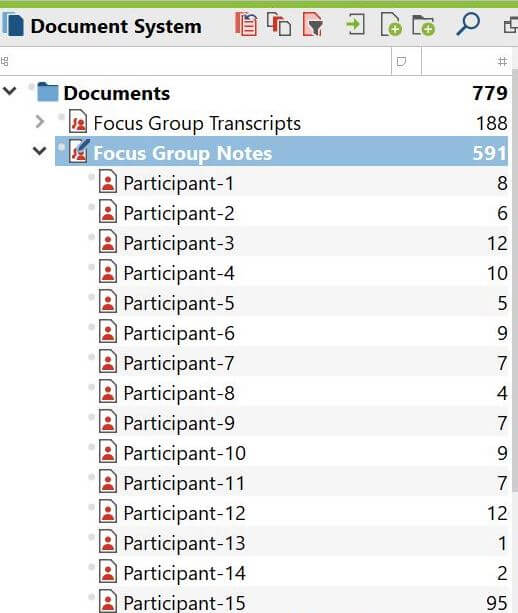
Figure 2: Participant Documents
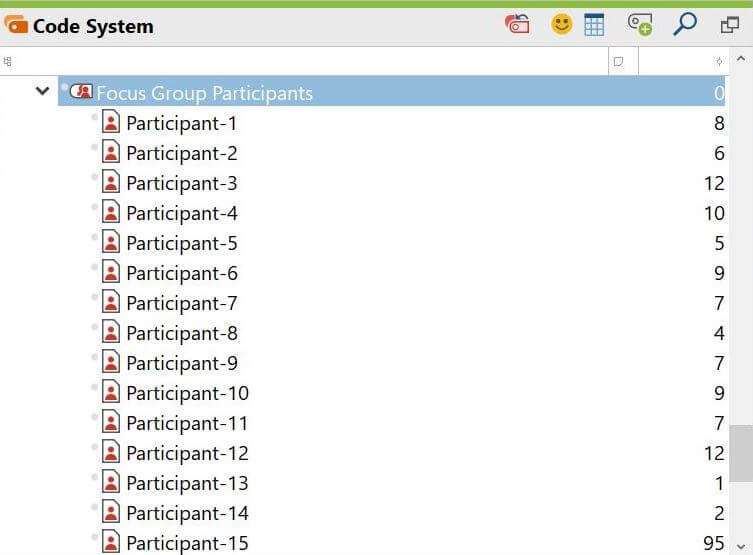
Figure 3: Participant Codes
For this project, we created a code for each question, as well as codes created from analysis of word and phrase frequencies using MAXQDA’s MAXDictio feature. Free codes were derived during analysis of the transcripts and notes (Figure 4).
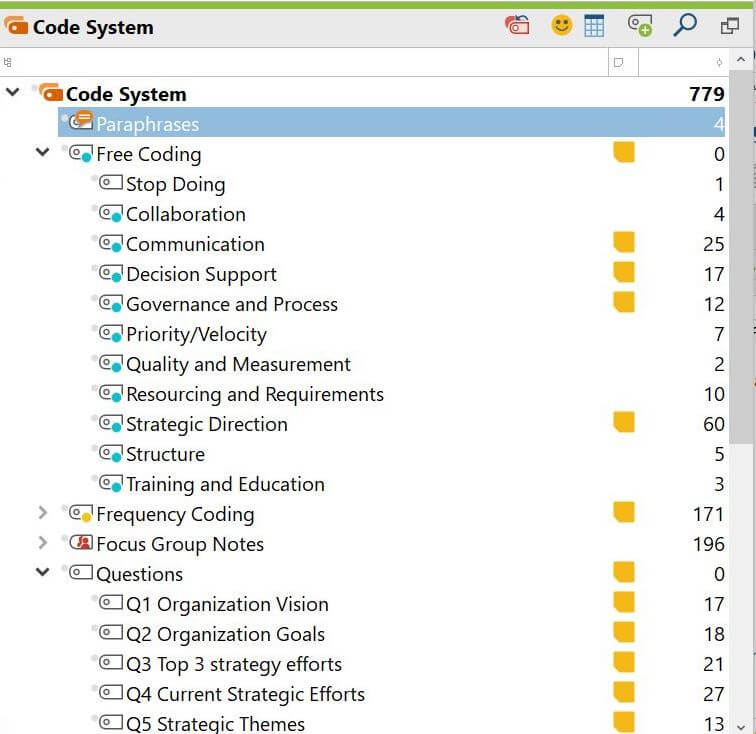
Figure 4: Code Structure
Graphic Reporting
A typical representation of participant activity within a topic can be graphically depicted by the count of segments per code (Figure 5), characters per code, or coverage percentage.
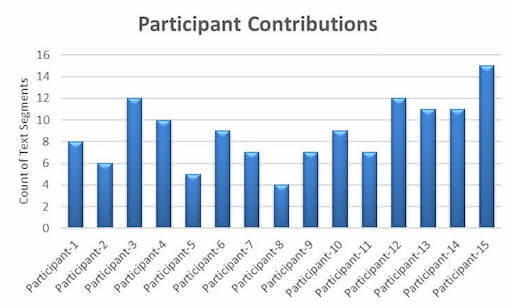
Figure 5: Count of Coded Segments by Participant
These simple visualizations of variation of the data are well understood by most management audiences and may be enough for many situations. These can be created in Microsoft Excel or other charting software from data exported from MAXQDA’s Code Relations Browser. To obtain this data, look under MAXQDA’s Visual Tools tab, select Code Relations Browser, select the “co-occurrence” option to be given a table view of the frequency where two codes co-occur in the selected documents. Display nodes as values, and use Excel or MAXQDA Stats to generate a chart to depict the frequency of participant vs question.
However, with MAXMaps, we can view the relationships between the participant codes and thematic codes in a richer and more accessible way. By using connector arrows and code placement, it is easy for the audience to understand which themes are shared between more than one participant, and which themes are unique. Following a convention in which shared codes are placed in the inside space between participants, and unique codes are placed in the outside space, Figure 8 shows codes shared between Participant #7 and Participant #5, as well as those unique to each.
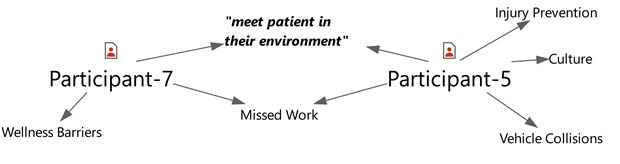
Figure 7: MAXMaps Participant vs Theme
In the same way that chairs are often arranged in a circle for focus group meetings, we chose to arrange the participant codes in MAXMaps in roughly a ring shape (Figure 8).
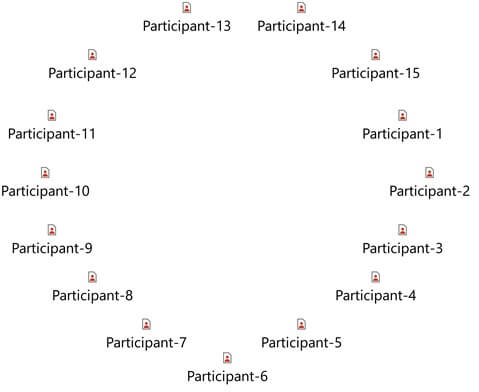
Figure 8: Participant Arrangement
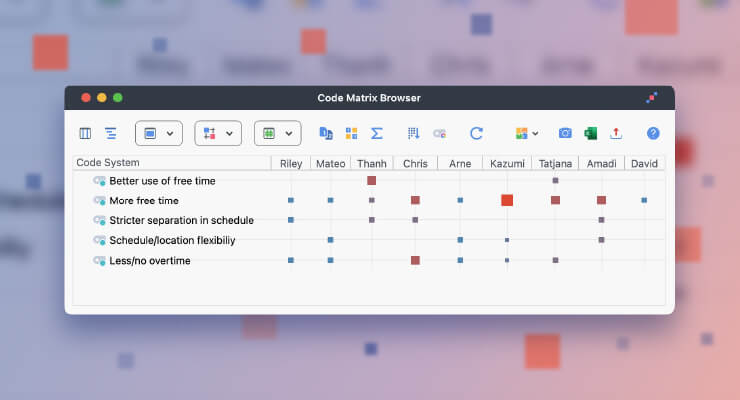
We then reviewed MAXQDA’s Code Matrix Browser, with Binarize selected to show the connections between the participants and the codes with which they were associated (Figure 9).
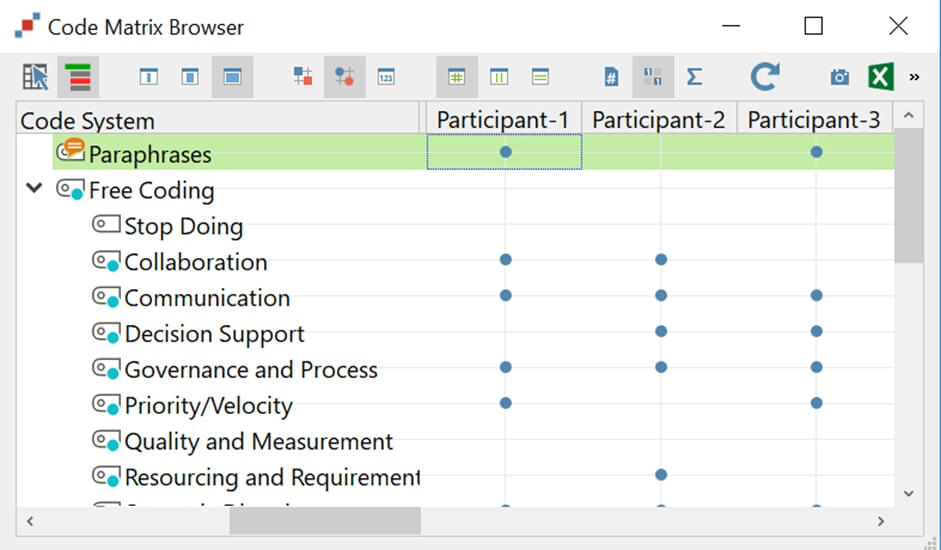
Figure 9: Code Matrix Browser
Using the MAXMaps template we created for the participant ring, we dragged the codes into the map and added links from participants to codes (Figure 10) as indicated in the Code Matrix Browser. We used a single link per correspondence. At this point, there is an option to display the number of code occurrences in the link by clicking on the Code Frequencies icon in MAXMaps. We chose not to show the frequencies in our map, because of customer preferences.
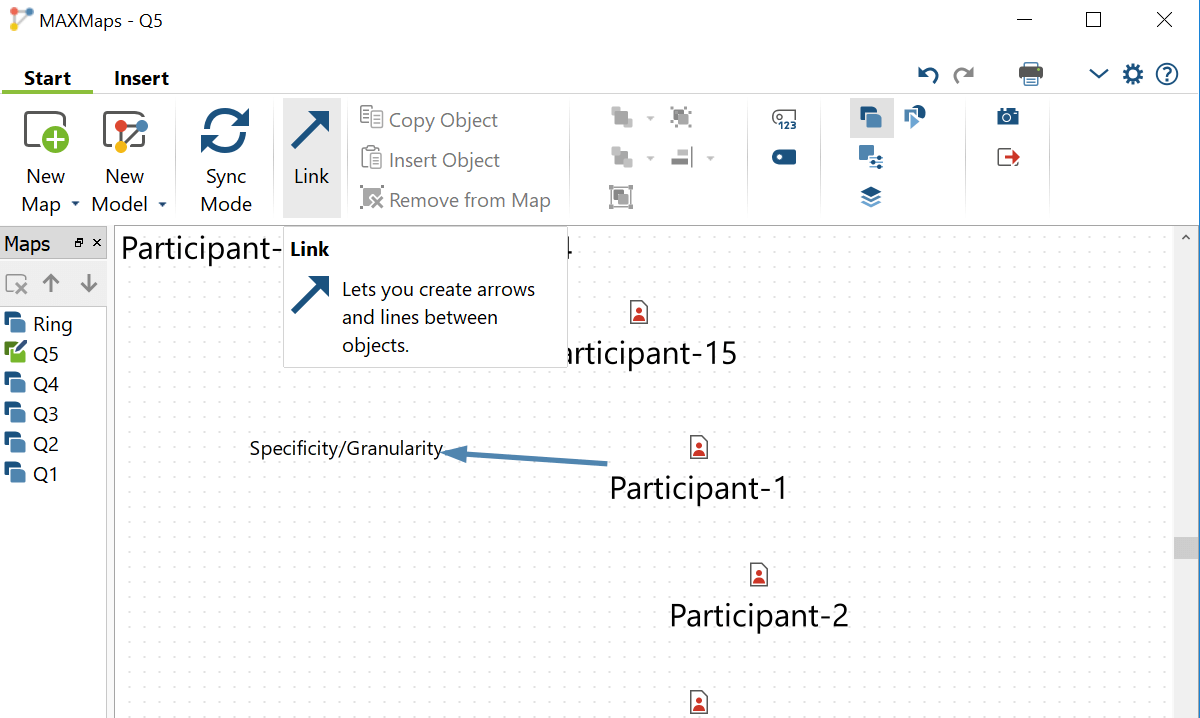
Figure 10: MAXMaps Code Linking
As described earlier, we followed a convention that shared codes are placed in the interior of the circle of participants, and unique codes are placed on the outside of the circle, clustered near the associated participant. Once completed, each question posed in the focus groups has a full construction of the participant links to codes (Figure 11).
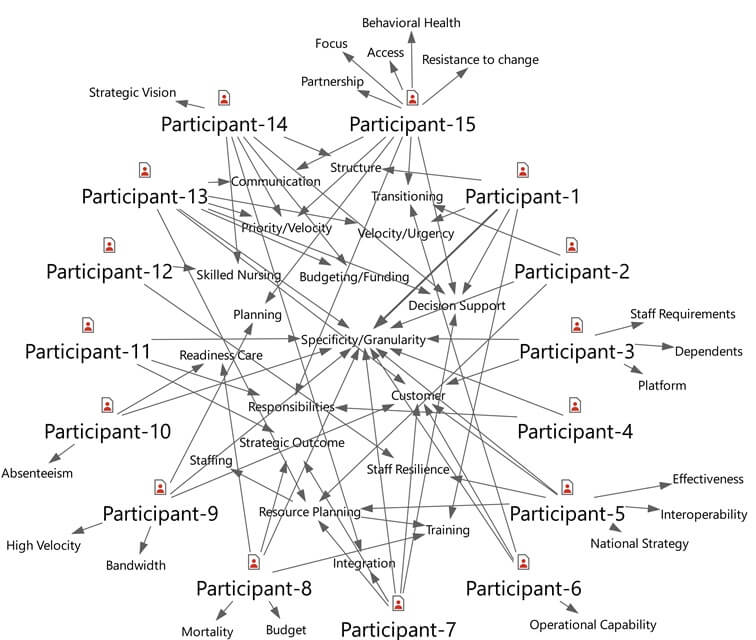
Figure 11: Question 1 Vision and Most Important Considerations
Conclusion
MAXMaps provides a vehicle to efficiently communicate the commonality and diversity of viewpoints in a graphic way that is easy to apprehend but still contains the specificity and thickness that is valuable in qualitative analysis.
Depicting relationships in a graphic manner and using the codes, quotations, and linkages enabled audiences to see at a glance where there was great commonality or diversity of thought. It also gave the more analytical audiences a means to see finer detail of commonality and diversity. The two different styles of audience were effectively combined in a single graphic in a way that would not have been practical using box-whisker and similar traditional representations.
Management audiences found the thematic connectivity maps in this project to be engaging and informative, without being taxing, and which assisted them in decision-making. The MAXMaps graphics enabled decision-makers to steer further analysis efforts to areas of interest.
About the Author
Matthew Loxton is a Principal Analyst at Whitney, Bradley, and Brown Inc. focused on healthcare improvement, serves on the board of directors of the Blue Faery Liver Cancer Association, and holds a master’s degree in KM from the University of Canberra. Matthew is the founder of the Monitoring & Evaluation, Quality Assurance, and Process Improvement (MEQAPI) organization, and regularly blogs for Physician’s Weekly. Matthew is active on social media related to healthcare improvement and hosts the weekly #MEQAPI chat. You can also read other guest posts by Mathew Loxton on Mixed Methods Research here in the MAXQDA Research Blog:
 Matthew Loxton is a Principal Analyst at Whitney, Bradley, and Brown Inc. focused on healthcare improvement, serves on the board of directors of the