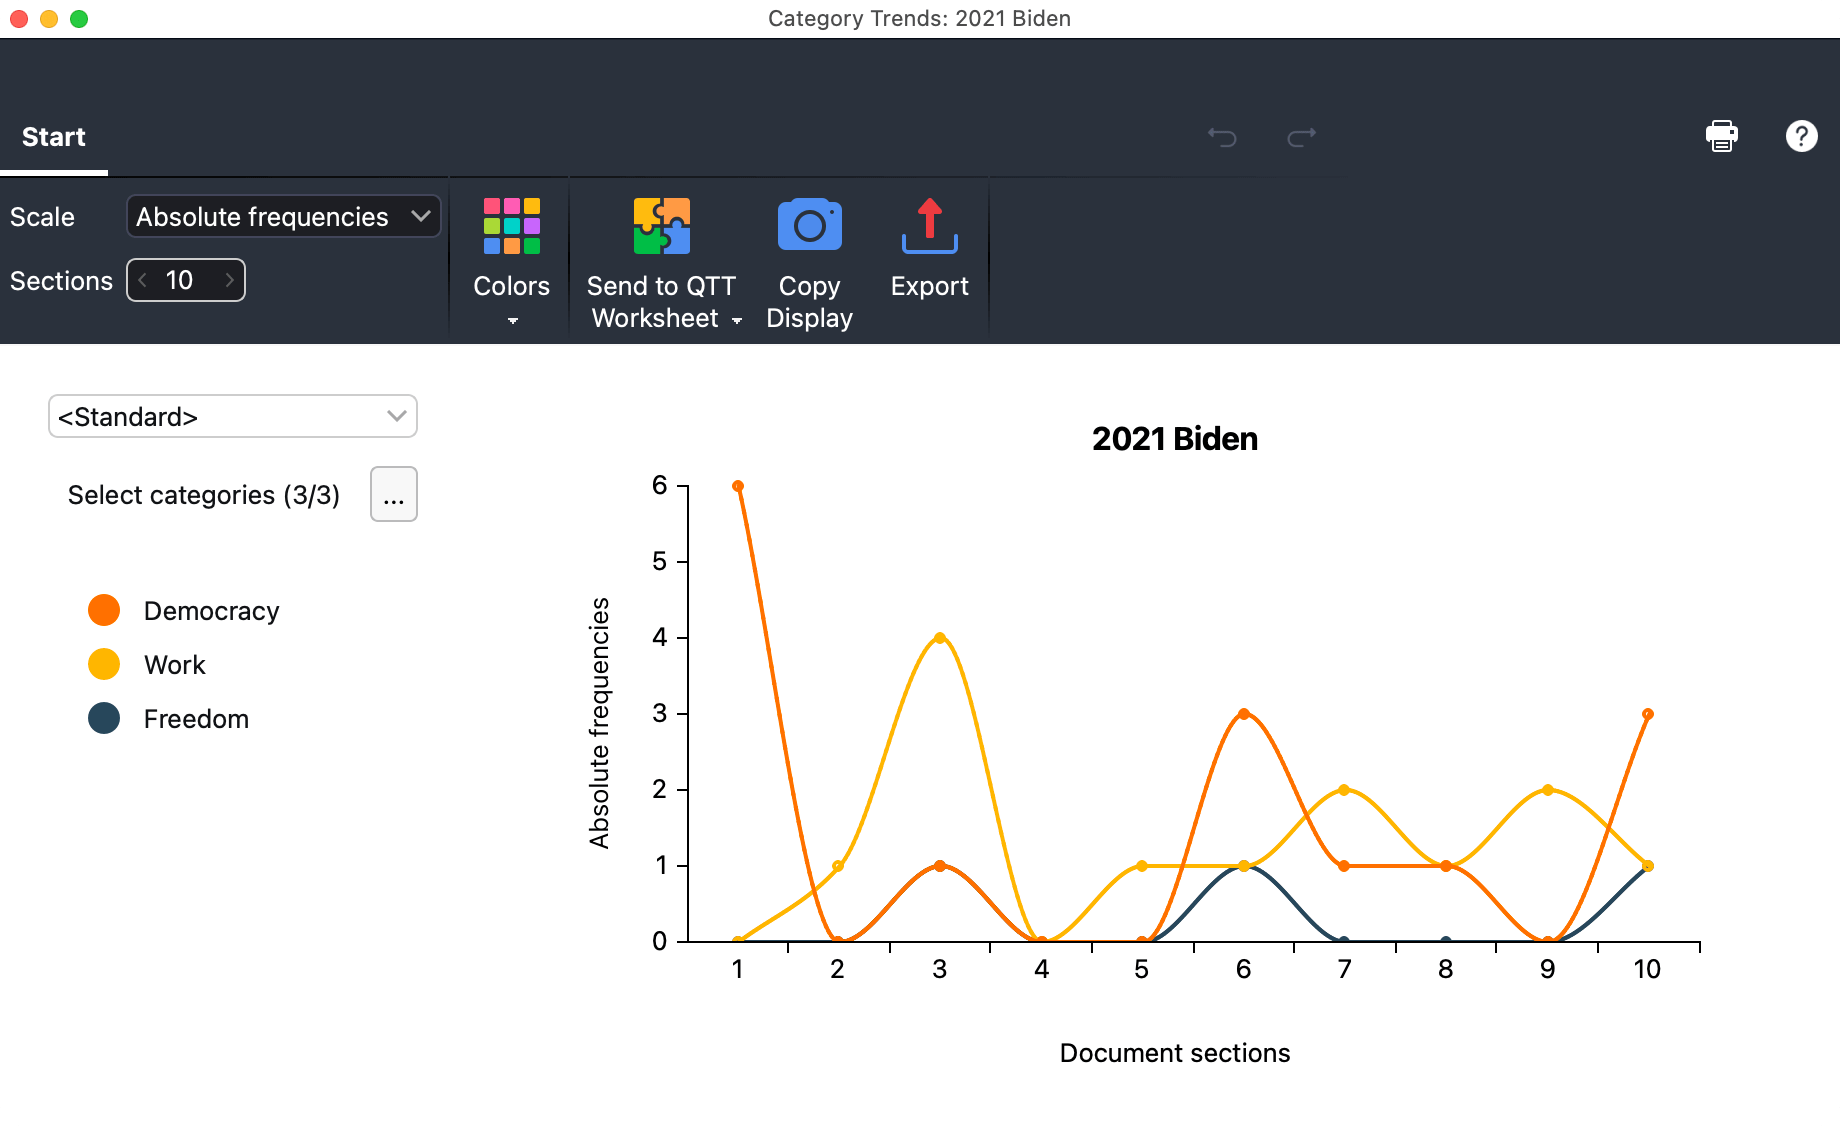
Using Category Trends, you can analyze where and how often a code has been applied in texts. When analyzing a single document, the text is divided into sections of equal length, and the frequencies of search items of the dictionary categories in each section are visualized in a line chart:

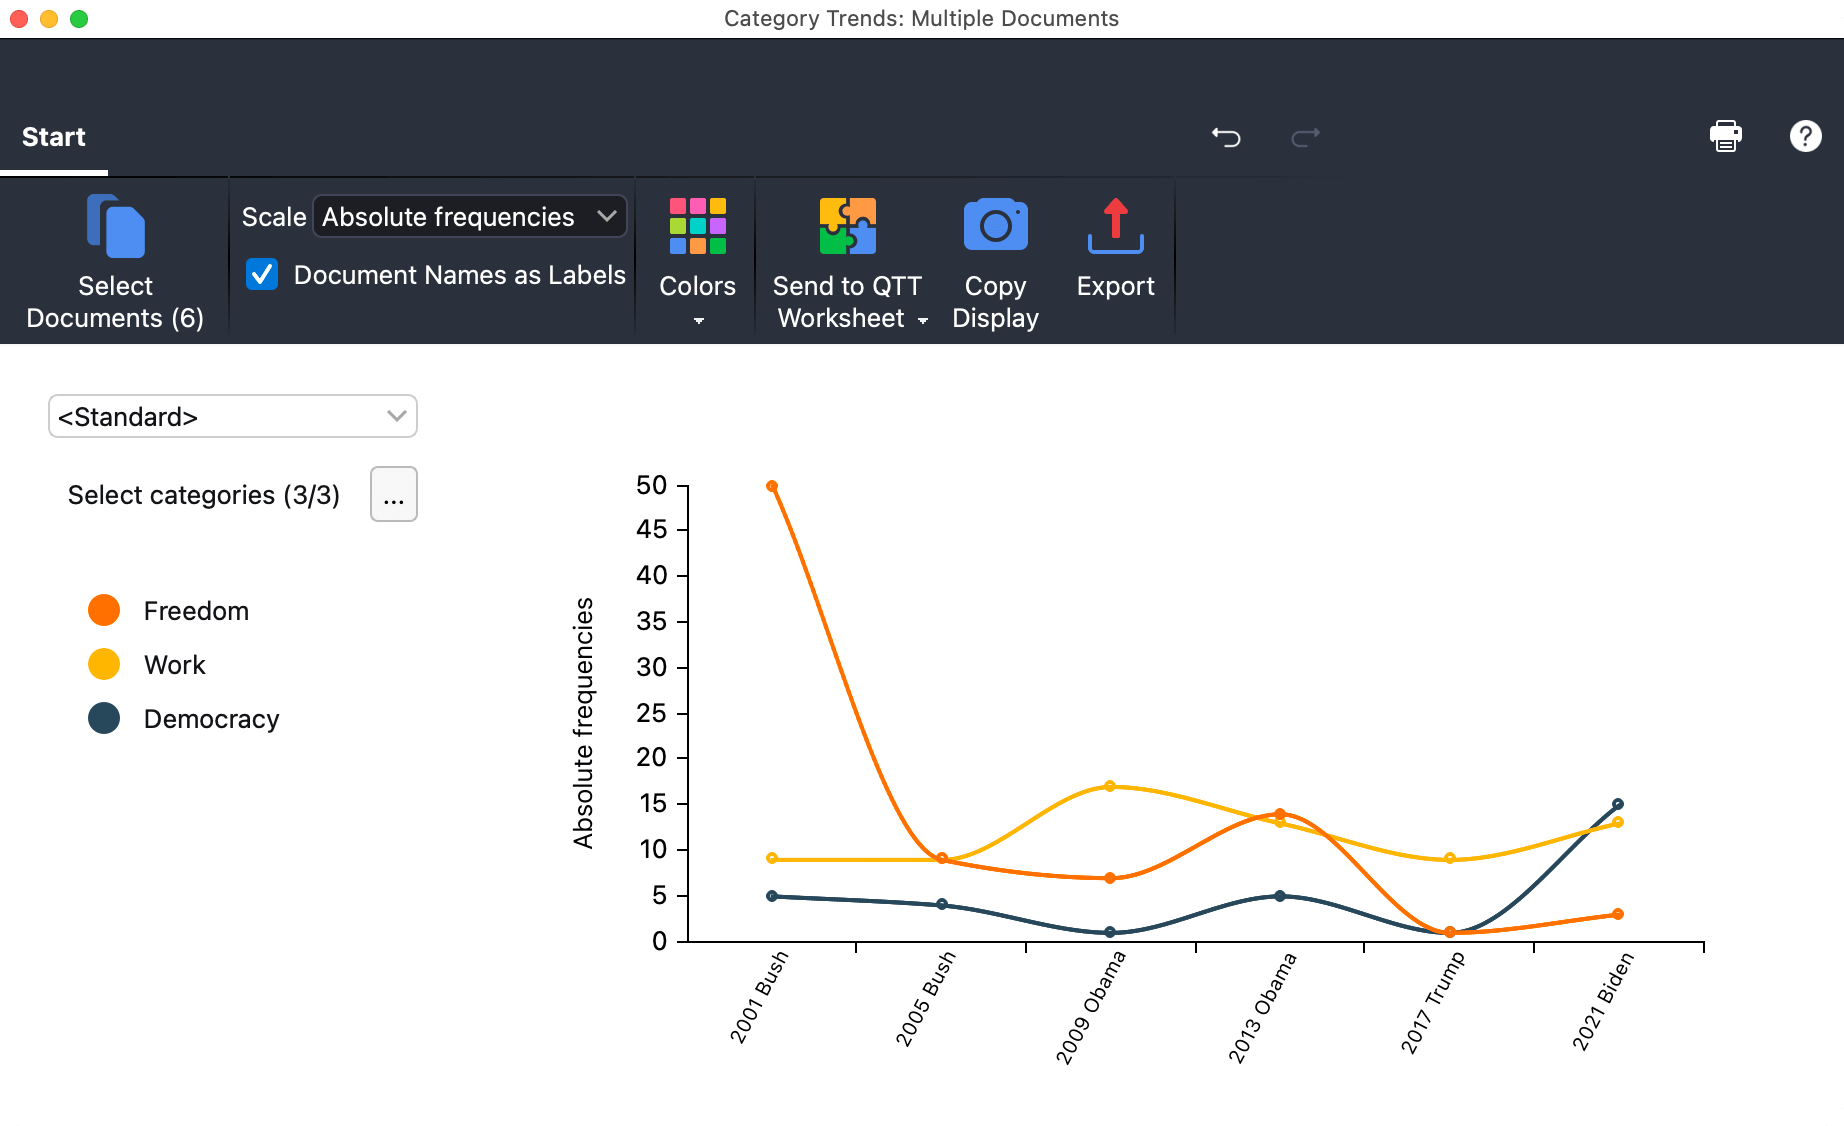
If you call Category Trends for multiple text documents, you can analyze how the usage of category search items changes across the texts. Category Trends for multiple texts is particularly useful for time series analysis where each document represents a point in time.

Create Category Trends for a single document
- Open the text document for which you want to analyze Category Trends.
- Select Visual Tools > Category Trends > Single Document from the main menu. The Category Trends window will open.
- In the left pane, select the dictionary whose entries you want to analyze. If you do not want to include all the categories of the dictionary, you can click the button with the three dots to deselect individual categories.
Create Category Trends for multiple documents
- Select Visual Tools > Category Trends > Multiple Documents from the main menu. The Category Trends window will open.
- Click the Select Document icon or button and specify which text document to include.
- In the left pane, select the dictionary whose entries you want to analyze. If you do not want to include all the categories of the dictionary, you can click the button with the three dots to deselect individual categories.
Options for analysis and presentation
The Start menu tab provides numerous options to customize the analysis and the results display:
- Scale — Switch between three variants:
Absolute frequencies (How often does a hit of a category appear?)
Category % (What percentage of all hits are from one category relative to the other categories?)
Coverage % (What percentage of the section/document does a hit occur in? If a word is found multiple times with different search terms, it is counted each time, which can lead to higher values for a category.). - Sections [only for single document] — Select the number of sections to be visualized.
- Display Document Names as Labels [only for multiple documents] – If enabled, the document names are displayed instead of consecutive numbers.
- Colors — Choose between different color schemes for the display.
List hits
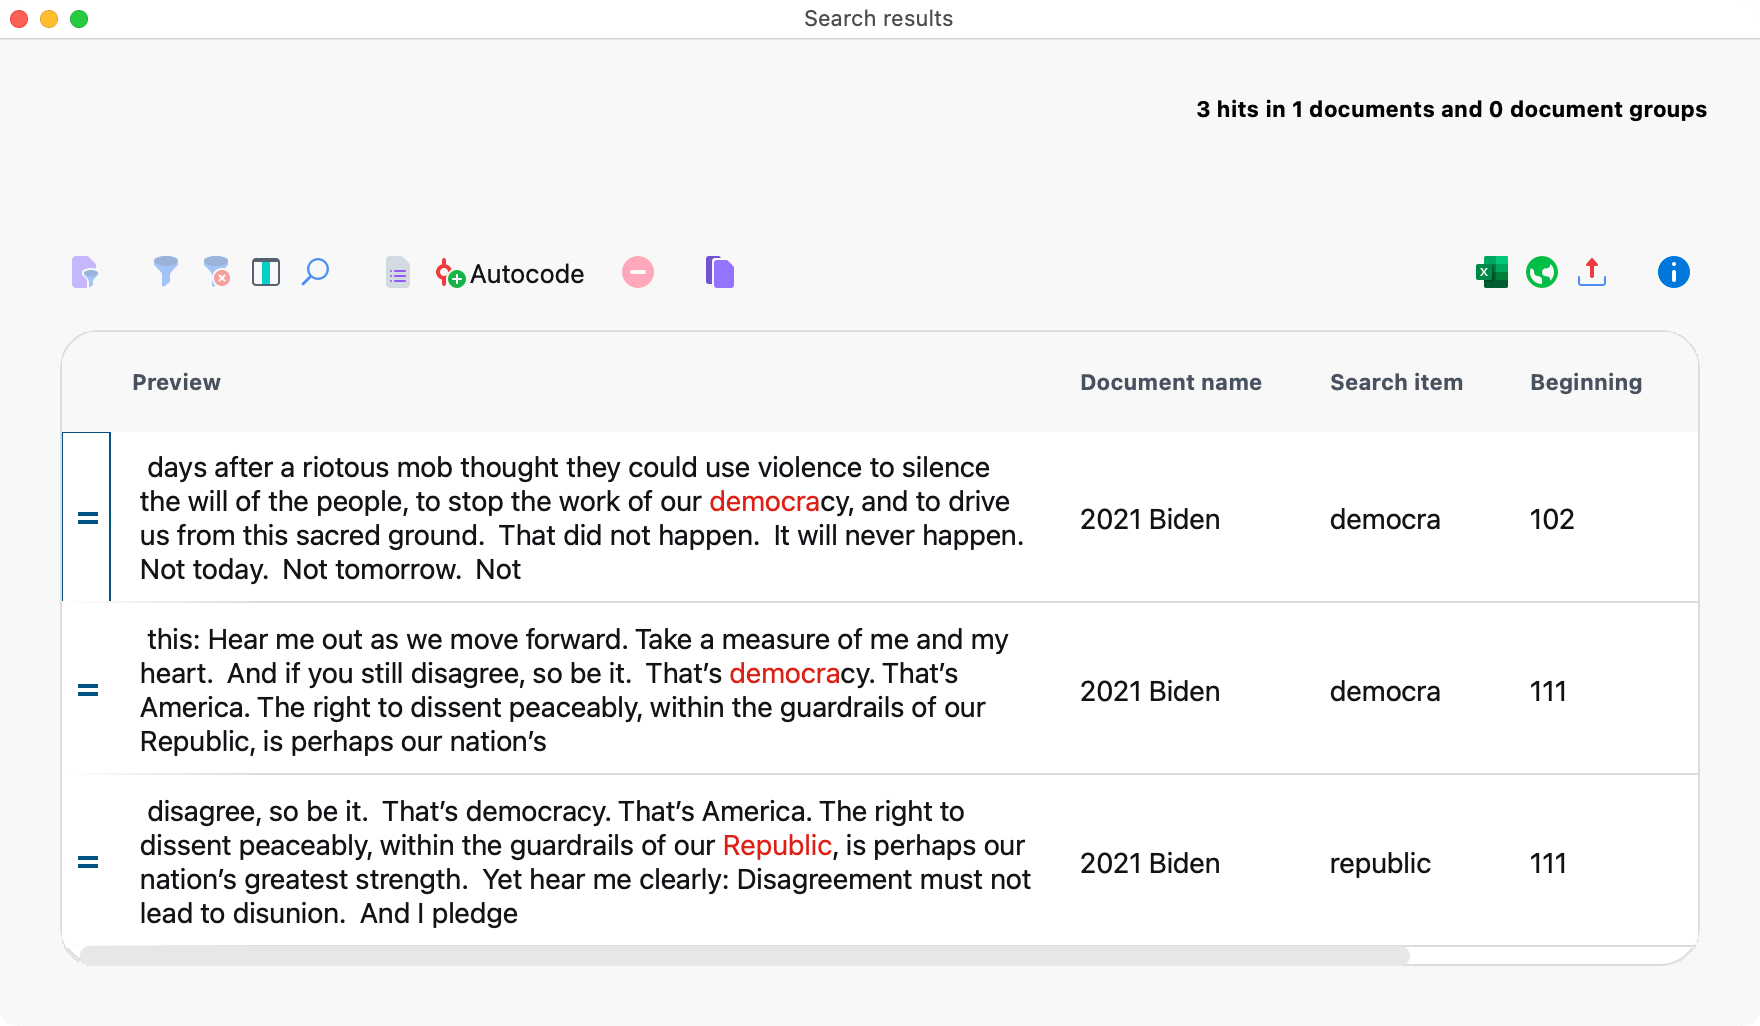
Click on a node in the chart to get a listing of hits in that section or document:


Test for uniform distribution
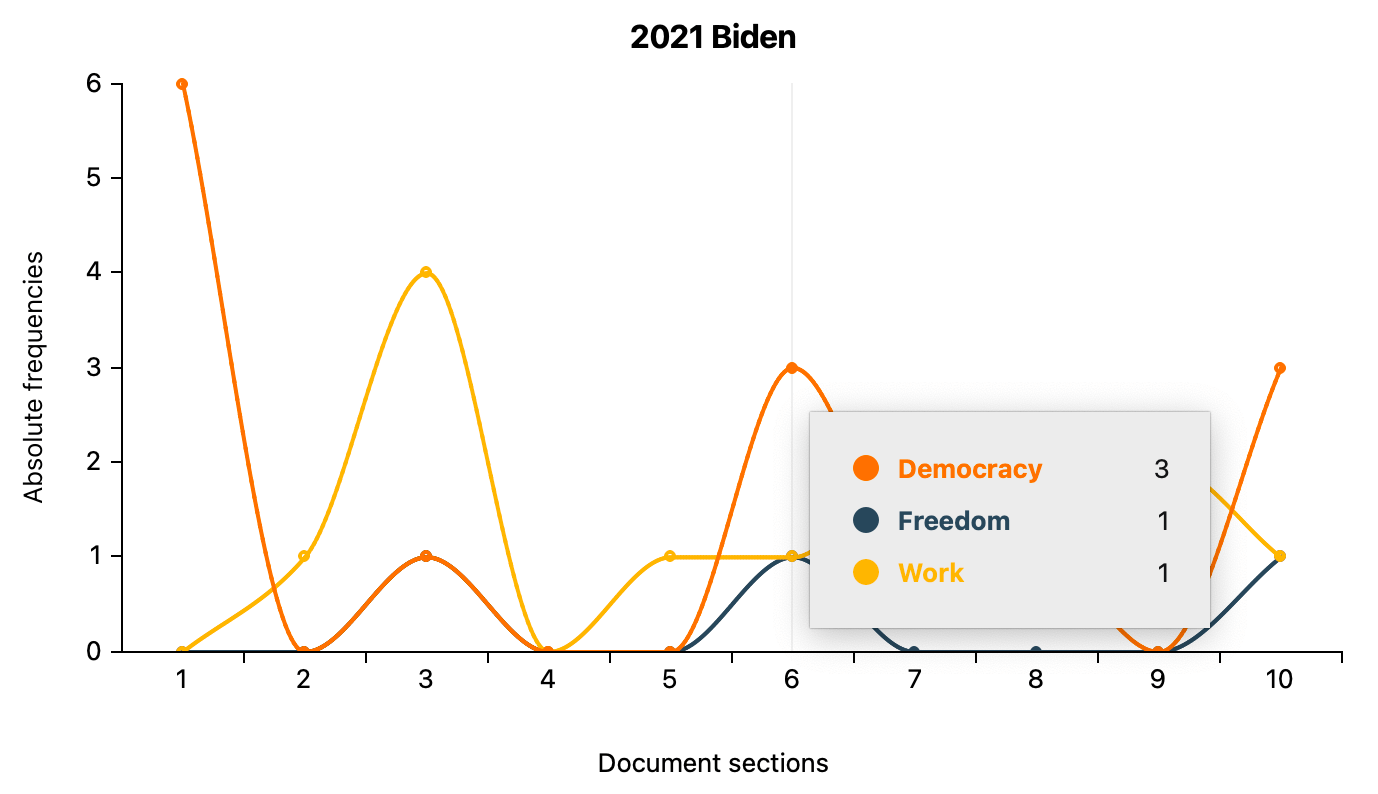
Hover over a category in the legend to get the results of a Chi-Square test for uniform distribution. The displayed Chi-Square value and the p-value allow you to assess to what extent the observed category frequencies match the hypothesis of a uniform distribution across all sections or documents. A p-value below 0.05 is generally considered an indicator of statistical significance, meaning that the observed category frequencies do not align well with an assumed uniform distribution.
Store results in a QTT worksheet
In the Questions – Themes – Theories window of MAXQDA, you can collect and comment on all the important results of your project. In the upper right corner of the Start menu tab of the Trends window, click on the icon ![]() Send to QTT Worksheet, to store the results in a new or existing worksheet. The current display will be saved as an image.
Send to QTT Worksheet, to store the results in a new or existing worksheet. The current display will be saved as an image.
Export and print results
![]() Copy Display — Copies the current view to the clipboard so that you can paste Word Trends into a software of your choice, for example, by using Ctrl-/cmd+V.
Copy Display — Copies the current view to the clipboard so that you can paste Word Trends into a software of your choice, for example, by using Ctrl-/cmd+V.
![]() Export — Exports the current view as a graphic file.
Export — Exports the current view as a graphic file.
![]() Print — By clicking on the printer symbol, also at the top right, the current view can be printed directly.
Print — By clicking on the printer symbol, also at the top right, the current view can be printed directly.
