Using Code Trends, you can analyze the frequency with which codes have been applied across documents. You may analyze a single or multiple documents.
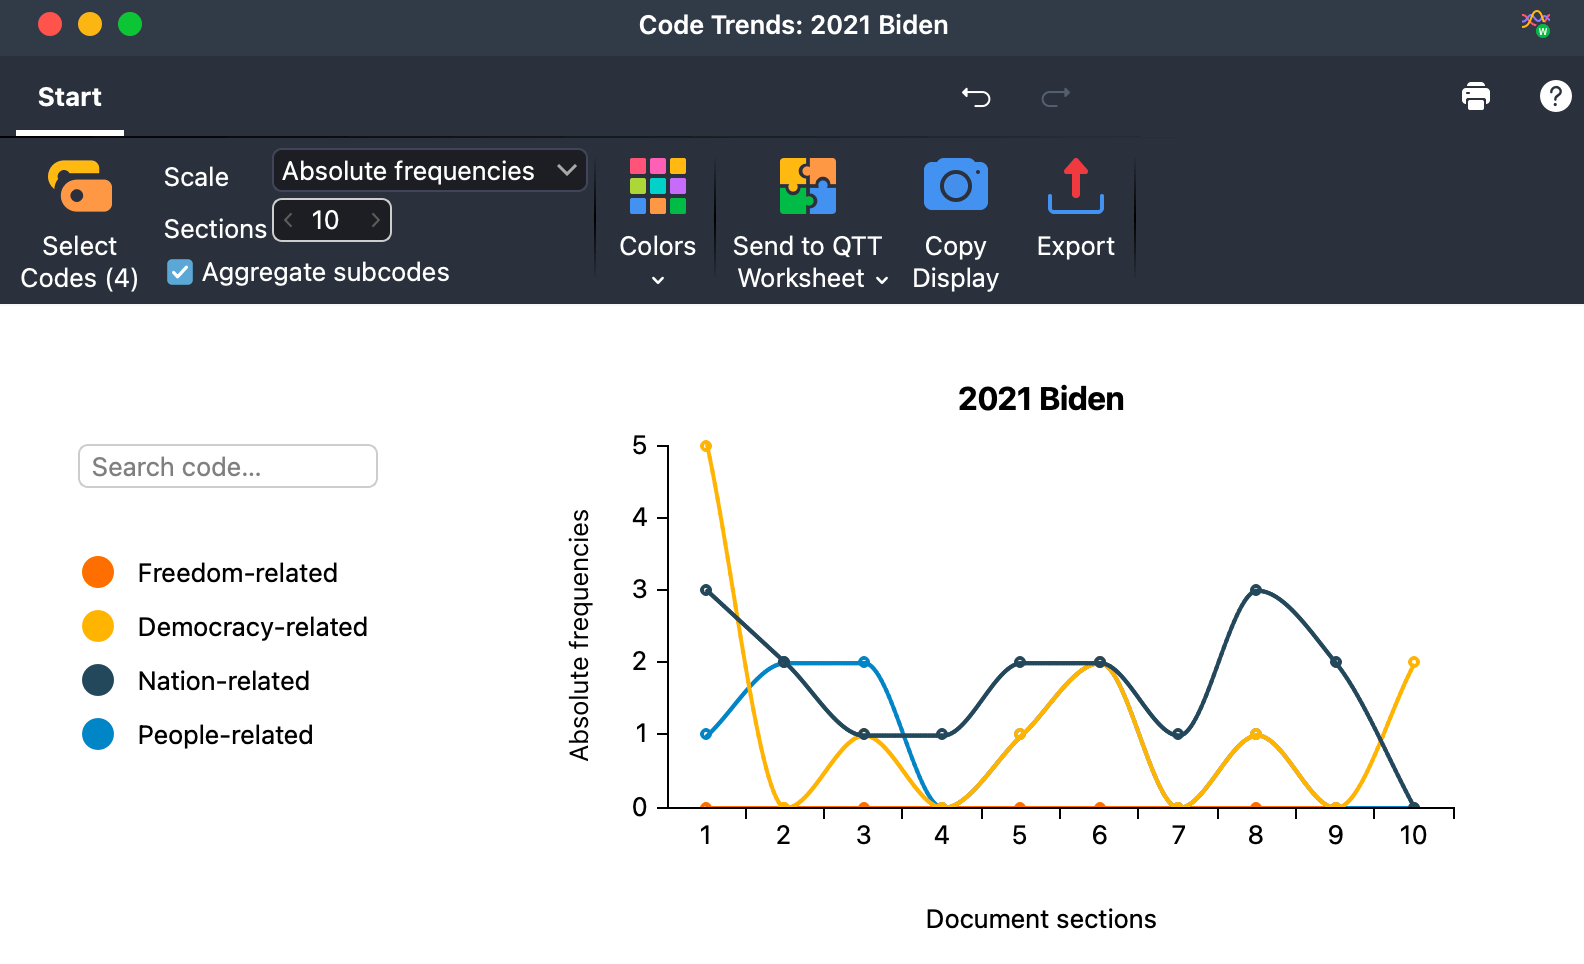
When analyzing a single document, the text is divided into sections of equal length, and the frequency of selected codes in each section is visualized in a line chart:

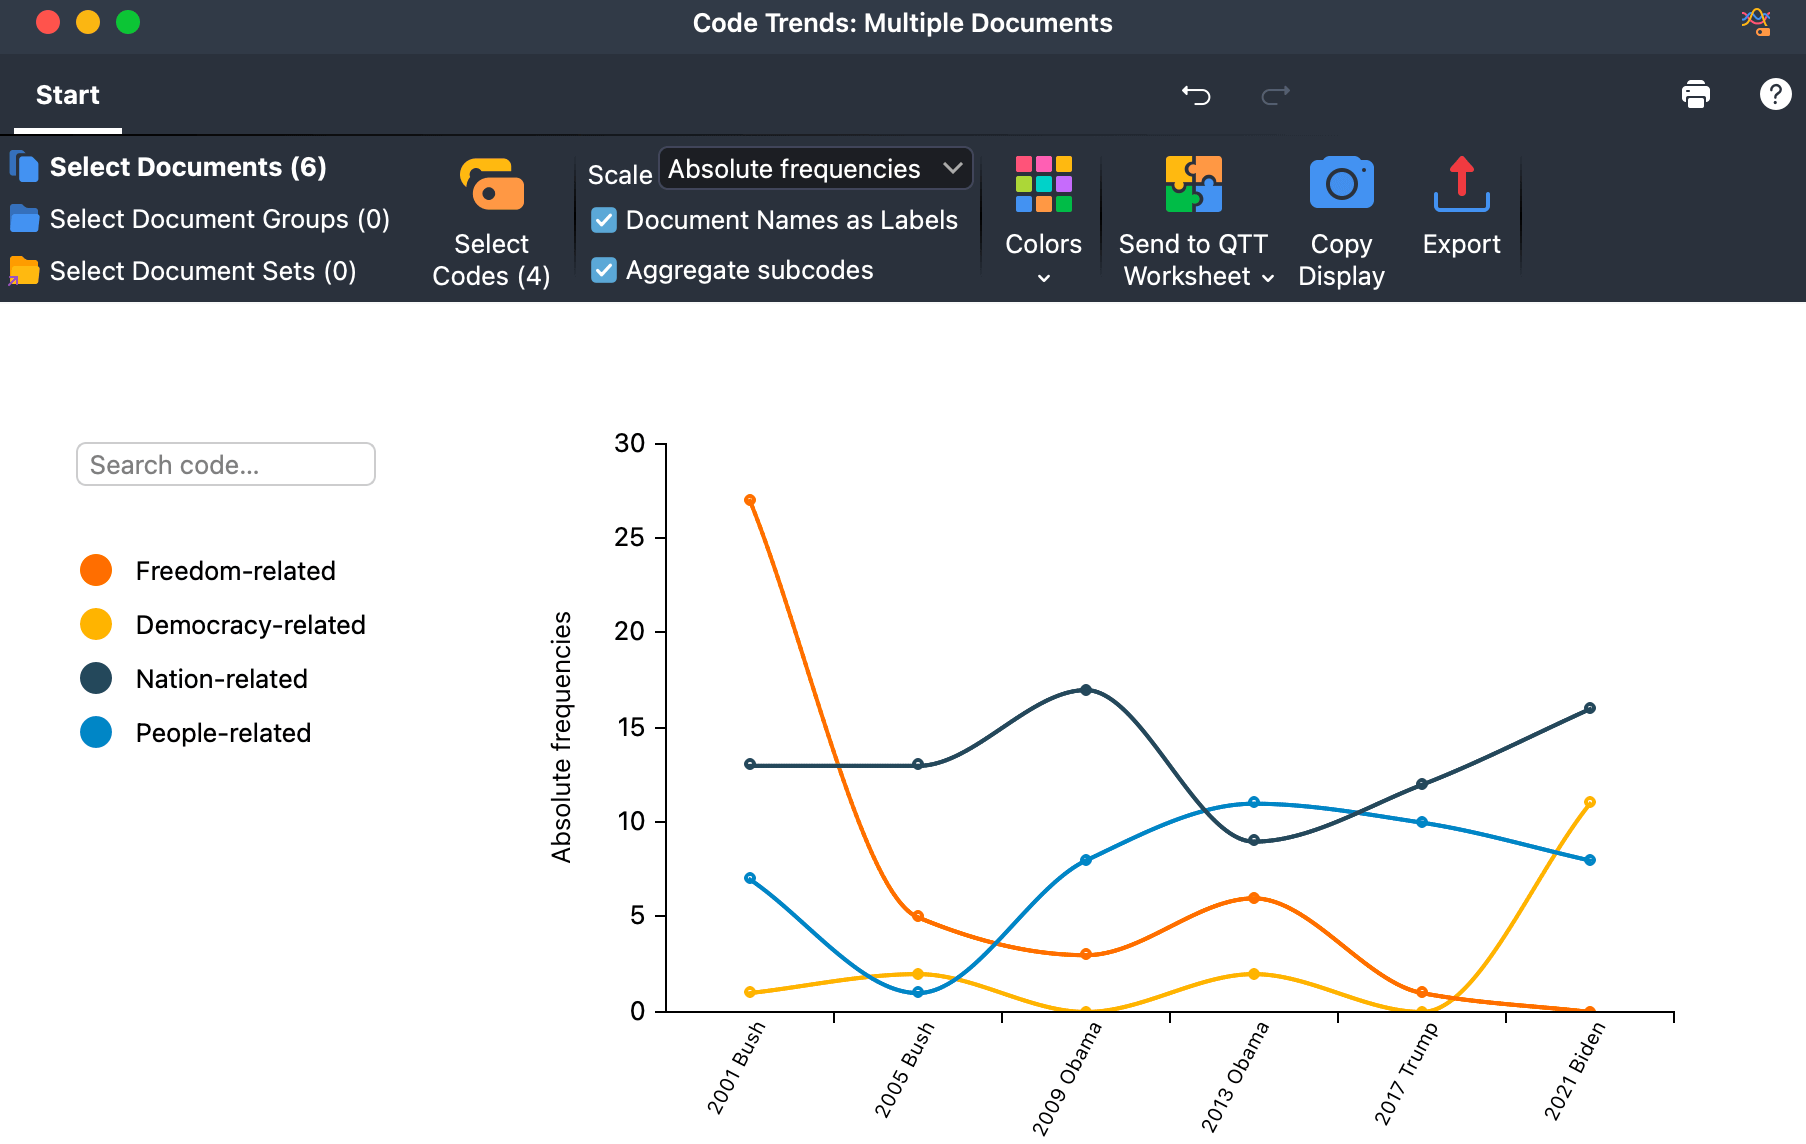
If you perform a multiple-document trend analysis, you can compare code trends across documents, document sets, or document groups. Code Trends for multiple documents can greatly aid time series analyses, where each document represents a point in time.

Steps for Code Trends for a single document
- Open a text or PDF document containing the codes you want to examine.
- Select Visual Tools > Code Trends > Single Document from the main menu. The Code Trends window will open.
- In the Start menu tab of the Code Trends window, click on the icon Select Codes to specify which codes to include.
Steps for Code Trends for multiple documents
- Select Visual Tools > Code Trends > Multiple Documents from the main menu. The Code Trends window will open.
- You can select between comparing documents, document groups, and document sets. Select the desired unit of comparison and specify which documents, groups, or sets to include in the analysis.
- In the Start menu tab of the Code Trends window, click on the icon Select Codes to specify which codes to analyze.
Options for analysis and presentation
The Start menu tab provides numerous options to customize the analysis and the results display:
- Scale — Switch between Absolute frequencies (How often has a code been applied in a section/document?) and Code coverage % (How much of the data is been coded with a code in a section/document?).
- Sections [only for single document] — Select the number of sections to be visualized.
- Display Document Names as Labels [only for multiple documents] — If enabled, the document names are displayed instead of consecutive numbers.
- Colors — Choose between different color schemes for the display. Here, you can also select the Code colors suboption to apply the colors of the code system.
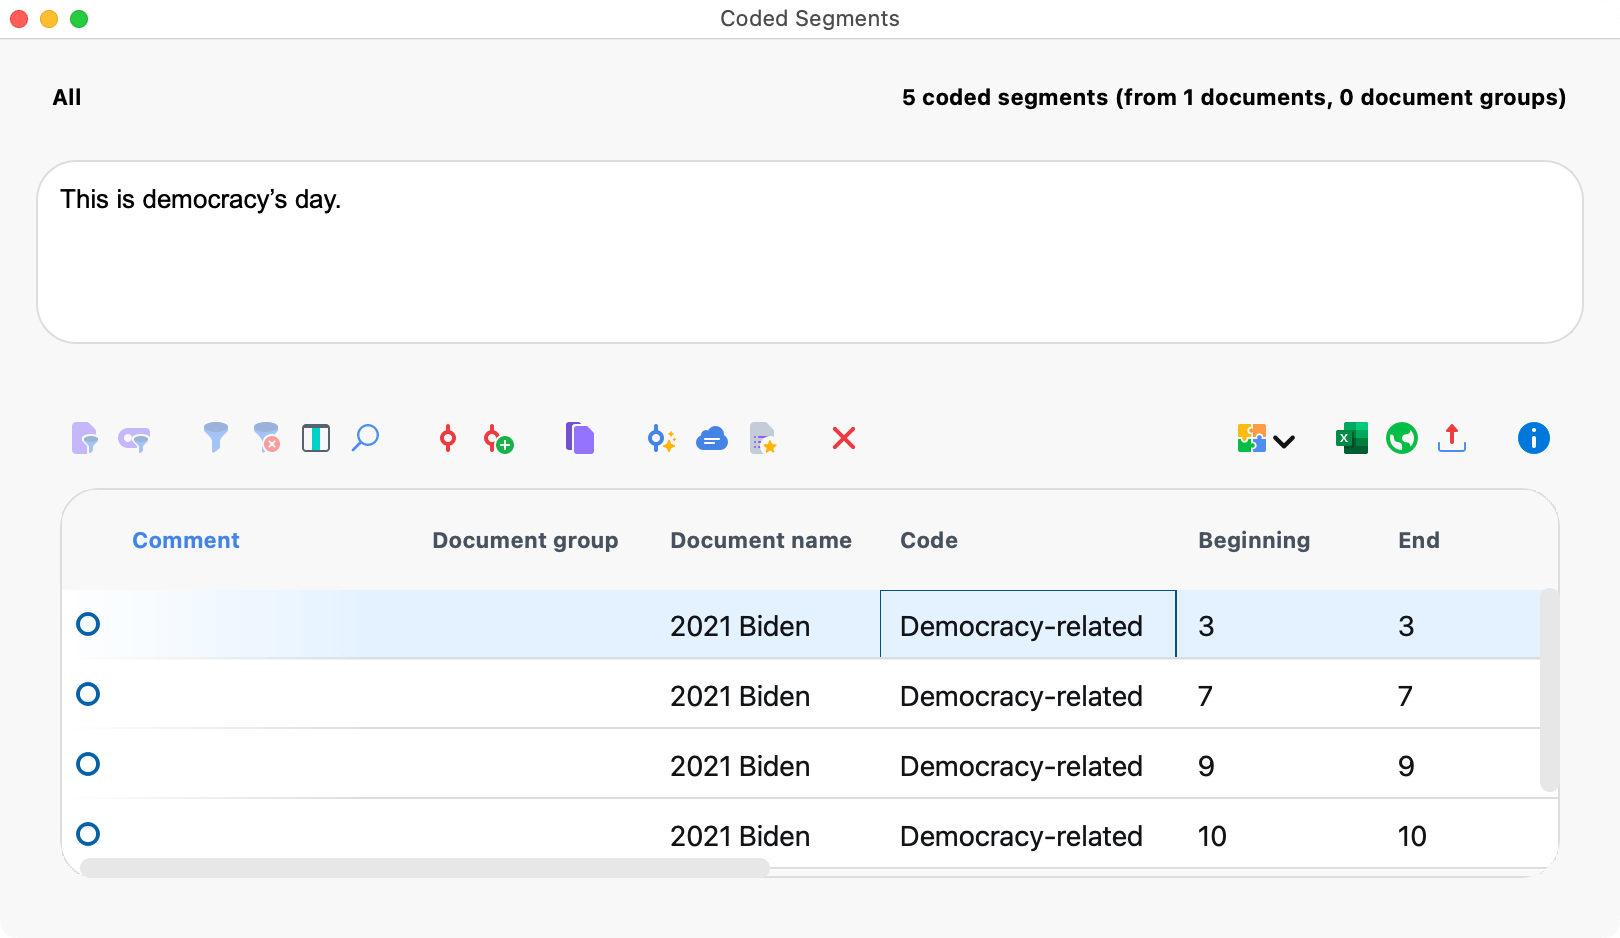
List the coded segments
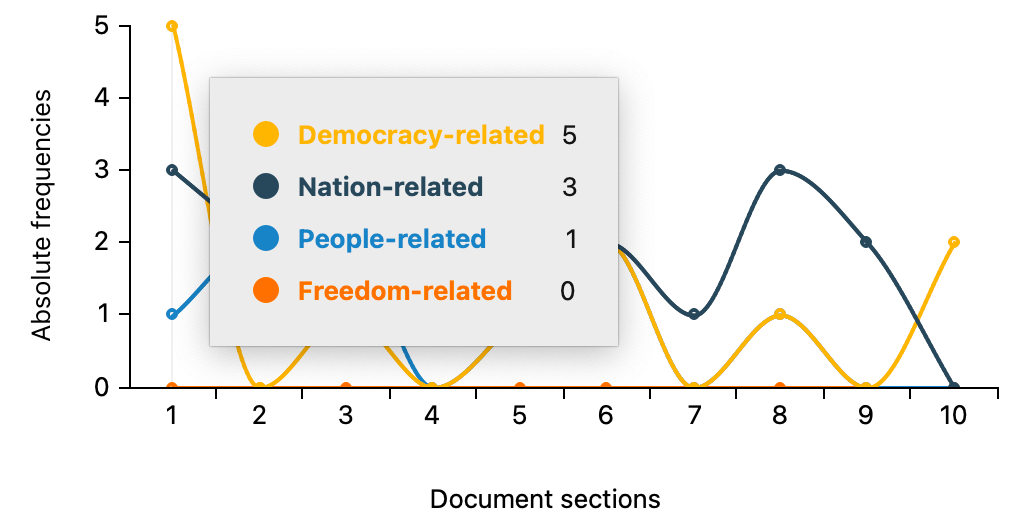
Click on a node in the chart to get a listing of coded segments in that section or document:


Store output in a QTT worksheet
In the Questions – Themes – Theories window of MAXQDA, you can collect and comment on all the important results of your project. In the upper right corner of the Start menu tab of Code Trends, click on the icon ![]() Send to QTT Worksheet, to store the results in a new or existing worksheet. The current display will be saved as an image.
Send to QTT Worksheet, to store the results in a new or existing worksheet. The current display will be saved as an image.
Export and print output
On the top right of the Code Trends window, you will find various options to export the current view, for example, to insert it into your results report:
![]() Copy Display — Copies the current view to the clipboard so that you can paste Word Trends into a software of your choice, for example, by using Ctrl-/cmd+V.
Copy Display — Copies the current view to the clipboard so that you can paste Word Trends into a software of your choice, for example, by using Ctrl-/cmd+V.
![]() Export — Exports the current view as a graphic file.
Export — Exports the current view as a graphic file.
![]() Print — By clicking on the printer symbol, also at the top right, the current view can be printed directly.
Print — By clicking on the printer symbol, also at the top right, the current view can be printed directly.
