The MAXQDA Stats Variable List allows you to manage all the variables of a data set. This is the place to define the variable names and value labels, and also to set missing values for a variable. New variables can also be created in the Variable List.

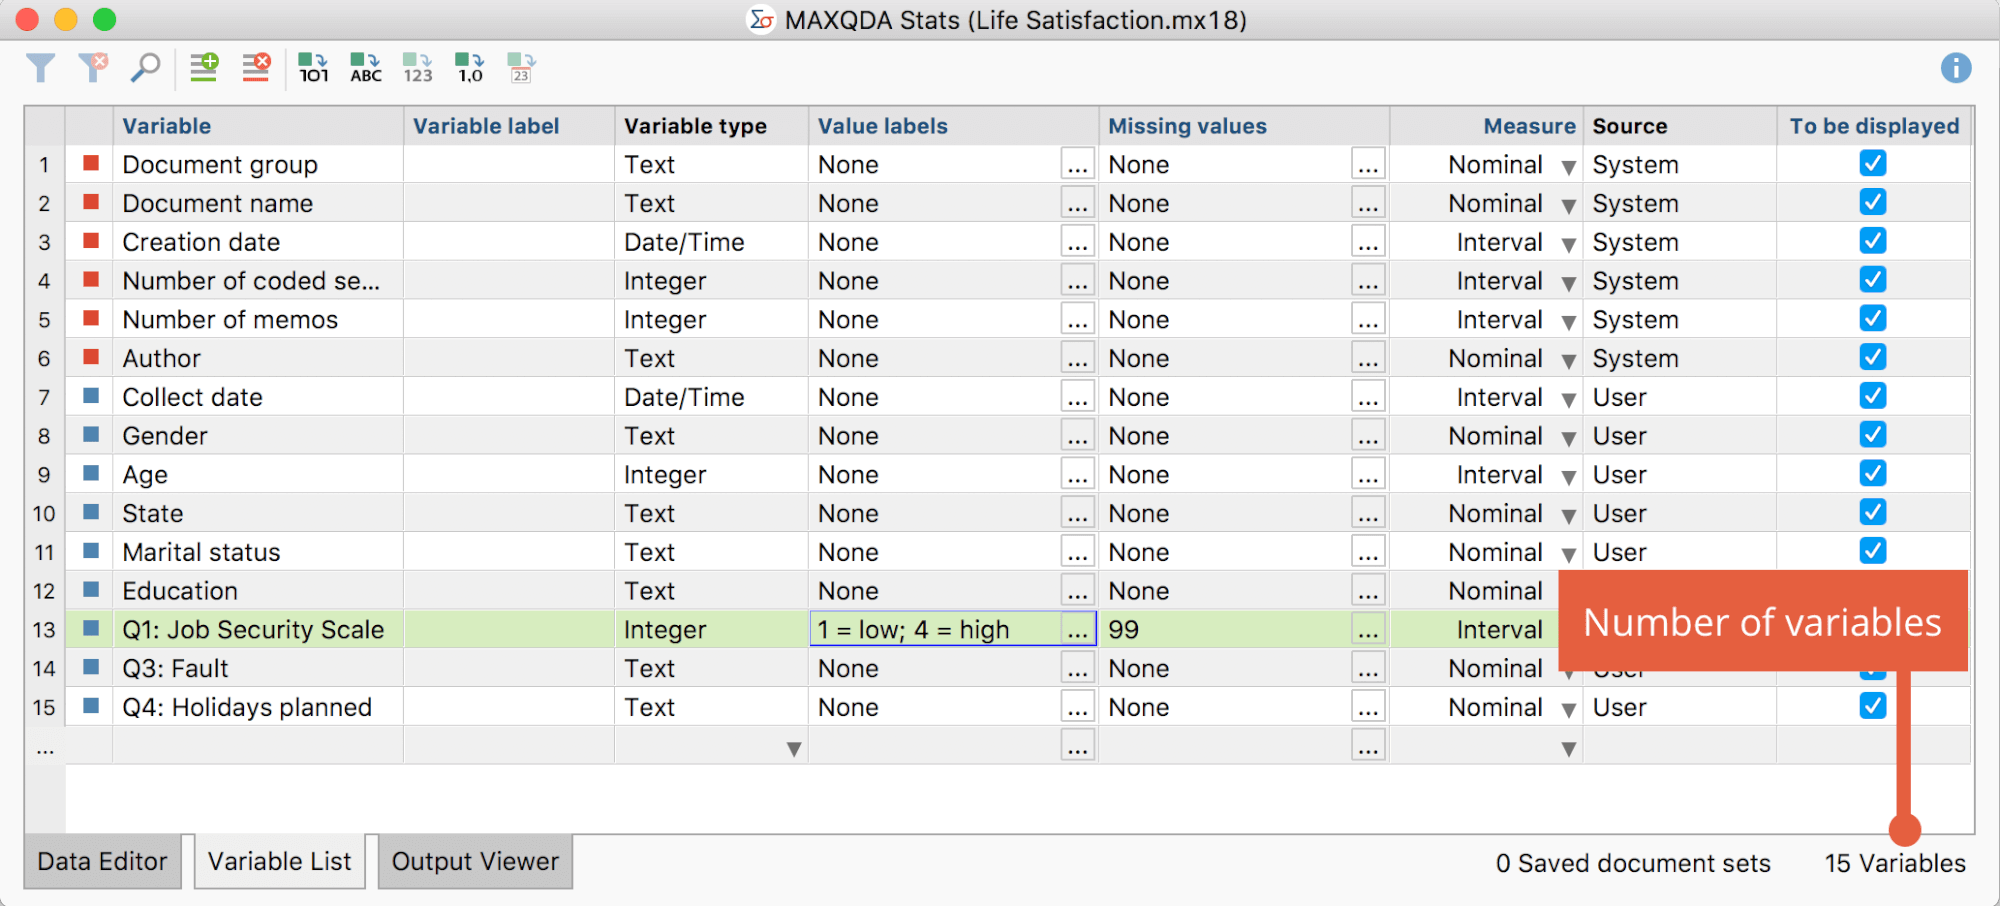
In the first column there is a consecutive numbering of the variables. The variables in the Data Editor are displayed from left to right, corresponding to this numbering. The number of variables in the current data set are displayed on the bottom right in the status bar.
The other columns include the following features:
Variable – This column is a mandatory column, meaning each variable requires a variable name. To create, for example, a frequency table or a crosstab, you can select the name of individual variables.
Variable label – In addition to the variable name, it is possible to assign a label to a variable. In MAXQDA this label can be up to 255 characters in length and include any character. The variable label will appear in selection dialogs and results tables in the place of the variable name for easier interpretation.
Variable type – The same types of variables can be used in MAXQDA and MAXQDA Stats: text, integer, floating point, date/time, and Boolean (true/false).
Value labels – In statistical data sets, answers are often coded with numbers, for example 1 for “low” and 4 for “high”. Assignment of texts to the encoded numbers is done via value label and will appear in this column. At the top of the figure it is shown that for the marked variable “Q.1. Job Security Scale” the text labels “low” and “high” were assigned for the scale endpoints 1 and 4.
Missing values – In this column, the values are displayed which are to be counted as missing for the respective variable and therefore not to be included in the analysis.
Measure – Here you can set the measurement level of a variable. You can choose between three levels: “Interval”, “Ordinal” and “Nominal”.
Source – This column provides information about the origin of a variable. Variables automatically generated in MAXQDA carry the identifier “System”, user-defined variables carry the identifier “User”. Variables with the origin “Code” are codes to which the function “Transform into document variable” was applied in a MAXQDA project. Variables carrying the identifier “Dictio” are the result of a dictionary-based enumeration of category frequencies using MAXDictio.
To be displayed – From this column, you can control the display of variables in the Data Editor. To hide a column, remove the check mark by clicking a cell.
Sorting the variable list
Click on a column header to sort the list of variables corresponding to the clicked column. To restore the original order, click on the first column with the numbering.
To adjust the order of the variables, follow these steps:
- If the first column is not sorted in ascending order, first click the first column header to reset the current sorting.
- Now you can move individual variables by clicking in any row and moving the row to the desired location. To move multiple rows at the same time, hold down the Ctrl or Cmd key as you click on the desired rows, then drag the multi-row highlighted area with the left mouse button.
Adding new variables
You can add new variables by entering data in the blank bottom row of the Variable List:
- Double click in the last blank row of the “Variable” column. MAXQDA Stats will automatically generate a new generic variable name: “var001”, “var002” etc.
- Enter a new variable name in the “Variable” column and provide a variable label as required.
- In the “Variable Type” column, select one of the five variable types supported by MAXQDA Stats, which are the same as those supported by MAXQDA:
- Text
- Integer
- Floating Point
- Date/Time
- Boolean (true/false)
The new variable will be created once you have clicked on a location outside the row and this row is no longer highlighted. Data can now be entered in the Data Editor.
- If required, enter data in the columns “Value Labels,” “Missing Values,” and “Measure.”
A toolbar is located above the Variable List on the left:
Click on the icon New variable ![]() to automatically jump to the last row of the Variable List, where you can immediately start typing a variable name.
to automatically jump to the last row of the Variable List, where you can immediately start typing a variable name.
Copying variables
Copying variables can be very helpful, particularly when defining multiple nearly identical variables in an item set or matrix question:
- Highlight one or more variables by clicking on the appropriate row or clicking and holding the Ctrl/cmd key to select multiple rows.
- Right-click on the highlighted area and select Copy variable or press Ctrl+C (Windows) or cmd+C (Mac).
- Right-click on the target line and select the function Insert variable above.
When the variable is copied, the variable label, variable type, value label, missing values and measure will be copied, however the values will not.
Defining value labels
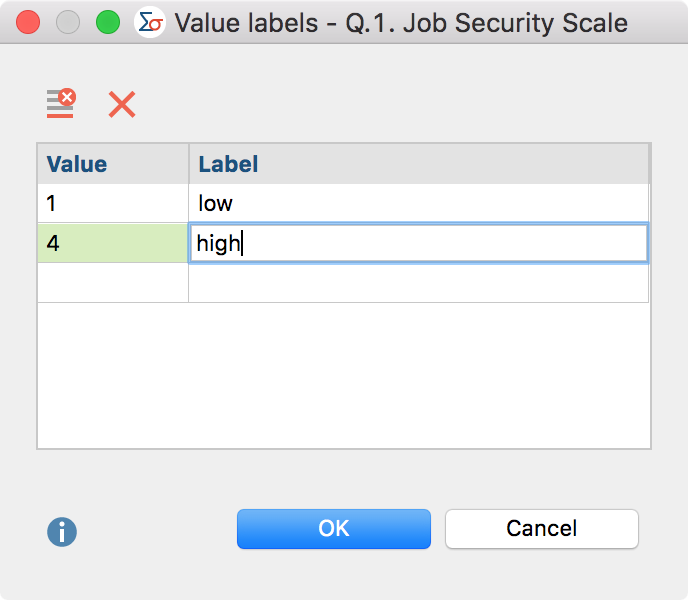
Value labels are used to match a text to a numerical variable value. For example, if the endpoints of a response scale to the question “Safety of your workplace” are coded with 1=”Low” and 4=”High”, these responses can be switched between their numerical and text representations in the Data Editor.
By clicking a cell in the Value Label column, the following dialog box will appear.

In the left hand column, enter the value to be associated with the label on the right. Normally the value is a number, but you can also use any text string, for example “f” for “female” or “Man” for “Manager.” When you click OK the value label will appear in the appropriate cell in the Variable List.
Using the two Delete icons at the top of the window, you can delete single or all entries.
Defining missing values
There are many reasons why missing values may be present in a data set: A respondent did not answer a question or refused to answer a question, or their response is not clear, for example in a handwritten questionnaire an X was placed exactly between two responses. To denote missing values, there are two main options: a) The data field is left blank, in which case the missing value will be considered “System defined missing” and ignored in the evaluation, or b) A specific value can be provided to interpret the missing value.
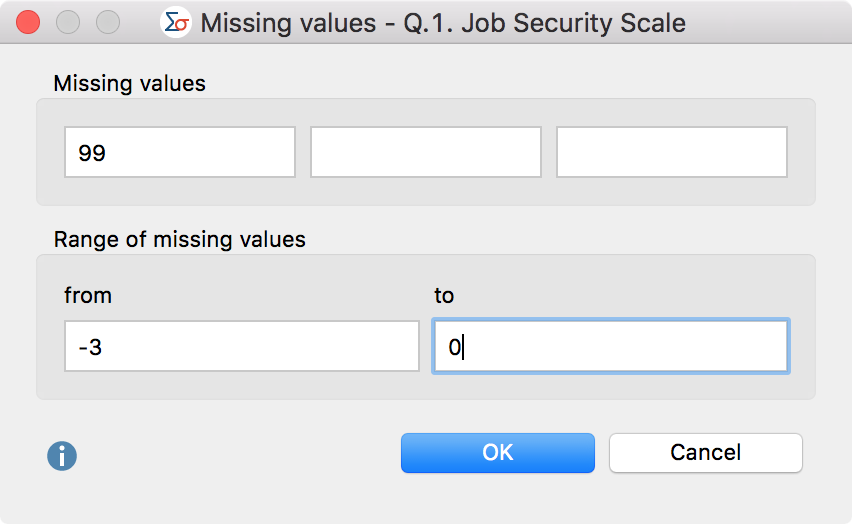
To define a missing value, click in the cell of the missing value to call up the following window:

In this window, single missing values or a range of missing values can be entered. All entries in the window are always considered; for example, in the above window, the 99th values as well as the values from -3 to 0, inclusive, will be ignored in the evaluation.
Searching and filtering variables
The Variable List in MAXQDA Stats can be searched and filtered exactly as in MAXQDA. Clicking on the Search ![]() icon in the toolbar at the top of the window opens a search list in which a search query can be entered, whose occurrence will be evaluated in all columns. To search in a specific column, right-click the column header and select Search.
icon in the toolbar at the top of the window opens a search list in which a search query can be entered, whose occurrence will be evaluated in all columns. To search in a specific column, right-click the column header and select Search.
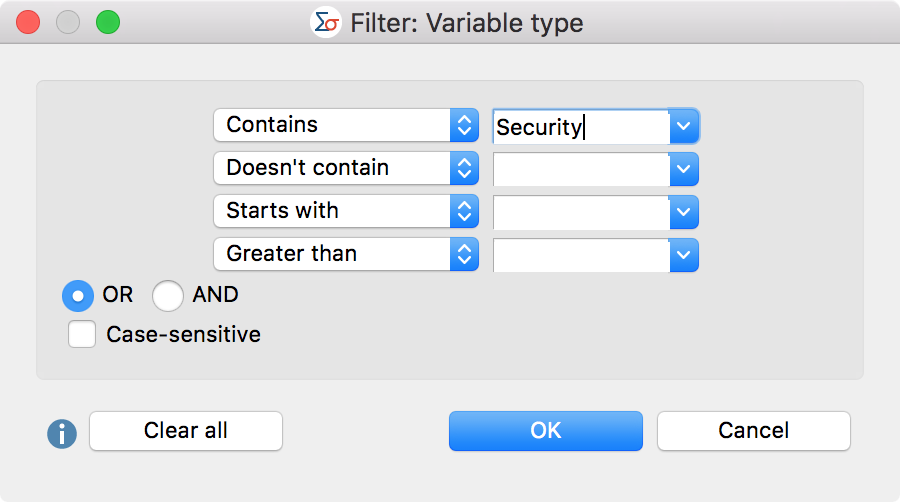
Likewise, the filter function can be applied to a specific column:
- Right-click on the column header.
- Select Filter.
- Enter the filter criteria and click OK.

The status bar at the bottom right of the window displays the number of variables that fulfill the selected criteria.
To turn the filter off and on as required, click the Filter ![]() icon in the toolbar above the Data Editor. By clicking the
icon in the toolbar above the Data Editor. By clicking the ![]() icon, all filters will be deleted.
icon, all filters will be deleted.
Changing the variable type
You can change the variable type at a later stage. To do this, select one or more rows with your mouse, and then click one of the icons at the top left corner of the toolbar (which conversion icons you can click will differ depending on the type of the selected variable).
![]() Convert to binary variable – All of the selected variable values that differ from 0 are set to "true", all others to "false" (including missing values and values defined as missing).
Convert to binary variable – All of the selected variable values that differ from 0 are set to "true", all others to "false" (including missing values and values defined as missing).
![]() Convert text variable – All of the selected variable values are retained and saved as text.
Convert text variable – All of the selected variable values are retained and saved as text.
![]() Convert to integer variable – All of the selected variable values with integers are stored as numbers. Other values are set to 0!
Convert to integer variable – All of the selected variable values with integers are stored as numbers. Other values are set to 0!
![]() Convert to floating-point number variable – All of the selected variable values with numbers are stored as floating point numbers with 2 decimal places. Other values are set to 0!
Convert to floating-point number variable – All of the selected variable values with numbers are stored as floating point numbers with 2 decimal places. Other values are set to 0!
![]() Convert to date variable – All of the selected variable values that correspond to a date format in the Data Editor are saved as a date. Other values are set to "empty"!
Convert to date variable – All of the selected variable values that correspond to a date format in the Data Editor are saved as a date. Other values are set to "empty"!
