To create a new frequency table, proceed as follows:
1. Select the menu function Descriptive Statistic > Frequencies.
2. In the window that appears, select the variables for which you would like to create frequency tables:
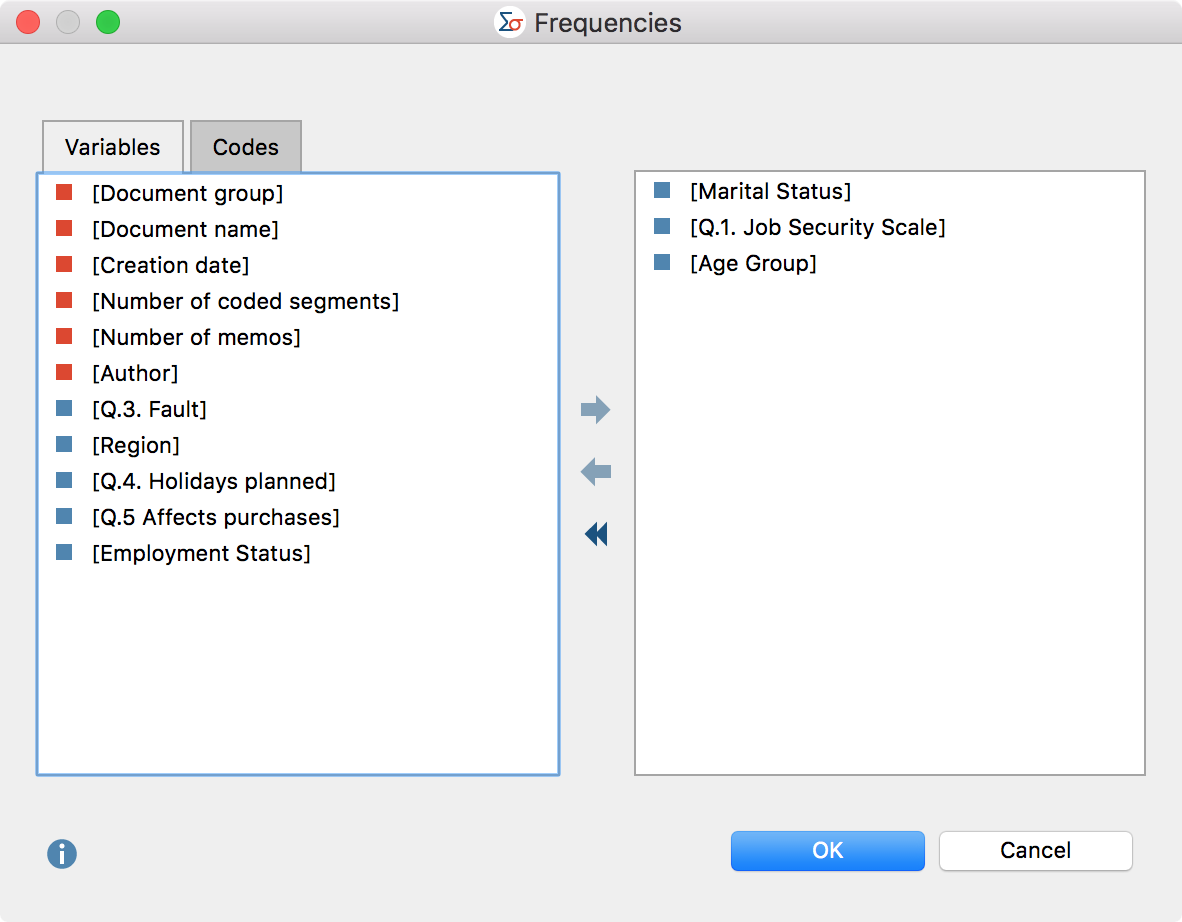
Variables can be selected in several ways:
- Double-click on a variable.
- Drag and drop the variable into the right window pane.
- Select one or multiple variables with the mouse by holding the Ctrl/Cmd key then drag the selection into the right window pane with the mouse, or click the blue arrow in the middle of the window.
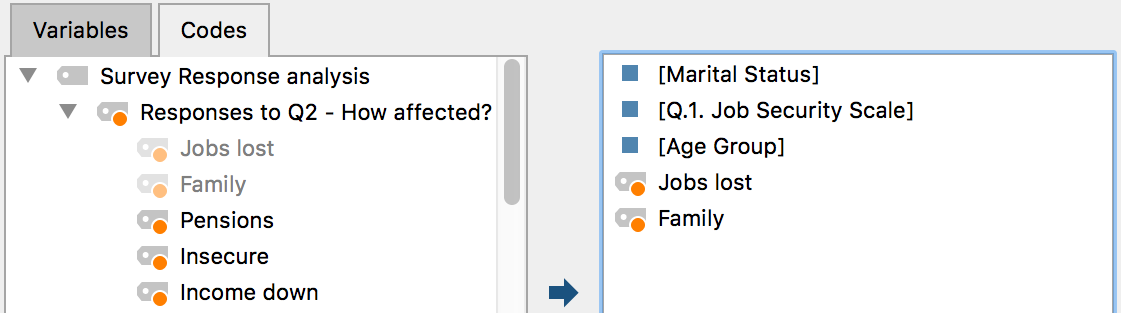
3. Switch to the “Codes” tab and select the codes for which you would like to create frequency tables. (This function is available only when MAXQDA Stats is launched from a MAXQDA project).
When you click OK, MAXQDA Stats creates a frequency table and displays it in a results view.
Opening frequency tables from the Data Editor
You can also open a frequency table for individual variables directly from the Data Editor. To do this, right-click on a column heading and select the entryFrequency Table.

Results table

The frequency table displays how many times the individual variables occur. For the variable “Job Security Scale” the value “low” was assigned in 45 cases, and the value “high” in 27 cases. The lower section of the table shows system-defined missing values (blank cells) as well as defined missing values. In the example above, there are 99 missing values, which occurred in 3 cases.
Overview of toolbar functions
In the upper section of the results window two toolbars are located, which contain the following important functions:
![]() Table view / Chart view – switches between table and chart view.
Table view / Chart view – switches between table and chart view.
![]() Previous/Next – using the blue arrow or the selection list, switch between the results table for previously selected variables or codes.
Previous/Next – using the blue arrow or the selection list, switch between the results table for previously selected variables or codes.
![]() Refresh – Calls up again the dialog for creation of frequency tables.
Refresh – Calls up again the dialog for creation of frequency tables.
![]() Insert into output viewer – inserts the currently displayed table or chart in the Output Viewer.
Insert into output viewer – inserts the currently displayed table or chart in the Output Viewer.
![]() Insert all into output viewer – inserts all created tables or charts in the Output Viewer.
Insert all into output viewer – inserts all created tables or charts in the Output Viewer.
![]() Copy to clipboard – copies the current table, highlighted area in the table, or chart in the clipboard, for example for insertion into Word.
Copy to clipboard – copies the current table, highlighted area in the table, or chart in the clipboard, for example for insertion into Word.
![]() Print – prints the currently displayed table or chart.
Print – prints the currently displayed table or chart.
![]() Export – exports the currently displayed table in Excel format, website (HTML) format or RTF format for Word and other word processing programs; exports the currently displayed chart in PNG, SVG or EMF (only Windows) format.
Export – exports the currently displayed table in Excel format, website (HTML) format or RTF format for Word and other word processing programs; exports the currently displayed chart in PNG, SVG or EMF (only Windows) format.
![]() Show value labels – this option is selected by default and causes the defined value label of a variable to be displayed in the place of the value of the variable.
Show value labels – this option is selected by default and causes the defined value label of a variable to be displayed in the place of the value of the variable.
![]() Descriptive statistics – this option is available only for integer and floating point type variables as well as for codes and displays a window with descriptive statistics for the displayed frequency tables.
Descriptive statistics – this option is available only for integer and floating point type variables as well as for codes and displays a window with descriptive statistics for the displayed frequency tables.
![]() Undo changes – step-by-step resetting of changes to a table (deletion of rows, merging and moving of rows).
Undo changes – step-by-step resetting of changes to a table (deletion of rows, merging and moving of rows).
![]() Redo – step-by-step restoring of changes to a table.
Redo – step-by-step restoring of changes to a table.
Sort tables and customize columns
Tables can be sorted by clicking a column header, in ascending order with the first click and descending order with the second. Clicking again will restore the original order.
Column widths can be adjusted with the mouse, and their position can be changed by clicking the column header then dragging them to the desired location with the mouse.
Delete rows
The results table is interactive and one or more rows can be removed, for example to restrict the evaluation to selected variables. Right-click a row and select Delete. You can also select multiple rows to delete by holding down the Ctrl/cmd key.
In this way, you can also remove the missing values from the display:

The table will be automatically updated.
Merge values
The interactive results table also allows you to merge multiple values:
- Highlight at least two rows by holding down the Ctrl/cmd key as you click on the desired rows with the mouse.
- Right-click the selection and select Merge values.
In the following example, the two lowest values for the variable “Job Security Scale” are merged:

The table will be automatically updated.
Save documents as document set
If MAXQDA Stats is launched with the data from a MAXQDA project, the frequency of individual variable values corresponds to the number of documents in which these variable values occurred. In this case, a compilation of documents is present behind each frequency count. This compilation of documents can be saved as a document set in MAXQDA: Right-click on a row and select Save as document set.

Initially, MAXQDA stores such sets in the background. When you exit Stats, all document sets created during the analysis will be displayed, so you can select which document sets you wish to transfer to the MAXQDA project.

Calculate descriptive statistics for frequency tables
It is possible to request a table with the measures of the descriptive statistics for all frequencies of integer or floating-point type as well as for codes. When you click the ![]() Descriptive Statistics symbol the following window will appear, which contains typical measures for descriptive statistics.
Descriptive Statistics symbol the following window will appear, which contains typical measures for descriptive statistics.

When you click the Copy button, the table will be transferred to the clipboard for insertion into programs such as Word.
Transfer results table to Output Viewer
After the tables have been created and adapted according to your needs, they can be transferred to the Output Viewer from which they can later be exported together:
- Click the Insert into output viewer
 icon to transfer the currently displayed results table to the Output Viewer.
 - Click the Insert all result tables into output viewer icon to transfer all frequency tables to the Output Viewer.
If at least one of the tables was created for an integer or floating-point variable or a code, MAXQDA Stats will ask if you also wish to insert the descriptive statistics into the Output Viewer. If you agree, a table containing the descriptive statistics will be displayed below the results table.

Export and print results table
Several options for exporting and printing the currently displayed results table are available using the following symbols:
![]() Copy to clipboard – copies the entire table or selection to the clipboard, for example in order to paste it directly into Word.
Copy to clipboard – copies the entire table or selection to the clipboard, for example in order to paste it directly into Word.
![]() Print – starts the print process and displays a print preview, in which the settings such as margins, orientation, headers and footers can be applied.
Print – starts the print process and displays a print preview, in which the settings such as margins, orientation, headers and footers can be applied.
![]() Export – exports the table in Excel format, website (HTML) format or RTF format for Word and other word processing programs.
Export – exports the table in Excel format, website (HTML) format or RTF format for Word and other word processing programs.
Display frequencies as charts
Frequency tables can be displayed as column, bar, or pie charts. You can switch between chart and table views using the ![]() and
and ![]() icons.
icons.

You can customize the chart design and display by using the icons in the toolbar above the chart, as well as double-clicking and right-clicking on the elements of the chart. The size of the chart automatically adjusts to the window size. Enlarge the window to get a larger chart.
Frequency charts can be transferred to the Output Viewer for later export. In order to do so, use the following icons.
![]() Insert chart into output viewer, to insert only the current display
Insert chart into output viewer, to insert only the current display
![]() Insert all charts into output viewer, to insert charts for all created frequency tables at the same time.
Insert all charts into output viewer, to insert charts for all created frequency tables at the same time.
To export or print a chart directly, you can use the usual icons in the top right of the window:
![]() Copy to clipboard,
Copy to clipboard, ![]() Print and
Print and ![]() Export.
Export.