Guest post by Lukas Müller.
From Data Output to Analysis and Back Again
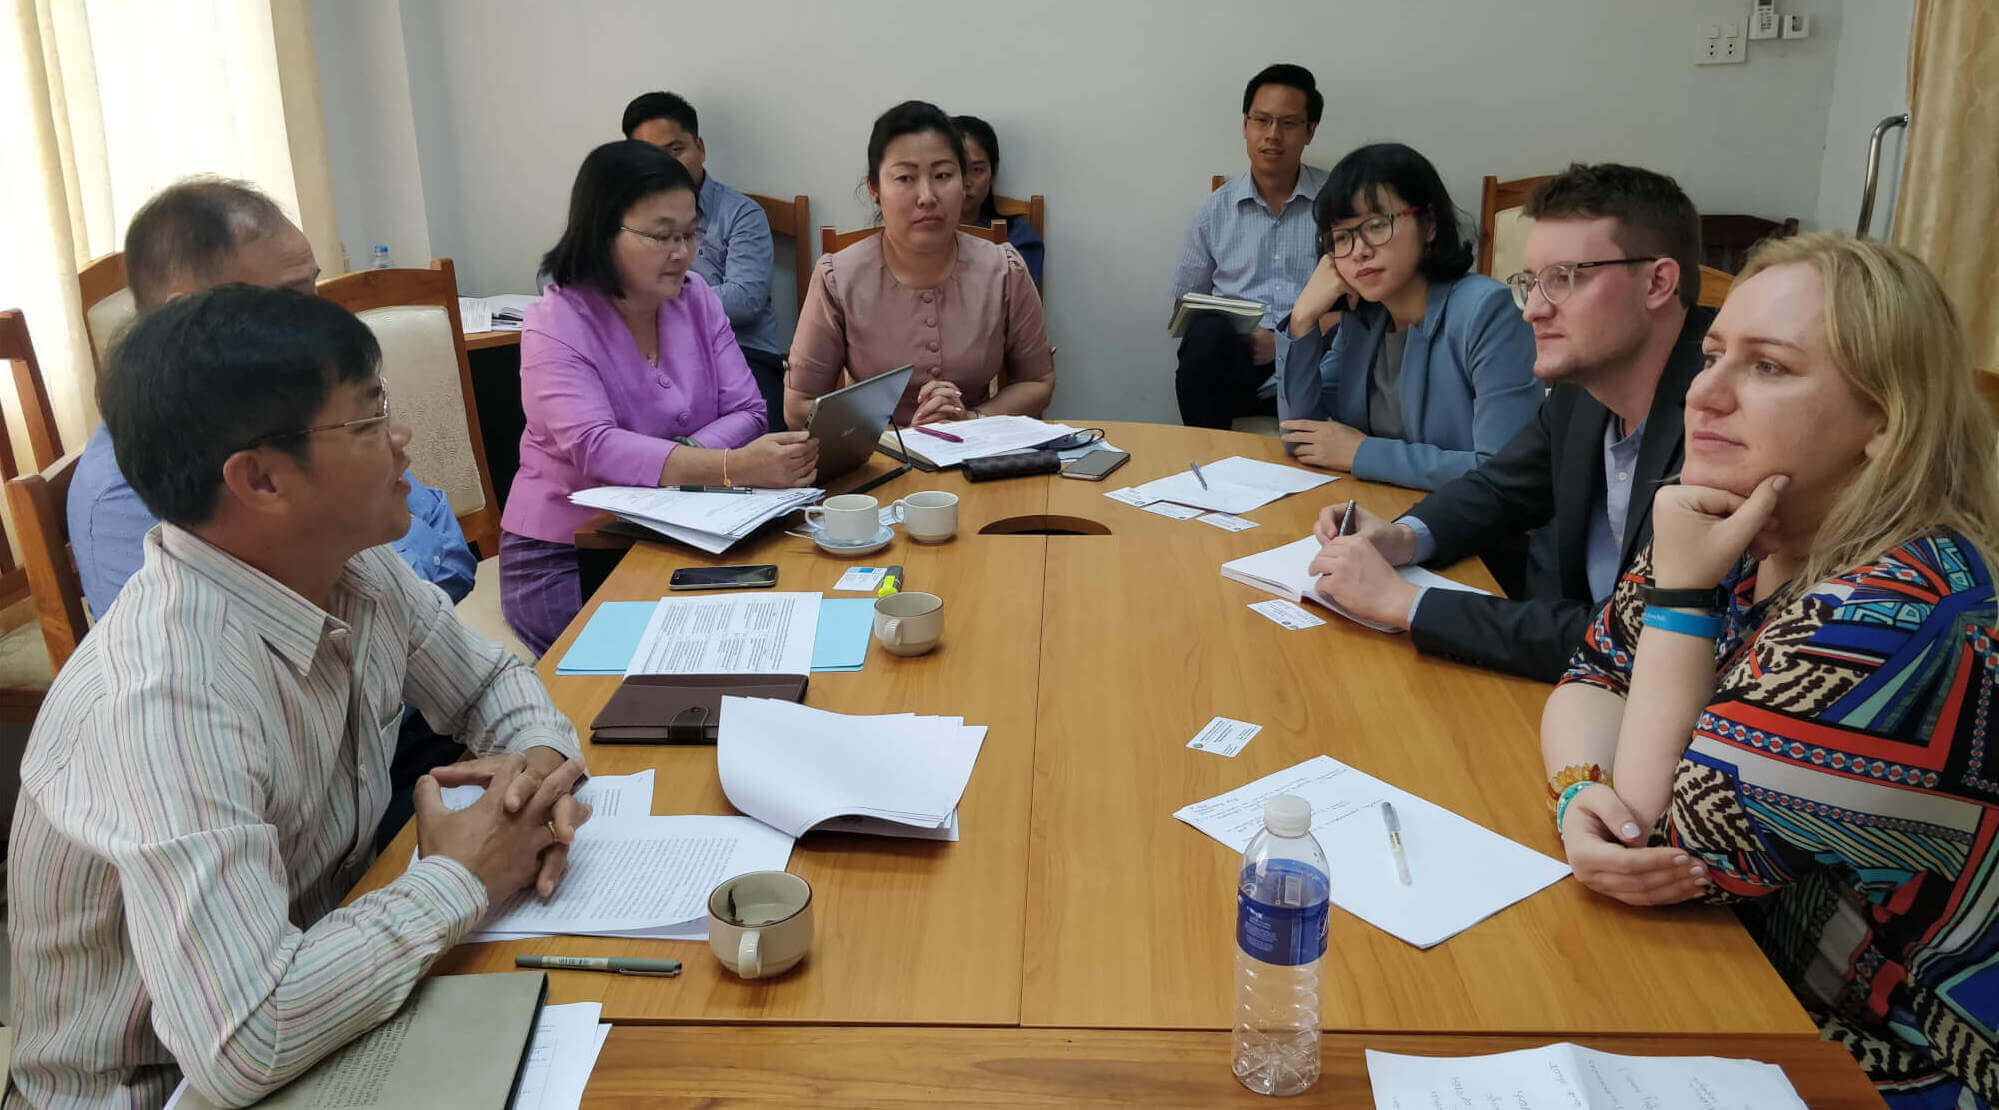
Meeting stakeholders at the Laotian Ministry of Science and Technology
In my last fieldwork diary entry I wrote about how, by using MAXQDA’s Code Matrix Browser and Complex Coding Query functions, I was able to test for the correlations of two distinct variables within my interview data. Given the large quantity of data I am analyzing, it is hugely important to have powerful analytical tools to retrieve the relevant pieces of data out of the copious interview transcripts that my research is based on.
But retrieving the relevant data is only the first step of the process; my ultimate interest lies in tracing the causal mechanisms driving the interaction between organizations. In the previous step of my analysis, I retrieved various pieces of information that suggested a correlation between organizational capacity issues within regional organizations and capacity building programs funded by external partners. Next, I’m interested in testing two things: (1) Are these two features actually mentioned as being connected within the interview material, and (2) is the correlation plausible as a causal relationship?
Fortunately, MAXQDA is a helpful tool in both of these pursuits. In this blog entry, I will outline how I am moving on from the data output of the Complex Query Function and towards a closer analysis of this data using the data output and moving on to the development of hypotheses using the MAXMaps function.
Correlation ≠ Causation
Analyzing about 15 documents (a subset of a total of 170), MAXQDA’s Complex Coding Query helped me identify 80 segments containing a correlation where the mention of an organizational capacity constraint and the description of a capacity building project occur within one paragraph of one another. I chose this very short distance between the two codes to ensure that only relevant segments would be included in the analysis. If interviewees talked about the capacity gap and a capacity building project at completely different points in the interview, likely reacting to different questions, it is questionable whether there would be a causal relationship between the two.
The number of segments is so large because I have decided to include subcodes in my analysis as well. Given that my research is explorative at this stage, individual codes used for analytical purposes often include multiple subcodes relating to more specific descriptions provided by interviewees. And, since I am testing for generalized correlation and causation at this point, using the overarching codes to establish causation has helped me to conduct broad searches prior to identifying more concrete relationships between specific subcodes later in my analysis. I will further explain just how complex some of these relationships are in the description of my work with MAXMaps below. Fortunately, MAXQDA offers you various ways to test these overarching codes, including or excluding their subcodes. The flexibility of these functions makes it possible for the researcher to tweak the data output until you have reached the required depth of analysis.
The Plural of Test is Proof
How various types of evidence in process tracing can be gathered using MAXQDA
As I wrote in my previous blog post, the method of process tracing can be compared to a crime scene investigation. Building a strong case for the preferred explanation for a situation requires various types of proof. In political science, this proof is provided by various tests, which help to build and strengthen your case either for or against different causal explanations of a single phenomenon. Process tracing commonly uses four types of test: (1) Straw-in-the-Wind, (2) Hoop, (3) Smoking-Gun, and (4) Doubly Decisive. Each test has various features and either strengthens or weakens the case for a given hypothesis. Without going into further detail on the method, it is sufficient to note highlight that interview data can provide various types of evidence.
The most common type, however, is the Hoop test, which can affirm the relevance of a hypothesis but cannot confirm it. It does, however, have the power to eliminate a hypothesis should the test prove unsuccessful. Why am I telling you this? Well, as scientists we are interested in collecting various types of proof for our hypotheses to make them as strong as possible. Using MAXQDA 2018, I can approach my data in various ways, gathering different types of evidence and conducting different types of tests. I will now describe two ways of using MAXMaps to highlight potential causal hypotheses that may not otherwise be visible.
From Data to Hypotheses
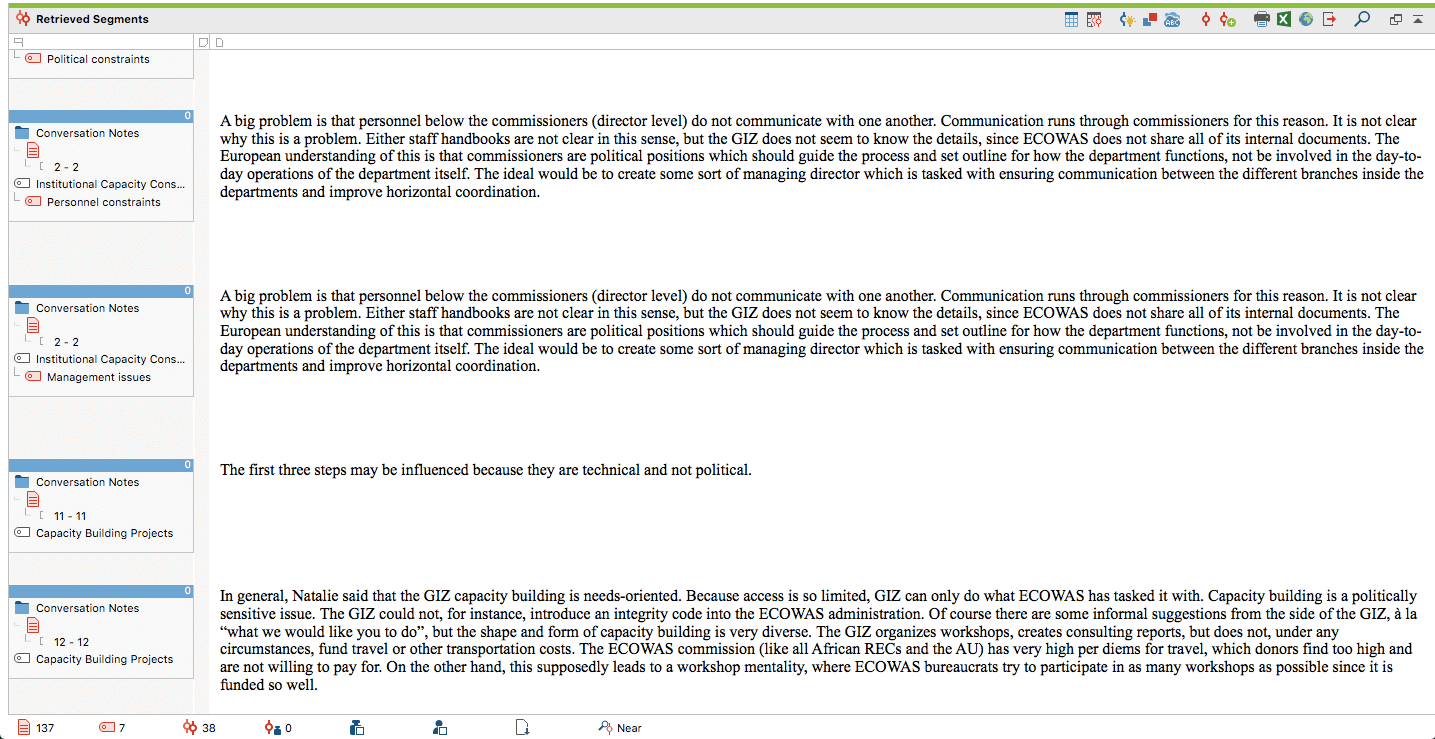
1: Data output using the Complex Coding Query function
Using MAXMaps to visualize data correlations and hypothesize causal mechanisms
The first way of using MAXMaps involves moving from the retrieved segments towards a visualization of the causal chains described by interview participants. The second way is another correlation test using a Co-Occurrence Model in MAXMaps, which provides another perspective on the same data.
In Screenshot 1 above, you can see which segments from the interview transcripts I retrieved using the Complex Coding Query. This map displays two descriptions of organizational capacity constraints (Personnel and Management) as well as two segments relating to the capacity building projects in question. In other words, the interview partner has mentioned both the problem present within the organization and the solution provided by external partners through capacity building projects.
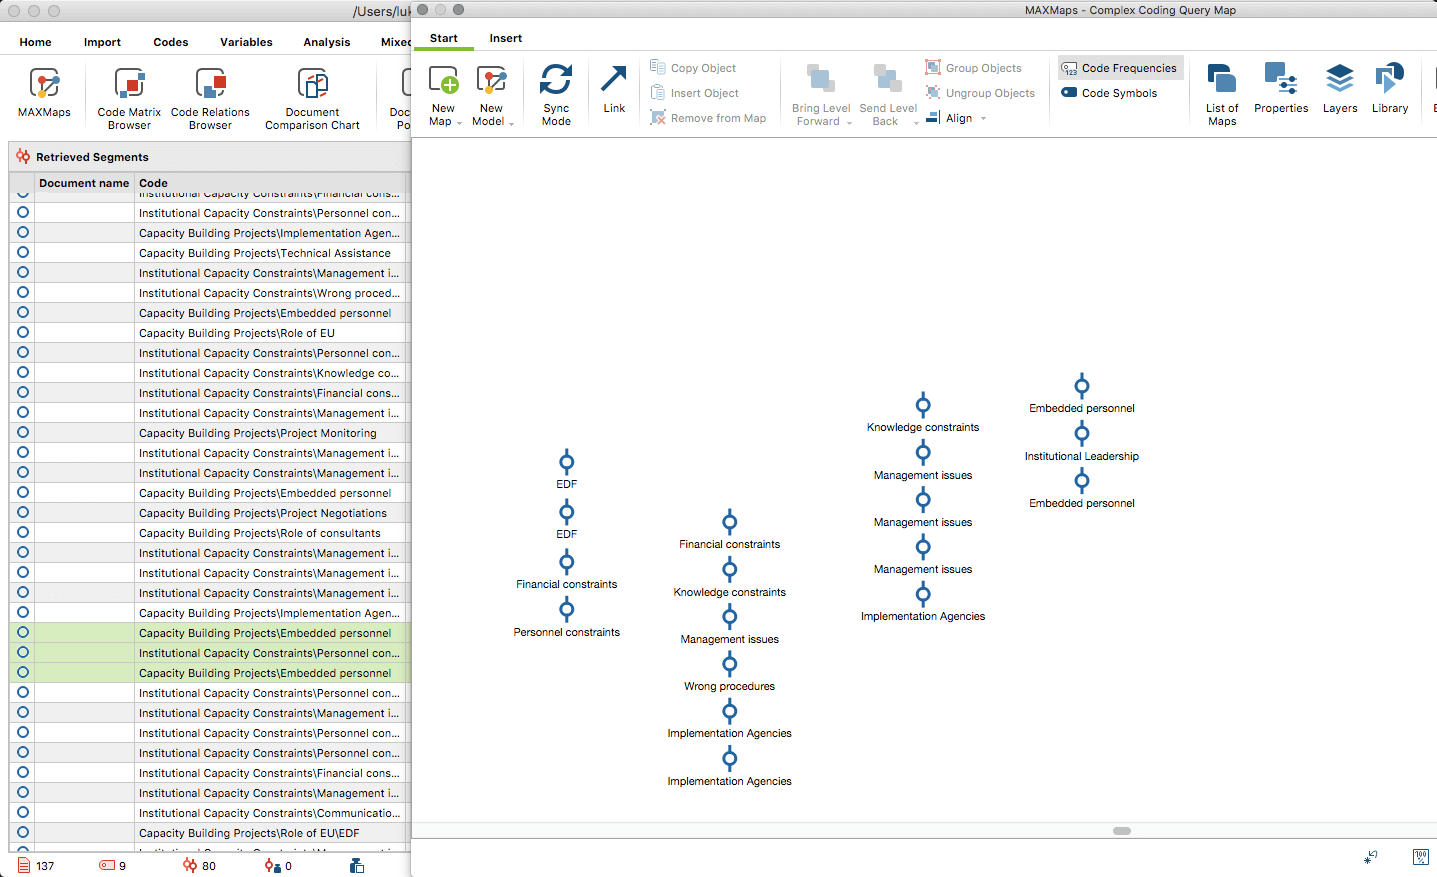
2: Creating causal hypotheses between capacity gaps and capacity building projects with MAXMaps
So what now? Using MAXMaps, we can copy and paste these segments into a mind map-like area, where they are automatically visualized as a succession of codes that were previously assigned to the segments. Remember, in the Complex Coding Query, I consciously chose segments that occurred within one paragraph or less of each other. So co-occurrences of the problem and the solution, in close proximity, suggests that what is being described is not just correlative, but causal. Looking at these causal descriptions in this way enables us to see the concrete causal relationships the interview participants proposed. Depending on how the segments have been coded, the relationships between them do not always make sense, but viewing these chains of codes in this way also lets you go back and recode the relevant data in a more meaningful way.
In Screenshot 2 above, you can see how MAXMaps visualizes the causal chains proposed by four distinct interview participants. Each series of codes represents a line of reasoning on how the interplay between capacity constraints and capacity building projects functions. Having found correlations within 10 of the 15 documents analyzed, this means we have at least ten distinct descriptions of causality contained within the data retrieved with the Complex Coding Query. The only thing left to do now is to compare the causal mechanisms described and see how many of them are similar/different. This can be done by simply selecting, copying and pasting the segments in question from the retrieval window (left) into MAXMaps (right).
Using MAXMaps for Further Correlation Testing
What I just described is the main way I test my data not just for correlation, but ultimately, for causation as well. But there are additional ways of using MAXQDA to test my data, highlighting completely different patterns of correlation and adding further proof to my causal tests. A more straightforward and less complicated way of testing for code co-occurrence is to use MAXMaps immediately rather than taking the route I described above, using the Code Relations Browser, the Complex Coding Query, and then MAXMaps.
This approach involves entering relevant codes and see whether they correlate directly (defined as occurring within one segment – a stricter requirement than what I used in my Complex Coding Query). In Screenshot 3, you can see the result of such a query, displaying the correlation between the previously described capacity constraints with capacity building projects, including one level of subcodes below both codes. The result is a much more sophisticated data output, highlighting not just the existence of correlations, but also their intensity (represented by the thickness of each connecting line).

3: Code Co-Occurrence Model in MAXMaps
In Screenshot 4, you can see that the correlation between various types of capacity constraints is much stronger than their correlation with capacity building projects (or related subcodes). While this may simply be a quirk in the data resulting from the lack of overlaps, it nonetheless tells us that causation may not be as direct as other modes of analysis suggest. Conducting as many of these tests as possible allows us to strengthen, weaken, prove and disprove hypotheses that we have developed. Ultimately, this makes MAXQDA an excellent tool to trace causal processes within qualitative data.
")
4: Code Co-Occurrence Model in MAXMaps (detail)
Checking for Code Co-Occurrence with MAXMaps
I hope that you have gained insights into how MAXQDA can be used to trace causality within complex data sets. Of course, what I have described in this entry, and the one previous is simply the beginning of the development of causal models of explanation for complex political processes. Process tracing requires the analysis of other sets of documents and – most importantly – a constant back and forth between empirical data and theoretical modeling. Fortunately, MAXQDA can be useful in both of these tasks as well.
In my final fieldwork diary entry, I will explain a little bit more about the practical side of my research and how using MAXQDA has been helpful in conducting fieldwork, developing questionnaire designs, and assisting in preparing data in a way useful to policymakers and practitioners. What I have learned over these past 12 months of fieldwork is that designing attractive analysis results has a profound impact on how your research is being perceived. People who consider themselves serious about research, and in its ability to encourage (political) change, must give thought to how they can best present their findings in ways that appeal to their target audience.
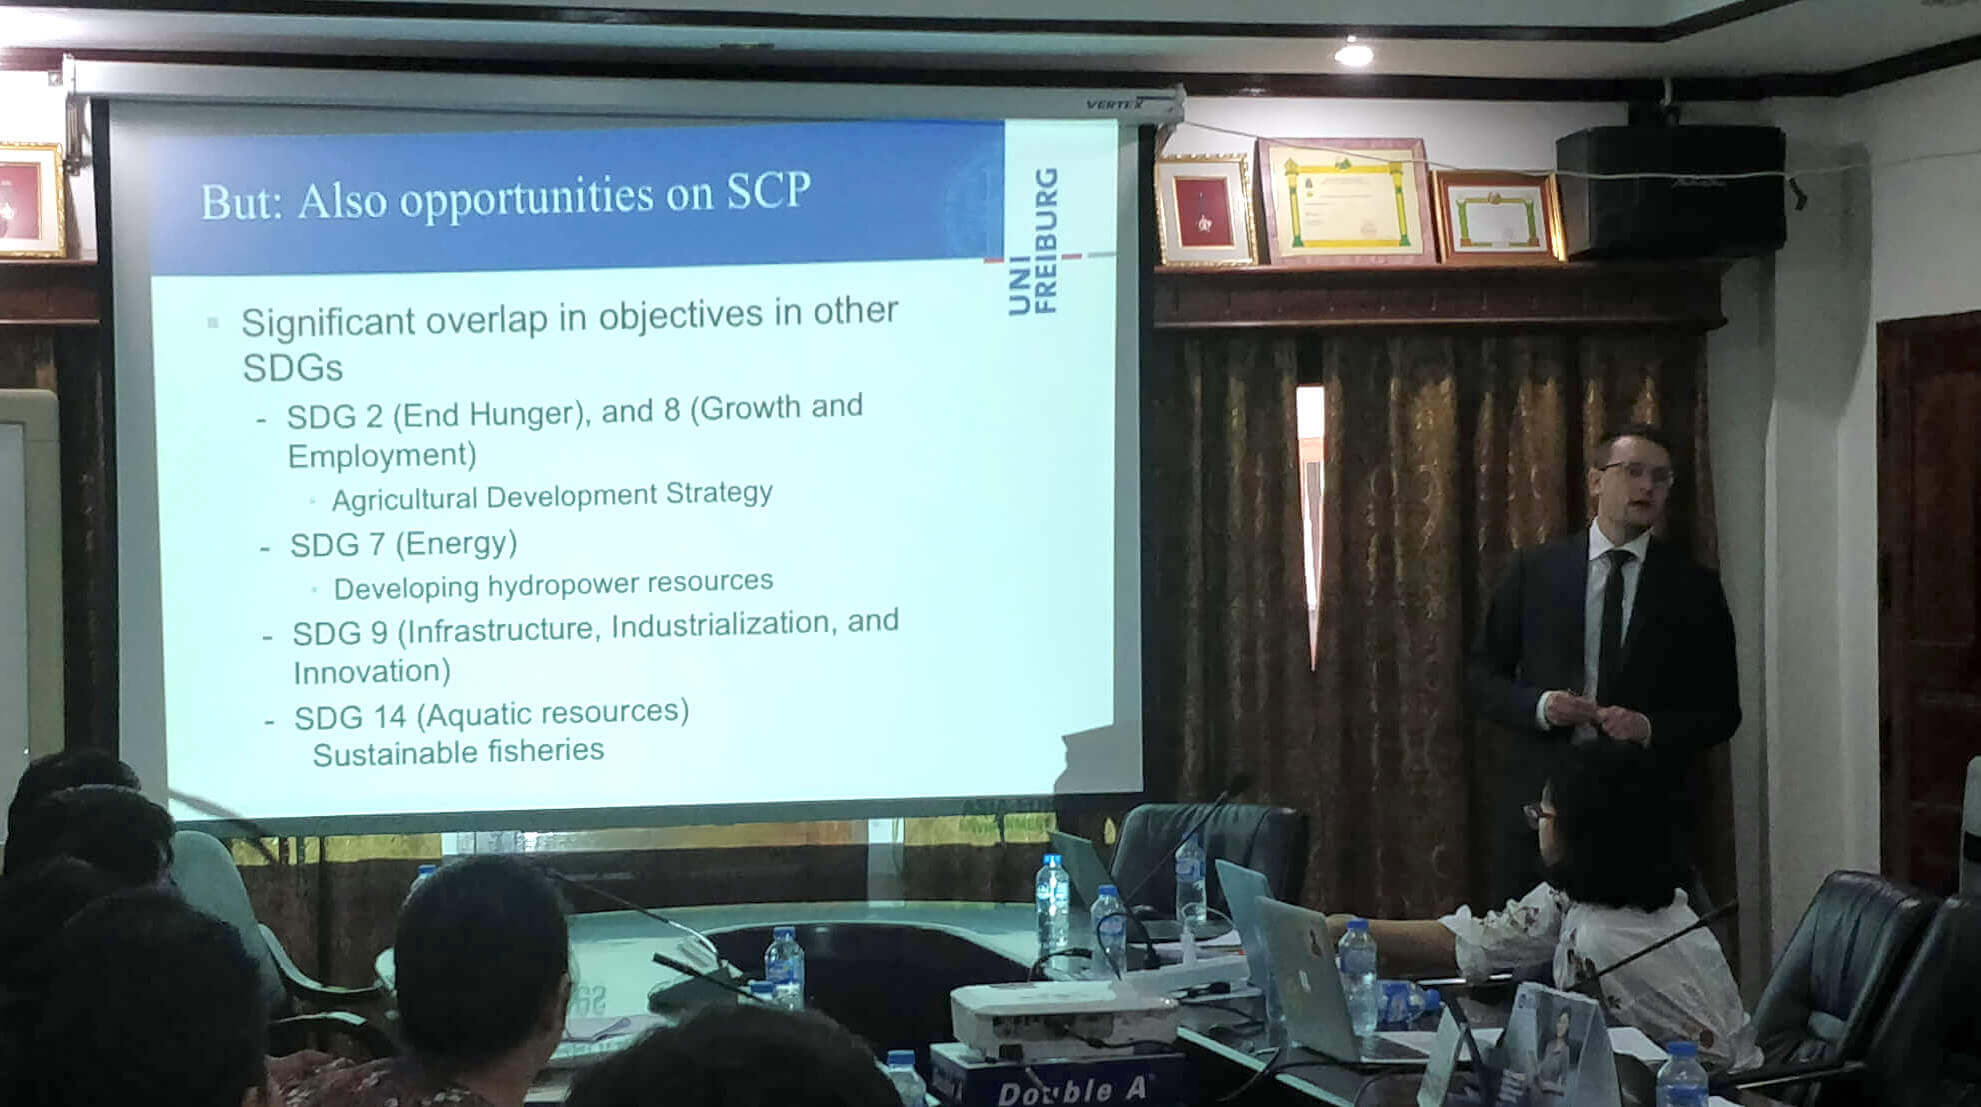
Presenting results of a study at the Laotian Ministry of Planning
Editor’s Note
Lukas Müller is a recipient of MAXQDA’s #ResearchforChange Grant. He is a PhD student in Political Science at the Albert-Ludwigs-Universität Freiburg (University of Freiburg), Germany. His research project titled, “Whose Policy? The Policy Processes of the ECOWAS Commission and the ASEAN Secretariat and the Impact of External Capacity Building” is a comparative case study analysis across two continents. Müller is currently analyzing his research data after having just finished the fieldwork phases of his project which took place in Abuja, Nigeria and Jakarta, Indonesia. Stay tuned for the final fieldwork diary entry by Lukas Müller coming soon!