I recently completed all my dissertation data management and analysis using MAXQDA 2020 Analytics Pro. This article describes the process I used to manage a large qualitative data set and the different tools I used in MAXQDA for conducting and completing data analysis.
At its broadest level, my dissertation examines the ways climate change adaptation interventions and programming are designed, implemented and then taken up by rural users in the context of development in sub-Saharan Africa. To better understand this topic, I conducted a qualitative case study investigating the socio-environmental relations between producers of climate change adaptation and its users in Southern Mali, West Africa.
My research data includes semi-structured interviews with producers of climate change adaption in Mali (33), users in a rural village (103) and two focus groups with women in the village.
Getting Started: Data Management
- To begin data management, I created two MAXQDA files, one for producers and one for users. This was necessary for managing the large number of interviews, keeping the data sets separate during analysis, and allowed for two different coding systems.
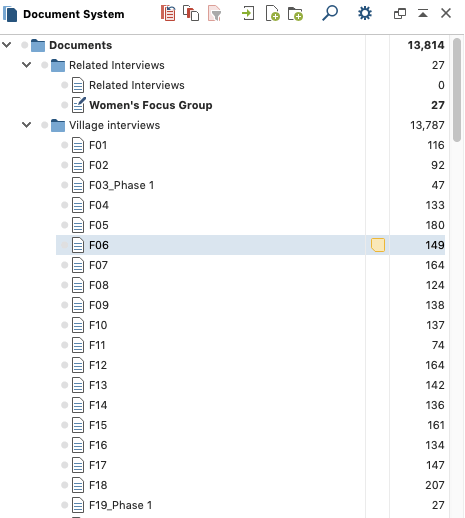
- Next, I imported the transcribed Word documents from my computer into each of the two files into the document system. To further organize my data I created two sub-folders in the document system, one for related interviews (focus groups and non-users in the village), and the other for user interviews conducted in the village). The document system allows you to manage your documents (activate/deactivate), view the number of codes in each document and any memos attached to documents (denoted by the yellow “post-it” icon) (Figure 1).
- Once the documents were properly uploaded, I then created document variables for each document. This is a very important step for data management! Creating document variables is like attaching metadata to your documents, allowing you to search and analyze your data in various ways once it is all coded. I had 13 document variables relevant to my research study (Figure 2).
- From here I was ready to start building my code system. My coding approach is influenced by the concept of open coding, in which both inductive, exploratory coding and deductive, focused coding is combined to support my research hypothesis and objectives. My coding system was deductively structured through my theoretical framework and included headings such as: livelihood discourses, livelihood activities, assets & resources, crop use, identity, roles, and responsibilities etc. Once the coding skeleton was created, I remained open to creating new parent and subcodes as they emerged in the coding process. I ended up with 18 parent codes and hundreds of subcodes in each parent category.
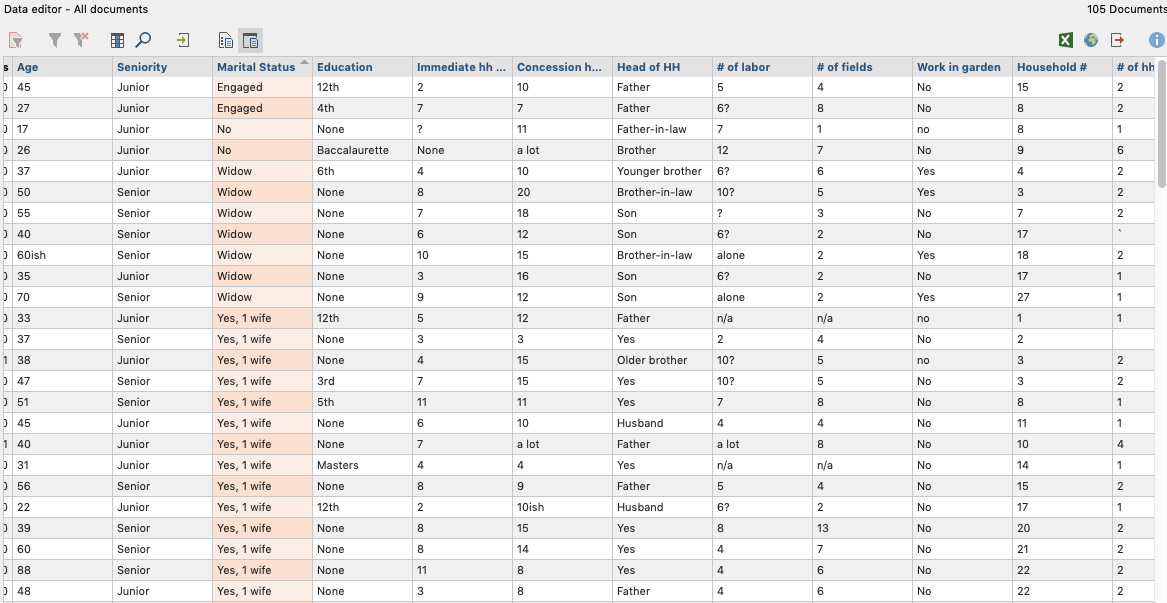 Figure 2: Data editor and Document Variables.
Coding in MAXQDA 2020
Upon completion of initial data management and coding set up, I began to code my interview documents. One tool I found especially helpful for coding was color coding or highlighting. This tool is easy to use because there are five color coding highlights in the toolbar, located in the document browser. Once you color code a segment it adds it to your coding system under the corresponding color and you can then rename the color whatever you would like (Figure 3). I utilized color coding to capture information that wasn’t quite detailed enough for coding or relevant to my project objectives but still interesting information to capture. Color coding was also useful for allowing me to capture good quotes from respondents and supporting information to further detail my results and put them in broader social contexts.
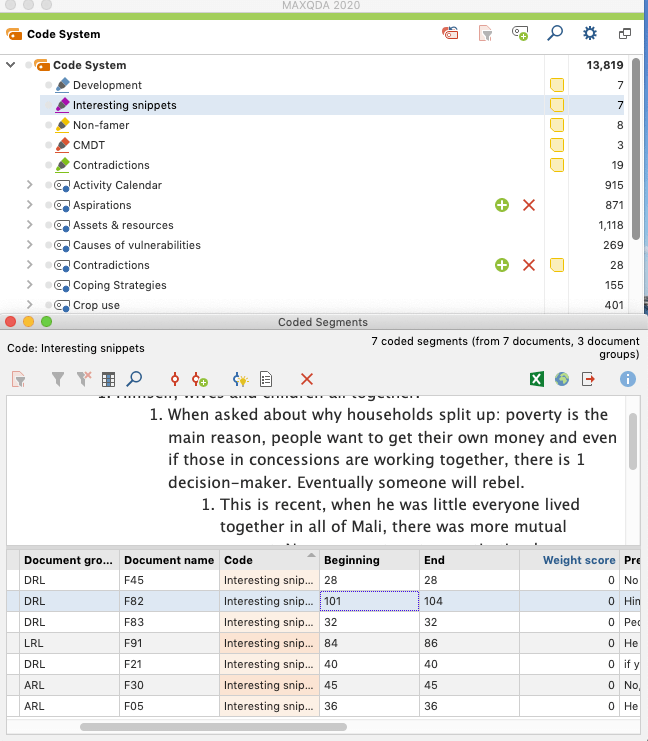 Figure 3: Code System and Color Coding.
Analysis in MAXQDA 2020
After completing coding, I ended up with 13,819 coded segments for my user data file and 1,344 coded segments in my producer data file for a total of 15,163 total coded segments! Naturally, this is an enormous amount of qualitative data that needed sorting and analysis to make sense of.
Code Matrix Browser
Most of my data analysis was completed in Microsoft Excel, using the Code Matrix Browser. The Code Matrix Browser is first a visual tool that allows you to see which codes show up in which documents through a matrix view. The Code Matrix Browser allows you to search specific codes by activating those codes in the code system and it allows you to search specific documents by selecting different documents, document groups, or sets. Once you have created your Code Matrix Browser a window pops up to display your results, from there all sorts of visual functions are available to view your data. For my needs, I used the Code Matrix Browser to export my data to Excel for further analysis so I could create graphs and charts to be used in publications (Figure 5). I ended up utilizing the Code Matrix Browser multiple times for different codes and data I was interested in analyzing further. To do this, I followed these simple directions:
- Activate the parent code I am interested in analyzing. MAXQDA 2020 will automatically activate any subcodes underneath the parent codes. This is especially useful because you do not have to worry about capturing all subcodes as long as the parent code (or codes) you are interested in is activated.
- Activate the documents I am interested in exporting data from.
- Go to “Visual Tools” – click “Code Matrix Browser.”
- Select where you want to draw data from (“Documents” for me) and then select “only for activated documents” and “only for activated codes.”
- Once your Code Matrix Browser pops up, select the 123 icon to “Display nodes as values.”
- Next, select 1 blue/grey square icon “Binarize view.” Binarizing your data simply displays a 1 for each document that has an active coded segment for the codes that are activated. This means that even if you coded a document to the same code multiple times it will only be displayed once, as a 1 (Figure 4).
- Click the green Excel icon in the top right of the Code Matrix Browsers toolbar to export your data to Excel. An Excel sheet labeled “Code Matrix Browser” will appear and from there you can begin to work on your data in Excel.
Once I had my data in Excel, I further organized and cleaned up my coded information. I deleted or merged codes that were similar or unnecessary. I also began to group my user participants into “vulnerability groups” – groups of individuals who share similar vulnerabilities related to their overall livelihoods strategies, and as such tend to make similar decisions. Placing individuals into vulnerability groups allowed me to see what different groups do for their livelihoods (see Figure 5), why they do what they do, what vulnerabilities concern them most, what their access to relevant assets and resources may be, and what kinds of crops (and how many) they are growing.
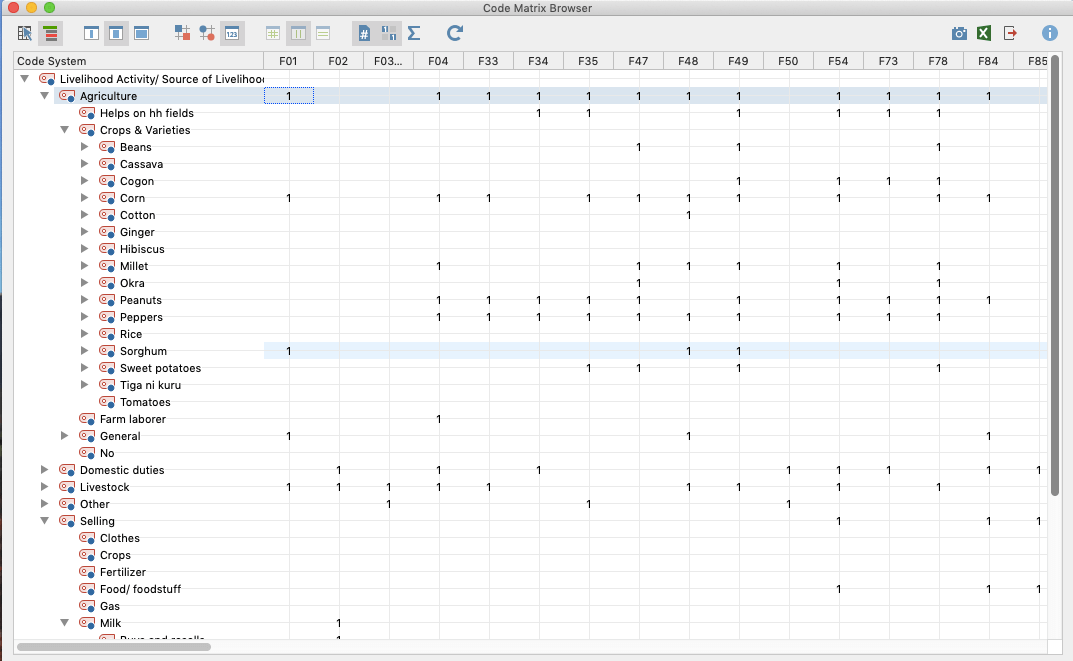 Figure 4: Code Matrix Browser.
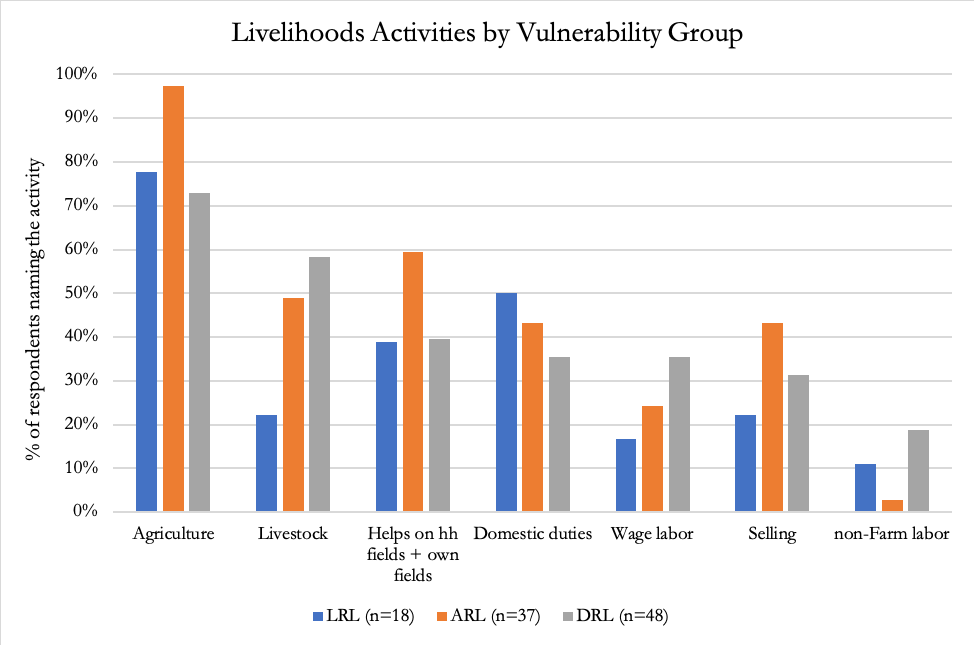 Figure 5: Excel chart with MAXQDA coded data.
Comparative Coding Query
Another MAXQDA 2020 analysis tool I utilized is the Compare Cases & Groups function. This function allows you to easily retrieve information from your coded segments across your different document groups so that it is easy to view and interpret. To fully utilize this function, after I had grouped my individual user participants into vulnerability groups in Excel, I went back to my MAXQDA file, added these three groups in my document system, and placed each interview under the appropriate group. This allowed me to see how members within each group were talking about particular codes of interest and allowed me to see how members across groups were talking about particular codes of interest. For example, I wanted to know how different vulnerability groups plough their fields with tractors. To easily find this information I followed the following steps:
- I activated each vulnerability group in the document system.
- I activated different codes related to how people ploughed their fields with or without tractors.
- When all my necessary information was activated, I went to the Analysis tab at the top and clicked “Compare Cases & Groups”, and then “Qualitative” again.
- When the window popped up, I hit “insert activated codes” for both the groups and codes section. Alternatively, you could drag and drop documents, groups and codes if you didn’t want to activate them prior.
- Hit “ok” and a new window pops up with your results in an Interactive Quote Matrix (Figure 6).
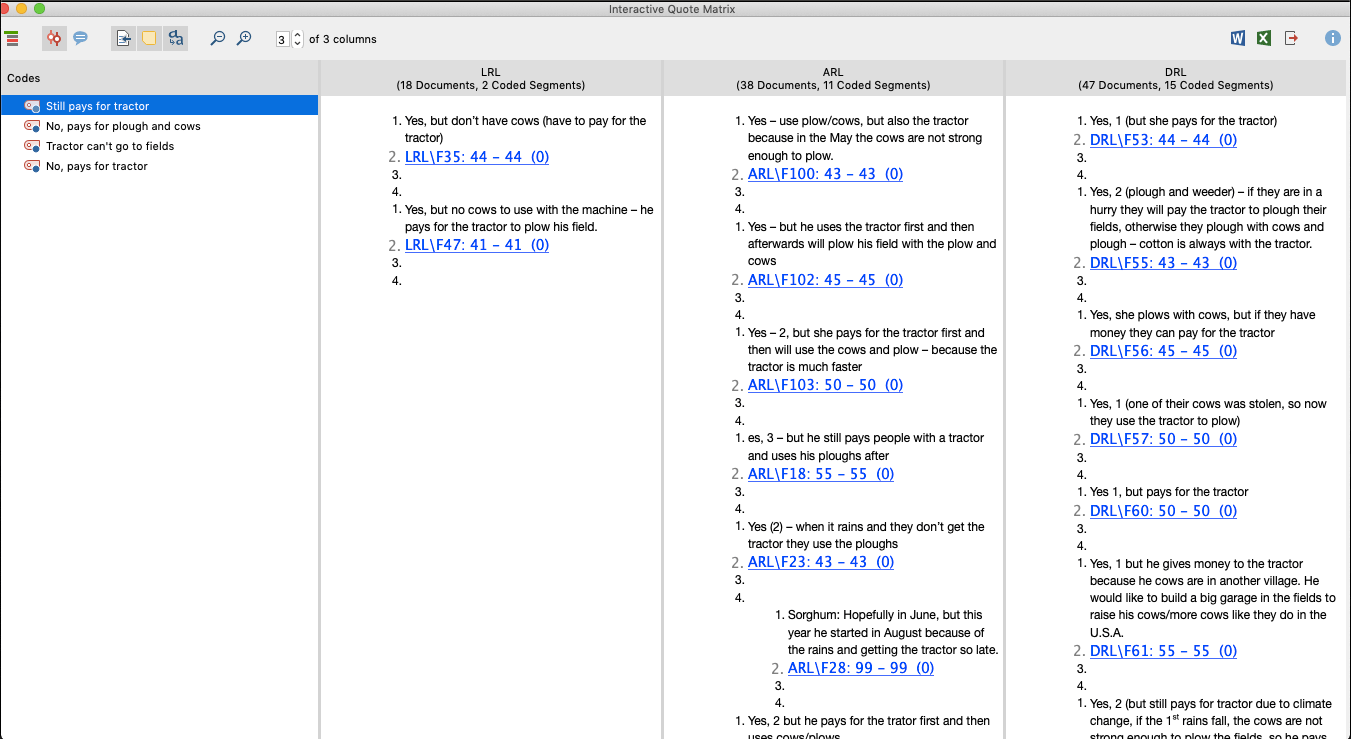 Comparing Groups and Cases, Interactive Quote Matrix
The results of this analysis tool provided an easy way to understand and compare how different groups talk about a code of interest. It’s easy to view all the activated codes to see how different groups/individuals are coded and it’s easy to view only one or a few codes at a time.
I hope my experience coding a large qualitative data set is useful as others begin working with MAXQDA!
About the Author
Helen Rosko is a Ph.D. candidate in the Graduate School of Geography at Clark University – Worcester, MA, USA. She is currently finishing her dissertation project titled: “Delivering Developments Target: Aiming for Adaptation Subjects” examining climate change adaptation processes in Mali, West Africa.

 Helen Rosko is a Ph.D. candidate in the Graduate School of Geography at Clark University – Worcester, MA, USA. She is currently finishing her dissertation project titled: “Delivering Developments Target: Aiming for Adaptation Subjects” examining climate change adaptation processes in Mali, West Africa.


