What are some analysis options once you’ve completed those first importing and coding steps? In this article, we’ll give you some tips and ideas of options that you can explore further for your own analysis journey.

1. Retrieve Your Coded Data
Let’s take a moment to get to know MAXQDA’s “Retrieved Segments” window. This window allows you to see the coding work you have done to your data. After you have assigned a code to certain segments in a document, you’ll be able to instantly retrieve all the segments you coded with that code. Simply activate the documents and the codes and voila, you can retrieve your coding work with just two clicks!
By activating, you can select specific documents and codes to focus on analyzing. So, how does the activation work? It’s easy: In every document’s or document group’s context menu (right-click) you will see the option “Activate” right at the top. You can then immediately see if a document or group is activated: Both the name and symbol are colored red and a red arrow appears in front of them (see right-hand screenshot below).

Activate documents and codes to retrieve coded segments
If you are, for example, analyzing interviews, you may ask: “What was said about a certain topic and who said what?” The magic word to get exactly those answers is Retrieval. Activate all documents and codes you are interested in. Activation of codes works just like the activation of documents (right-click the code and choose the option “Activate” or click on the symbol in front of the code name\subcode name). All coded segments, including all of their source information, will appear in the “Retrieved Segments” window.

Local settings in the Retrieved Segments window
Tip: Did you know that you can use variables or weight scores for the retrieval process? Have you tried using MAXQDA’s Complex Coding Query? You can even get an overview or export and print your retrieved segments! Learn more about retrieval in the MAXQDA Online Manual.
2. Compare Your Coded Data
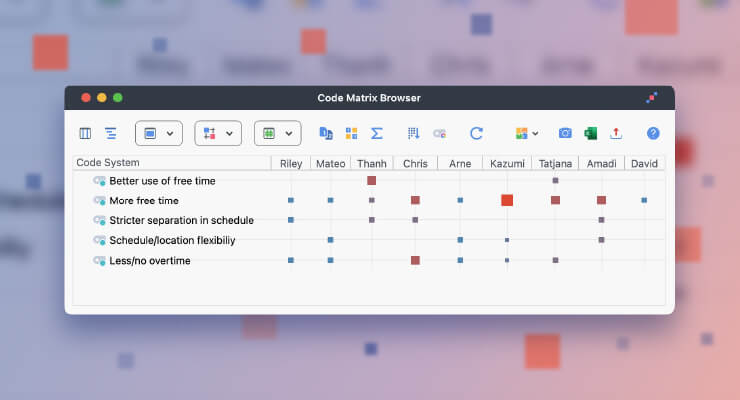
A comparison of several cases or themes is often the aim we have in mind while conducting our research. Luckily, MAXQDA has multiple options that will allow you to draw comparisons within your data. Your go-to tool could, for example, be MAXQDA’s Compare Cases & Groups function in the Analysis tab, which allows you to easily compare coded data (qualitative data) and code frequencies (qualitative data transformed into quantitative data). Simply select 2 or more document groups and the codes you want to compare to create a custom segment matrix!

Interactive Quote Matrix
If you’re looking for a more visual comparison, then creating a Two-Cases Model could be a suitable choice for you. MAXQDA’s MAXMaps feature allows you to graphically represent the elements of MAXQDA such as codes, coded segments, documents, memos as well as the relations between them.
A Two-Cases Model is a great option when comparing two documents and even whole document groups or sets. For example, if you want to compare two documents – let’s say, Joanna’s interview and Geoge’s interview from the example project – you should start by dragging and dropping them onto the MAXMaps interactive interface. The second you do that, you’ll have a preview of your model. You can leave it as it is or customize it and integrate further elements, such as memos. Now you can automatically visualize the extent to which codes, e.g. Relevant topics, occur in two cases or only in one case. When you are happy with the customization of your map, you can export it as an image or PDF that can be put directly into your report!
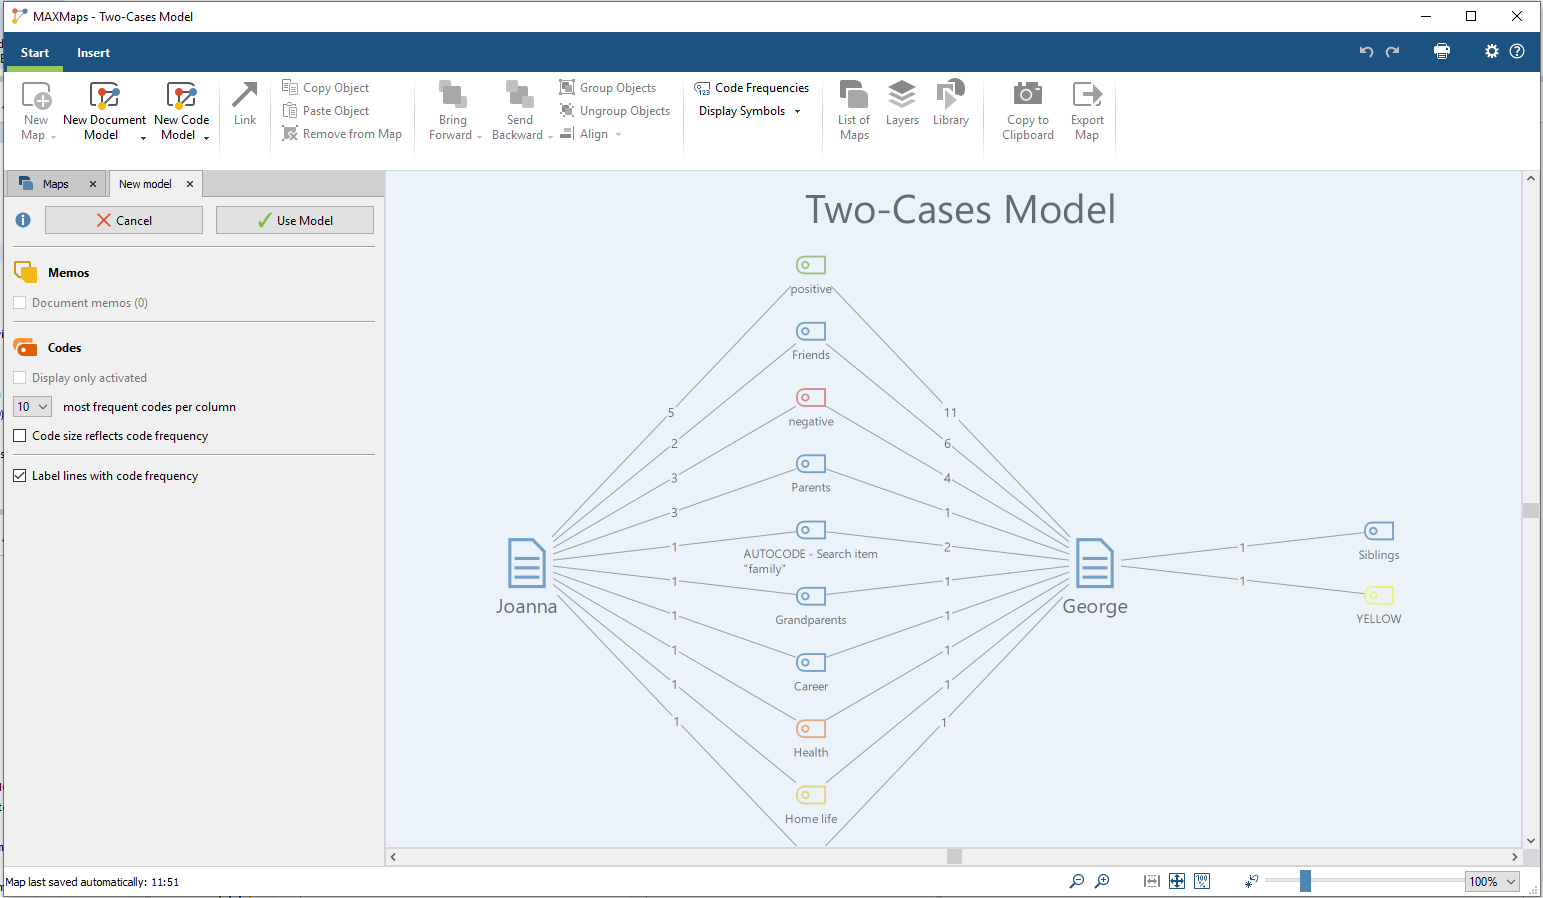
A preview of a Two-Cases Model created in MAXMaps
New Feature in MAXQDA 2020
3. Summarize Your Coded Data
A perfect option for further analysis of your coded data is summarizing. MAXQDA has some great tools including the Summary Grid and the Summary Table, which you can find in the Analysis tab. The tool allows you to summarize and give theoretical explanations for the new findings in the text, which is often the first step between your MAXQDA project and your final paper!
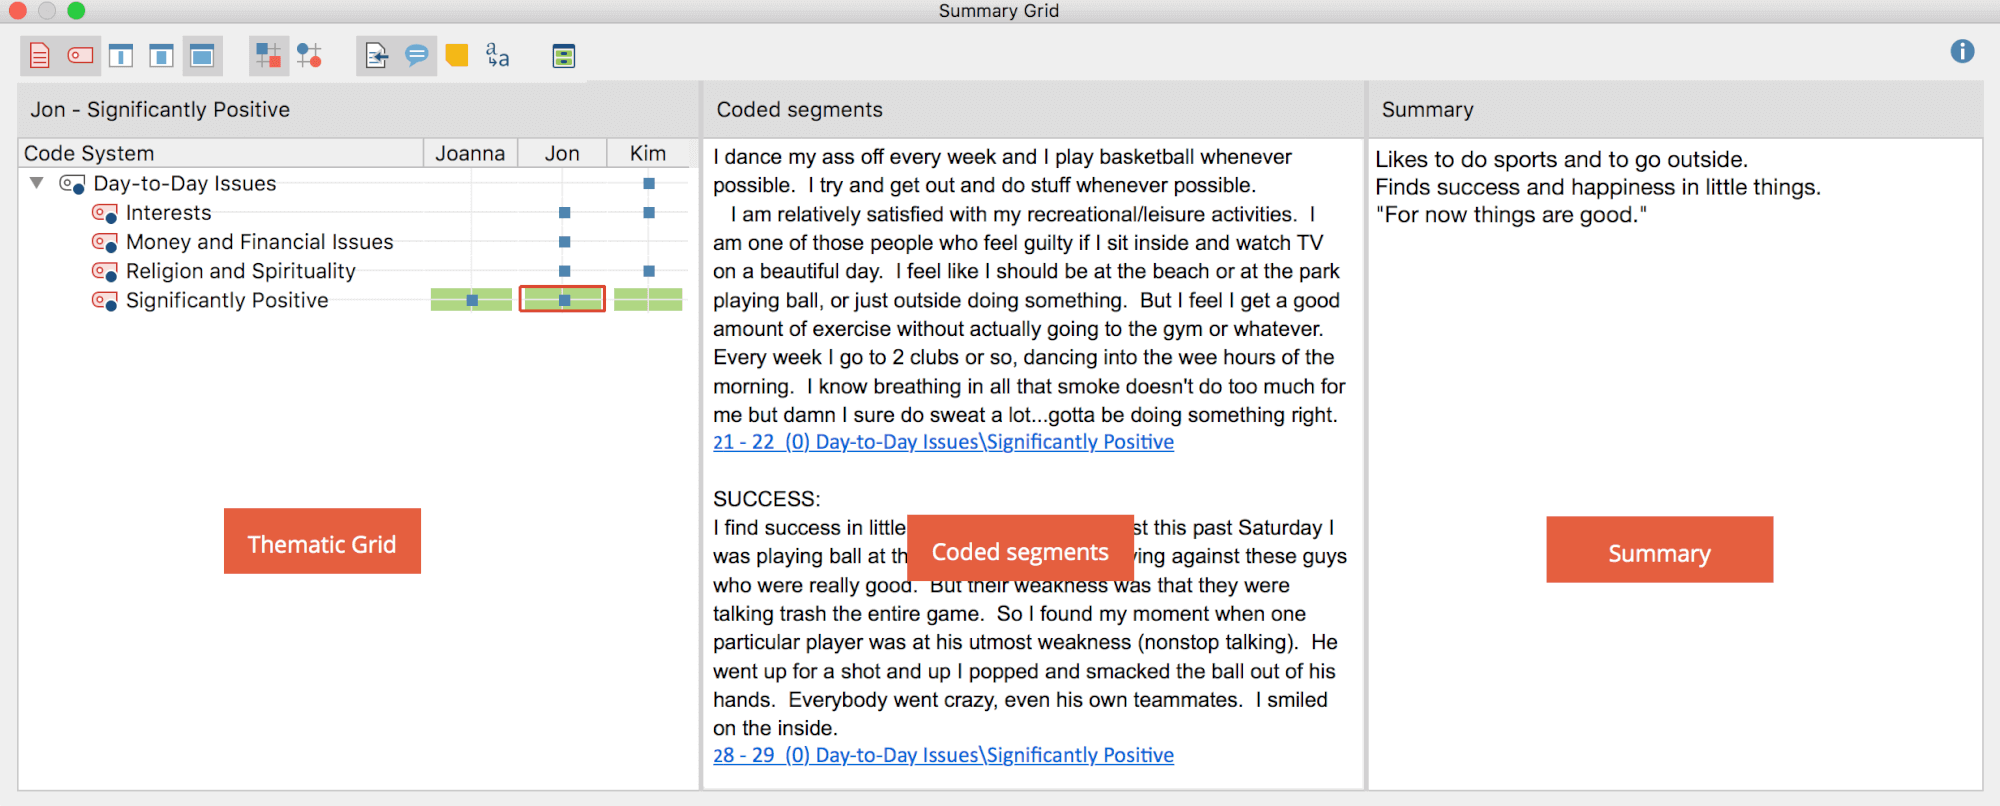
Window “Summary Grid”
Then, MAXQDA’s Summary Tables offer you the next level of an overview – this time it is a compilation of the summaries for selected topics. If you need an overview of your summaries in a Word format, you can create it in less than a few minutes. If you go to the Reports tab, you can find a “Summaries” icon there too. Here you have two options: you can create a report with or without coded segments. Each time the results will be displayed in a table, consisting of two or three columns respectively. You can always define which codes/documents you want to have in your report – it’s completely flexible and ready to help you achieve your specific research goals!
What’s next?
Now that you’ve learned about the advanced MAXQDA functions, you can try them on your own. We currently have extended the MAXQDA Free Trial period to 30 days so that you have more time to work creatively on your data analysis! Test the full version of MAXQDA with no obligations today: