Who needs statistics programs or excel to create tables and code frequency charts anyway? MAXQDA doesn’t! Statistics can be created within the software. Once you have finished your illustrations, you can save and use them for your reports and presentations.
How it works:
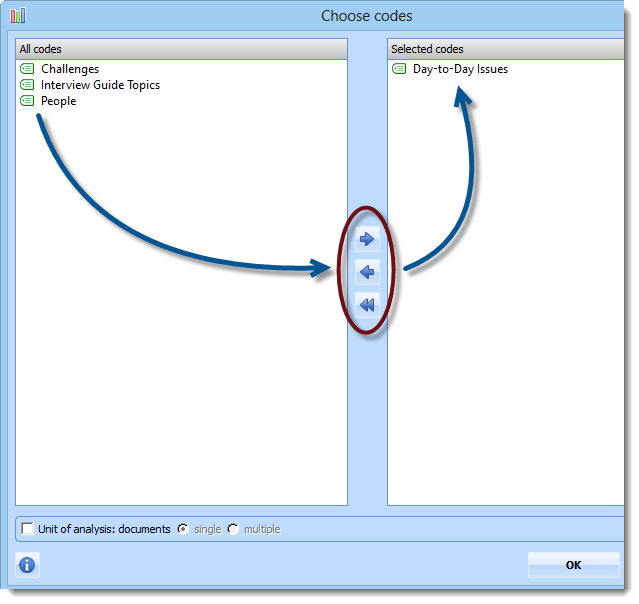
Just click on  (Menu: Mixed Methods) and you will see the following window. There you choose the specific code of which you want to see the frequency of subcodes. Confirm then with OK.
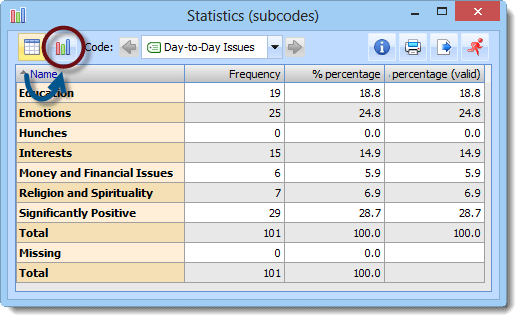
What you see now is a frequency table with the frequency and percentage distribution of the subcodes of the variable Day-to Day Issues.
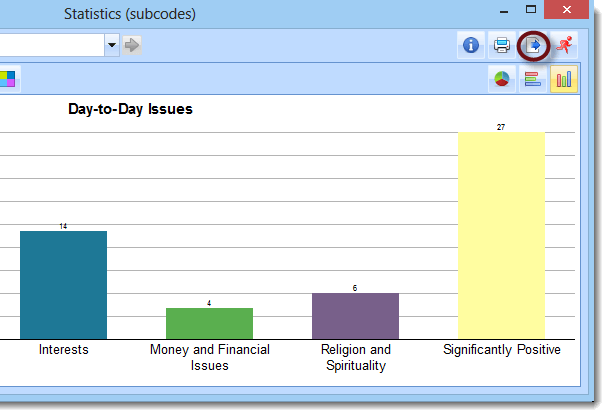
This representation ist not graphic enough for you? No problem! Just click on the chart icon and view your subcode frequencies in a chart.
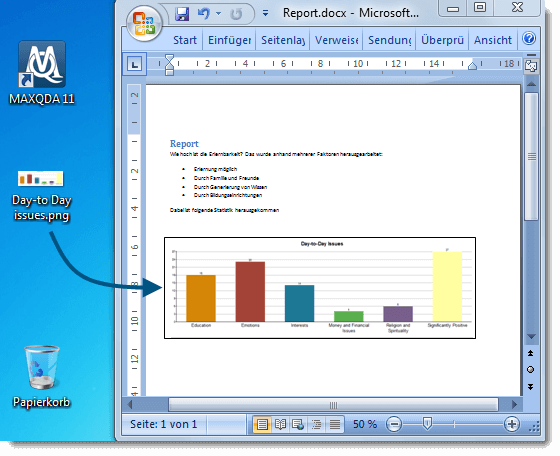
You can export and save your tables and charts. Just click on  and save your illustrations e.g. on your desktop. Now you can drag & drop them into a program to use them for your reports or presentations!
We wish you frequent fun 😉