Community-Engaged Research is the theme of this semester’s MAXQDA Research Grants

Let’s Start at the Beginning: What is “Community Engaged Research”?
The definition of “community” is quite broad and the term “community-engaged research” could be applied to a wide range of projects. Traditionally, a community is understood as a group of people who share a geographic proximity, experience, belief, interest etc., and community-engaged research refers to research that includes the local population as participants in the design, execution, and results of the project.
The methodology of community-engaged research (CEnR) was developed in the Hamilton region of southwest Victoria, Australia. For almost 20 years, the members of the local university worked with the community while conducting their research. Their work helped develop the core principle of CEnR: sustaining the long-term relationship between the researchers and the local citizens and thereby enabling trust and a respectful dialog between all participants.
Community engagement can be broadly described as the process of working collaboratively with groups of people affiliated by geographic proximity, special interest and/or similar situations to address issues affecting the well-being of those groups of people.
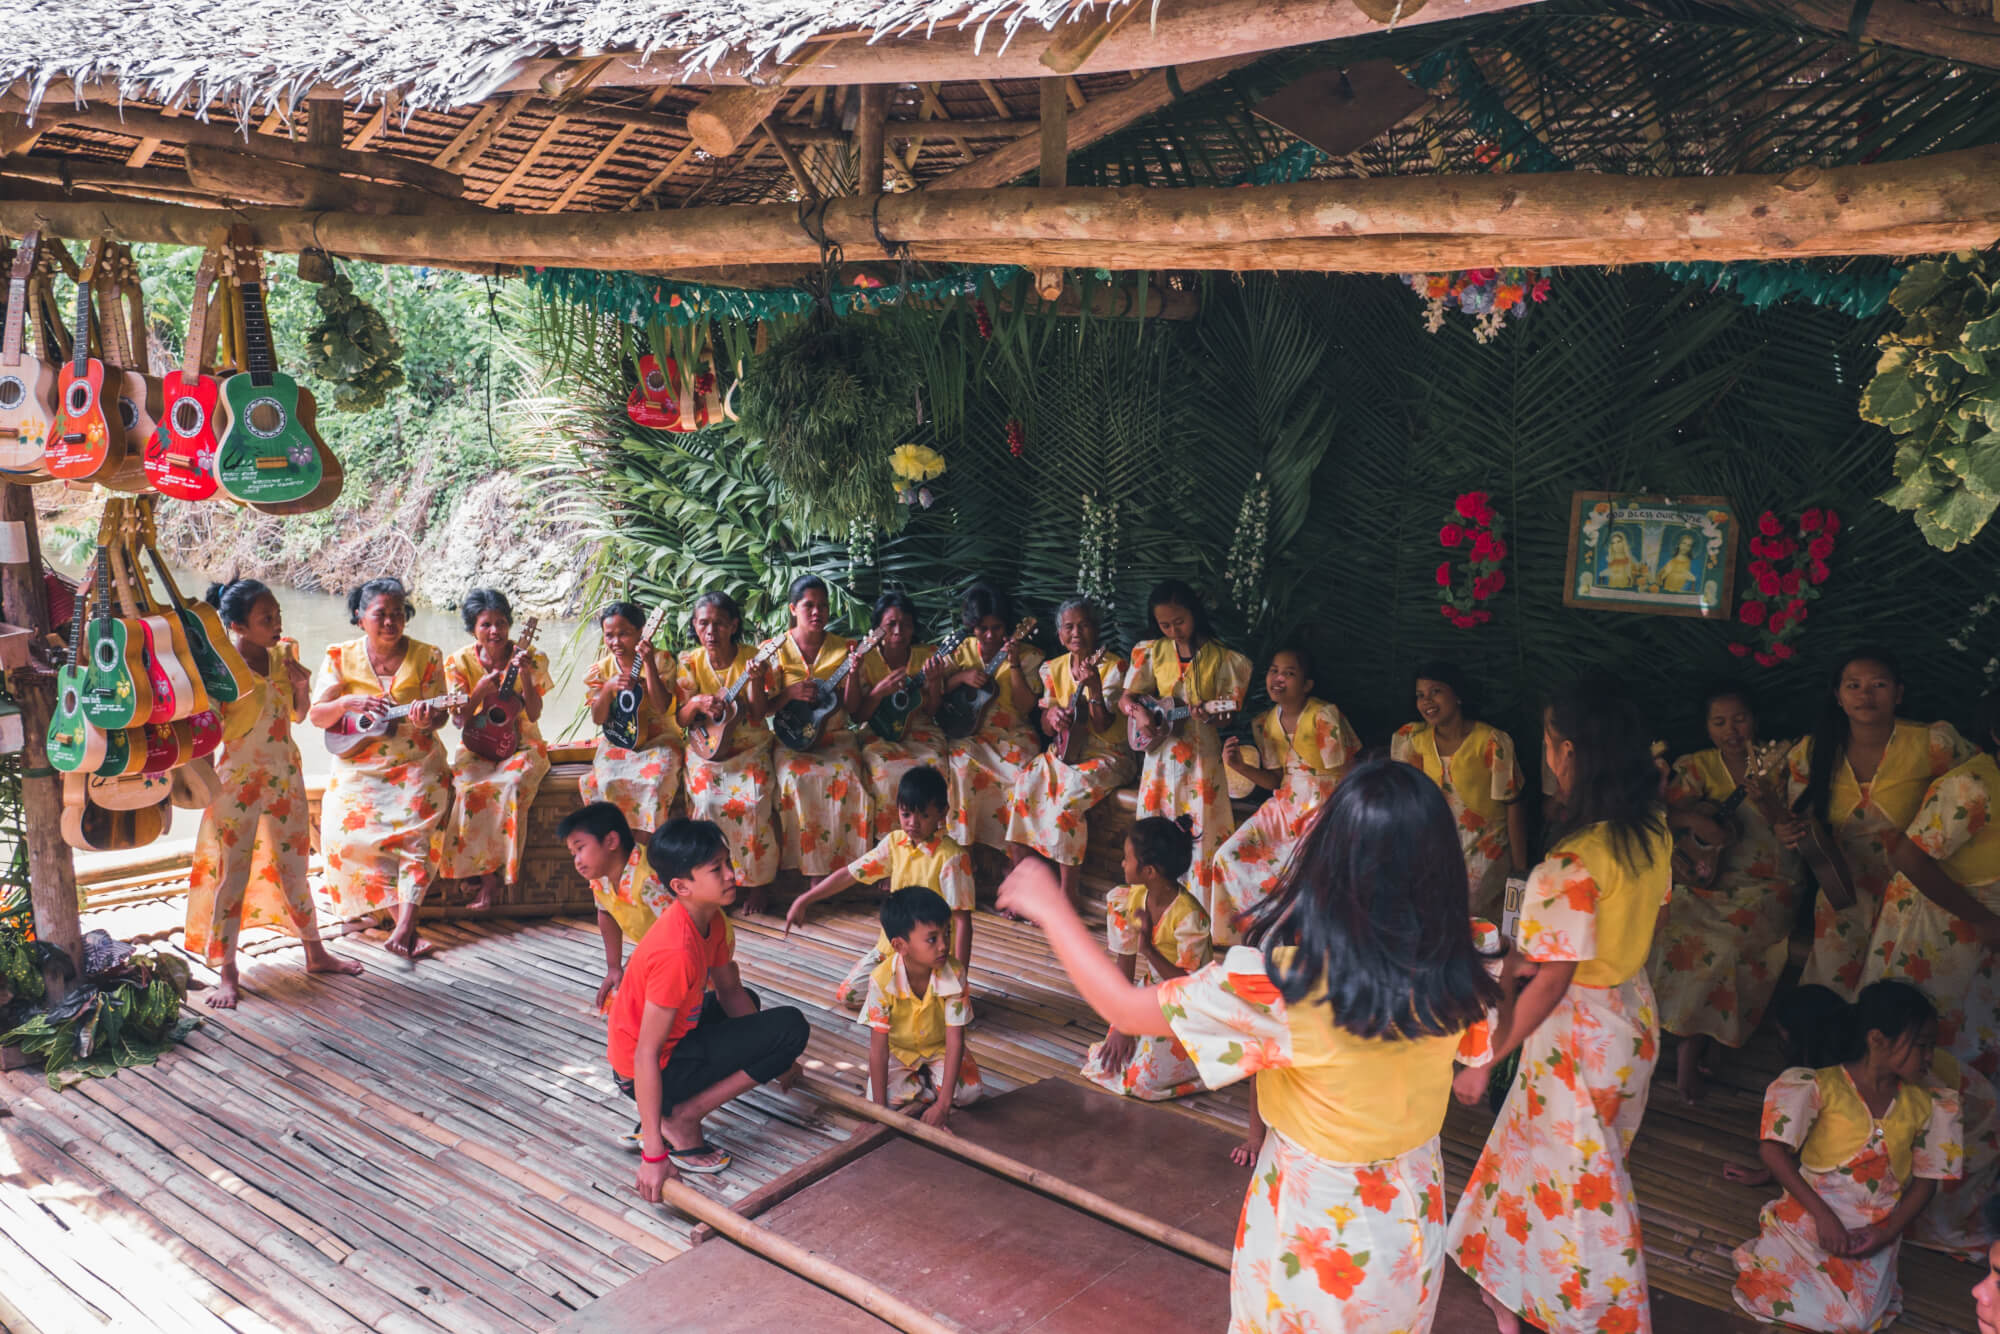
Researchers conducting CEnR should also use a variety of research methods and instruments to gather their data. Methods ranging from ethnographer’s fieldnotes to photo-narrative techniques can be helpful. Deep insights into the daily lives and needs of a community can also be enhanced when the community members themselves document their perceptions of their own communities through photography or diaries, for example.
This kind of commitment between researchers and the community certainly involves some potential obstacles. Above all, CEnR requires time and patience in order to be done effectively. The differences in the socio-cultural background and the positionality of the researchers in the field must be acknowledged in order to see projects through that will be mutually beneficial for both sides. A range of challenges may also arise due to economic or resource constraints in the community.
Some communities may only have limited internet access or low rates of literacy, for example. The researchers are therefore responsible for tailoring their research methods and expectations to the needs and resources of the community as well as creating comfortable environments for collaborative work. Here are some tips: instead of formal meetings, focus group discussions with participants can take place during meals or after other community events when participants are already gathered together. Instead of conducting online surveys, researchers may choose to employ a face-to-face survey method. Finally, interviews can be conducted when participants are engaged in their daily activities so that they do not have to take time away from their work or routines to accommodate the researcher.
Despite its challenges, conducting the community-engaged research can be highly rewarding for both sides during the research project and beneficial in terms of its impact. The large amounts of data collected over long periods of time typical to CEnR can yield relevant and representative analysis results, which may help positively affect the participatory nature of future policies for the community.
How to Analyze Community-Engaged Research Data with MAXQDA
Once the fieldwork phase has begun, the next steps are organizing and then analyzing the data. Whether it has been gathered through interviews or household surveys, the collection of life histories or personal biographies of the local citizens, etc., MAXQDA is the perfect software companion for researchers organizing their CEnR data into interviews transcripts, survey statistics, image collections and more.
MAXQDA is an intuitive, easy-to-use, and most importantly, powerful tool that helps you digitize your data and organize your field notes.
Transcribing Interviews with MAXQDA
One of the most important aspects of organizing your fieldwork is transcription. Typically, transcribing interviews and discussions is one of the most time-consuming activities for a researcher. MAXQDA’s Transcription Mode makes this process easier and faster. Every time you import an interview recording or a video file, an empty text document will be assigned to it so you can write your transcript there. Simply right-click on the document and select the option “Transcribe audio file” or “Transcribe video file” and the Transcription Mode will be activated.

Learn how to quickly and easily transcribe data with MAXQDA 2018
Coding Images from the Field with MAXQDA
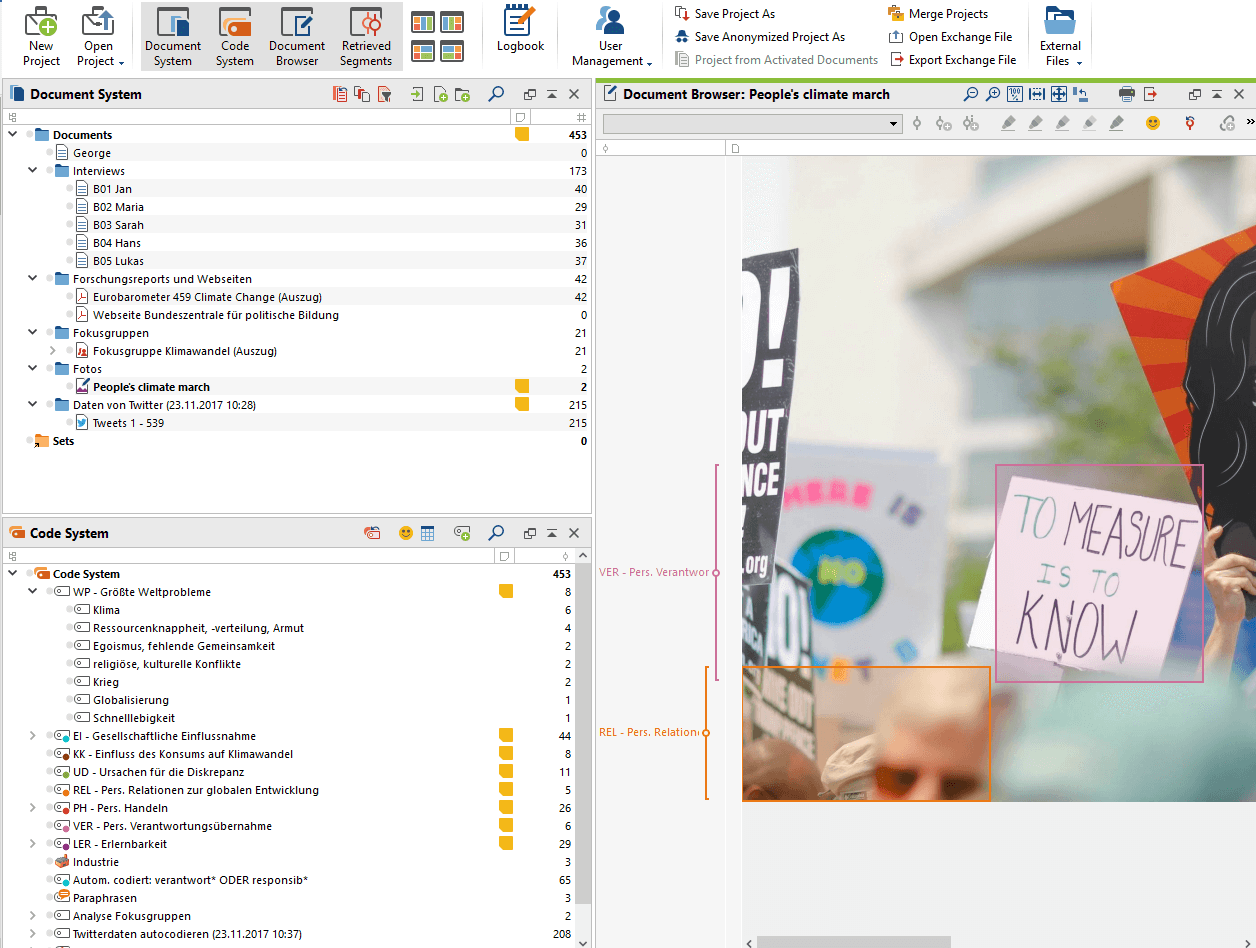
If you choose to work with the photo-narrative techniques, the image coding function in MAXQDA can be a great help! With MAXQDA 2018, you can code pictures and videos just like texts – just select a part of the picture or a segment of the waveform of sound underneath the video and add a code.
Categorizing Survey Data
If you used a survey method during the fieldwork phase of your research project, MAXQDA is the perfect tool to help you categorize survey data. First, import your survey data into MAXQDA from Excel or SurveyMonkey with just one click:

After that, you can categorize survey responses. Simply code all the responses to a question as you normally would and then choose the option “Categorize Survey Data” in the “Analysis” Tab. You can also, of course, choose to analyze only a selection of responses of individual interview partners at a time. To do so, activate the documents you need and then select the “Only activated documents” option.

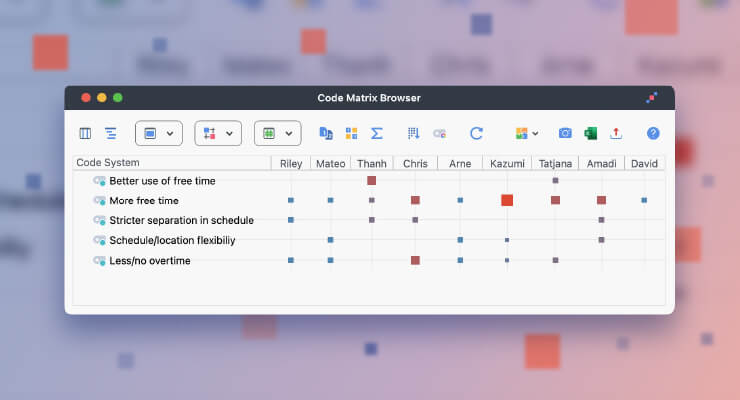
After clicking “OK”, a table will appear, where you can see the source of the response (Document) and the response itself (Responses) as well as a list of the codes assigned to the response or part of the response (Codes). You can also leave a comment of up to 255 characters in the Comments section.

Next, you can create new categories for the responses by clicking on the symbol “New code” and entering the code name in the dialog window. Confirm by clicking “OK”.
To assign a response to a newly created category, see the leftmost field of the window, which contains a reduced code system. Click and drag the row with the response that you want to assign to a category to one of the displayed codes in the hierarchical code tree. This allocation is immediately displayed in the “Codes” column. If you would like to assign a category to only part of a response, double-click on the text, select the portion of text and drag it to one of the categories in the code system. This allows you to match all of the responses with the suitable categories and create a clear representation of the data.
These functions are great for researchers using analysis methodologies like Grounded Theory approaches. Click here to learn more about Grounded Theory compatible functions, such as In-vivo coding with MAXQDA.
Paraphrasing
The last but certainly not least tip for conducting CEnR with MAXQDA we have for you is a feature that is new in the latest version of the software, MAXQDA 2018. Released in December 2017, MAXQDA 2018 introduces “Paraphrases”, a feature that can be incredibly useful when you summarize a text (for example, an interview). To put it simply, paraphrases are summaries of individual sections of your data, written in your own words.
Paraphrases can be easily added to both text and PDF documents using MAXQDA 2018. Just activate the Paraphrasing Mode (Analysis > Paraphrase) and highlight with the mouse the section of the document you would like to paraphrase. The window in which you can write a paraphrase will appear automatically. Save the paraphrase text by clicking on OK or pressing the Enter Key.
You can create as many paraphrases as you like. Don’t forget to deactivate the Paraphrasing Mode after you are done by once again clicking the Paraphrase button in the Analysis tab.

Test MAXQDA 2018 Free with a 14-day Trial
Want to try out these MAXQDA functions and features during your fieldwork data collection and analysis? Download the free demo of MAXQDA 2018 and get started!