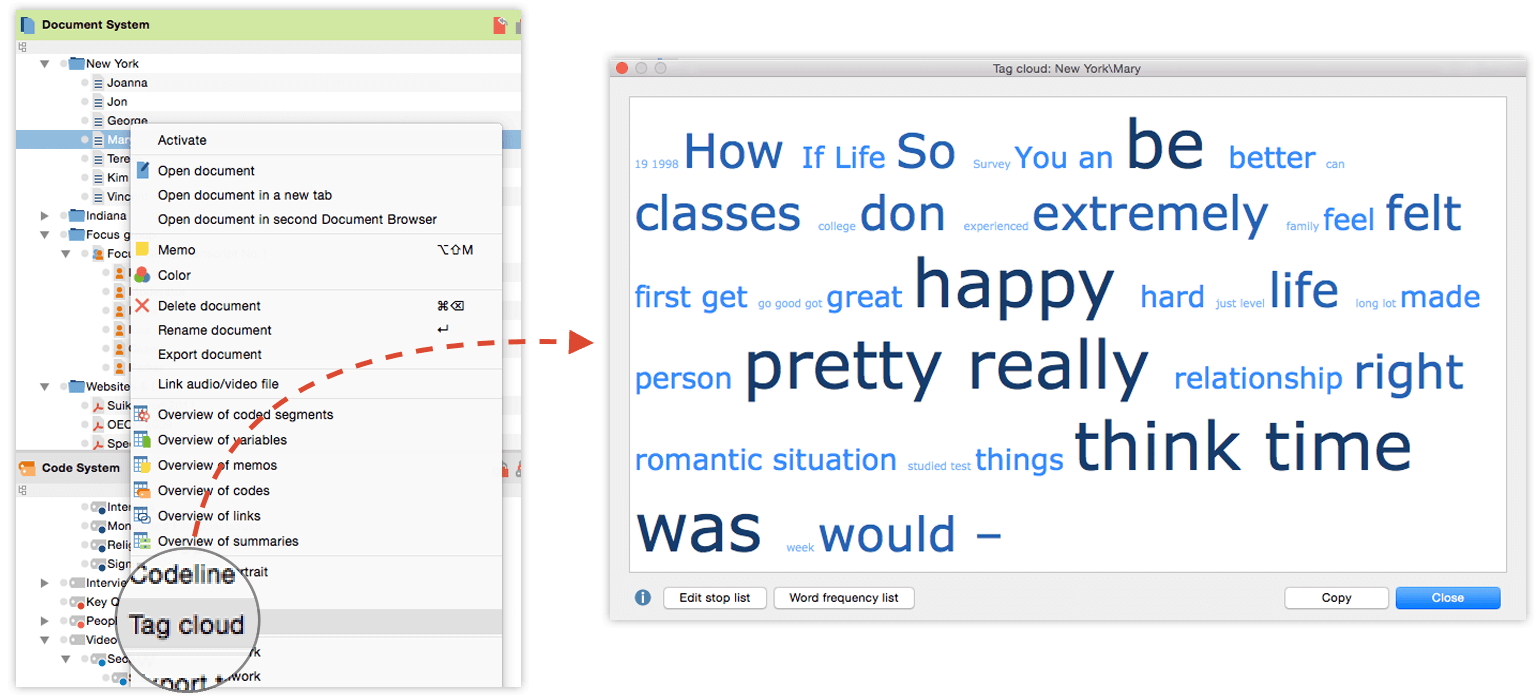
Do you want to begin your analysis with an overview of the most common terms used in your data or visualize these terms graphically in a presentation? Use tag clouds!

Just right-click on the document, document set, or document group you are interested in and select the tag cloud option. The size of the font is dictated by the number of times it is found in the selected document(s). MAXQDA puts the words in alphabetical order, starting in the top left.
Too many words in your tag cloud?
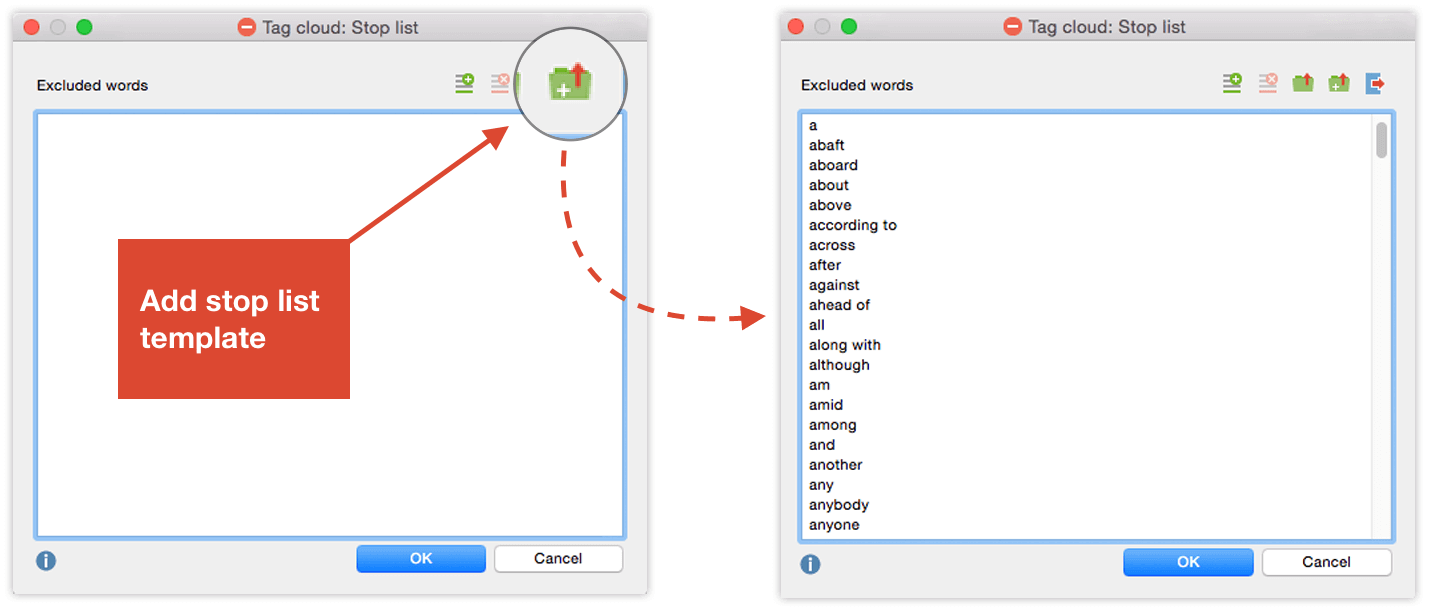
Use the Edit Stop List option! You will find this feature at the bottom of your tag cloud window and it allows you to add certain words, either automatically or manually, which MAXQDA will exclude from the presentation.
Words such as “the” or “one” can be brought into a stop list (that can be saved for repeated use), so that only relevant terms will be mapped for your analysis. To safe time use our stop list templates with the most common irrelevant words that can be downloaded from our website!

Would you prefer to display word frequencies in a table?
Just click “Word frequency list” on the bottom of the tag cloud window. You can also export and autocode this list.
Once a tag cloud is created, it can be easily exported, for example to a Word document. Tag clouds are a quick, impressive way to visualize vocabulary for your analysis.


