MAXQDA is your number one software choice for your research journey, starting with data collection and organization to analysis and presentation. In this article, we are going to take a look at fieldwork data organization with MAXQDA 2020.1, a free update for MAXQDA 2020 that came with more than 50 new features, including the Subfolders function!

MAXQDA Photo Contest submission “Archaeological excavations in Tuva” by Anna Klochko
MAXQDA helps you analyze all kinds of data – from texts to images and audio/video files, websites, tweets, focus group discussions, survey responses, and much more. This flexibility is extremely important for all qualitative and mixed methods researchers, but it is especially helpful for those conducting fieldwork.
Did you take pictures in the field? Do you have handwritten notes from your participant observation or audio recordings of your interviews? Did you have videos from your focus group discussions? Analyze all this data together with MAXQDA. That’s right, you can apply codes directly to your original source materials and then retrieve image and audio/visual segments right alongside your transcripts, literature, and other text documents!
Step 1: Import Data
To start off, look at images as an example of how to import your fieldwork data into your MAXQDA project:
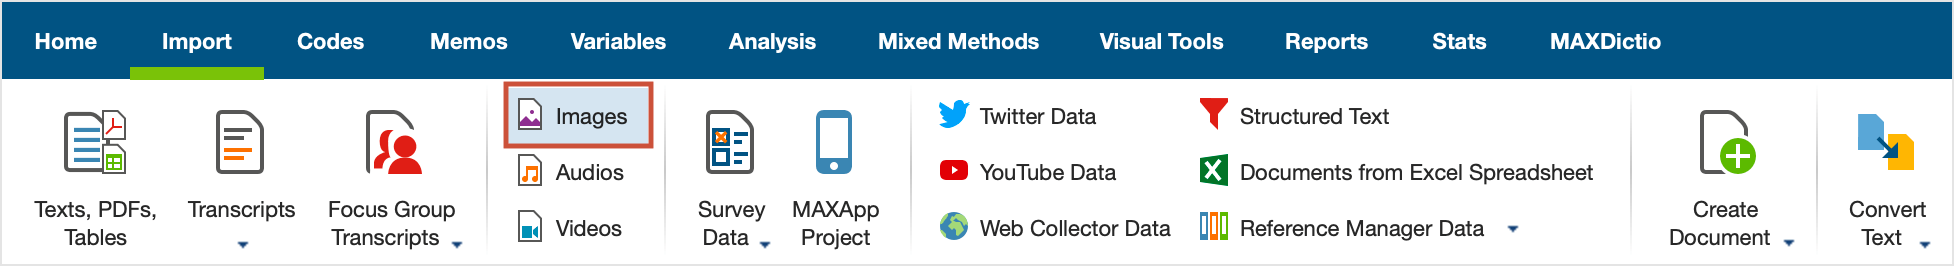
- Go to the Import tab in the top left-hand corner in MAXQDA and click on the leftmost icon Documents.
- A dialog window will appear, where you can select the files (in this case images) that you wish to import. If you press and hold the Ctrl (for Windows) or cmd (for Mac) key when selecting images, you can select and import multiple files at the same time.
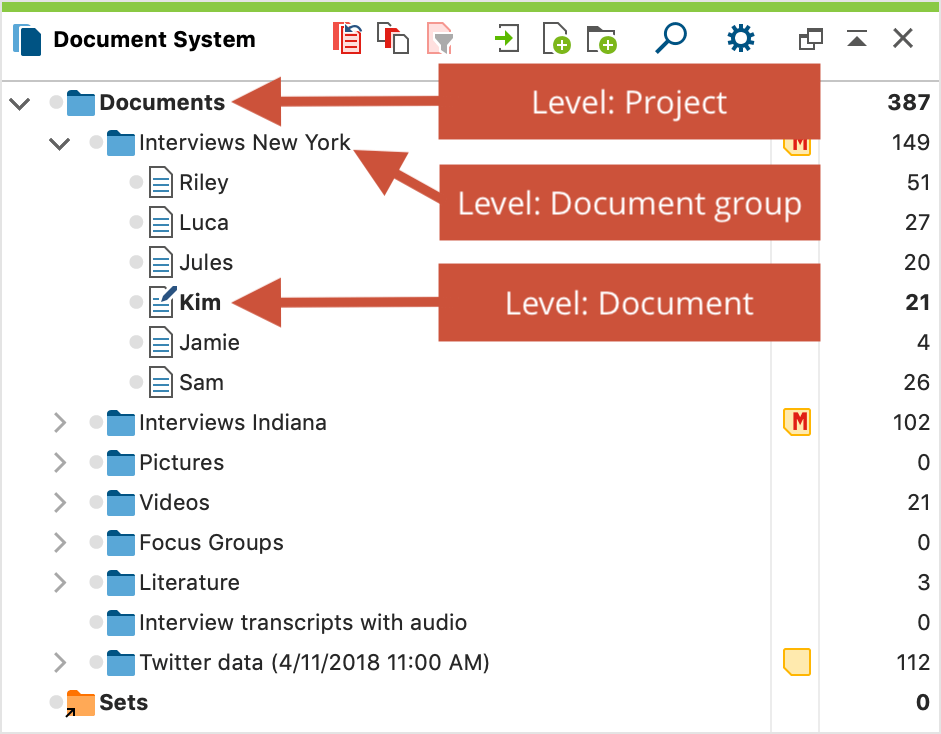
- All the files will be inserted into your MAXQDA project and displayed in the “Document System” window, where you can order them in a document group if you wish.
You can also choose to import your images by dragging and dropping them into your Document System, by clicking the Import Documents icon in the “Document System” window toolbar, by right-clicking the root folder in the Document System, or you can import images by using the keyboard shortcut Ctrl+D (for Windows) or cmd+D (for Mac).
Step 2: Group Data
How you organize your data will depend on your research data, goals, and methods. If you are unsure about how to best organize your data, play around with different approaches, and see what works best for you. Don’t worry, you can always re-organize and sort your files later without having to recode!
A way to start organizing your documents is by creating document groups. You can, for example, create a document group for each research site you are going to. This method would allow you to create cases based on location. A project can contain as many different document groups as you wish to create but it is not necessary that each document is put in a document group.
A great MAXQDA function that is often overlooked is the document group direct import, saving you the steps of dragging and dropping files into the folders. Documents can also be temporarily grouped together from various document groups for certain aspects of your analysis. In MAXQDA, these groupings are called “document sets”.
Step 3: Create Subfolders
New in MAXQDA 2020.1 is also the Subfolders function, allowing you to create a further level of data organization. Subfolders make it easier to work with “cases” in research projects where one case may consist of more than one document. Say you are analyzing interviews and each interview you conducted is accompanied by several drawings made by the person being interviewed or if you have several transcripts per person, subfolders are a great new way to organize your data into cases!
For example, if you are grouping your interview data by location, you can create a subfolder per person you interviewed. You can add the interview audio file, interview transcript, fieldwork images, and participant observation notes into that person’s subfolder. Subfolders allow you to see and manage all of your research data together and add the benefit of keeping any extractions from your data as well as conclusions you draw from your data in context!
To install the free update MAXQDA 2020.1, follow these three easy steps:
- Open MAXQDA 2020 with a stable internet connection.
- Select the “?” query symbol in the top right-hand corner of the screen,
- And select “Search for Updates” from the menu.
MAXQDA will then install the new update and you can access the following new features and many more improvements for free! If you are using one of your institution’s computers and have limited admin rights, please contact your local administrator.
Step 4: Assign Document Variables
Finally, an easy way to further organize your data as well as integrate mixed methods into your data organization is by using MAXQDA’s Variables functions. Variables allow you to assign socio-demographic information to your documents, such as gender, age, education level, etc. that can then be analyzed in conjunction with the actual text.
Simply go to the Variables tab in the main ribbon menu, and click the first icon called List of Document Variables, which is where we can see our current variables and create new variables. User-defined variables are indicated with a blue symbol in the first column – these variables can be modified or deleted as desired.
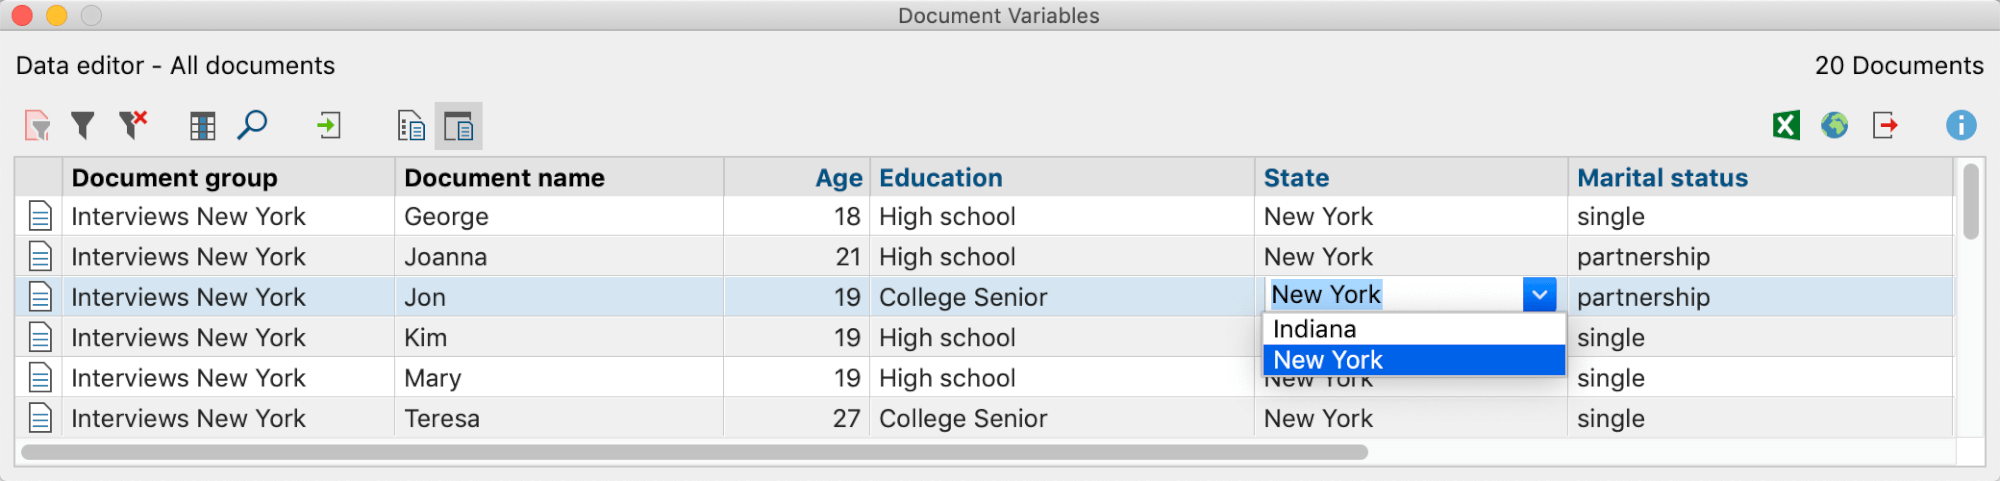
In the next function, MAXQDA’s Data Editor, we can populate those variables. The columns always contain the variables, the rows contain the documents. You can also add code variables, but let’s take a look here for now. This chart is where we can put the data in by double-clicking any of the empty spaces in the blue columns. Then, we can use those data in the analysis.
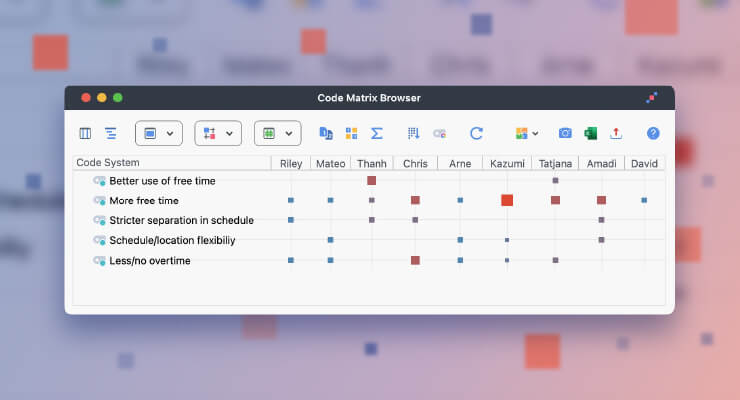
Now we go back to MAXQDA’s Mixed Methods tab (or by right-clicking on the Documents icon in the “Document System” to open the context menu) and choose to Activate by Document Variables. This function especially helpful if you are analyzing a lot of individual documents. Now I can work with my activated documents to get some key information about what certain segments of my study’s participants said!
Variables are also a great tool for analyzing survey data because you can make the closed questions into variables and open questions into codes, thus seamlessly adding a survey to your project and going further into mixed methods analysis from there!

MAXQDA Photo Contest submission “Niños Yshyr Tomarahõ (Children from Yshyr Tomarahõ)” by Nolberto Valdez
MAXQDA truly is a leader in mixed methods data analysis, and there are so many more great tools, including an entire Stats module, where you can, for example, run descriptive statistics analysis. In conclusion, your fieldwork data analysis is now quicker and easier than ever before because everything is in one place!
As qualitative and mixed methods researchers, we all know how important context is, and with MAXQDA 2020.1, it has never been easier to put your data into context. Test MAXQDA completely free and without obligation for 30 days!
MAXQDA Photo Contest 2021 – #PictureYourResearch

Do you have exciting pictures from the field, lab, or office that you’d like to share with the world? At VERBI Software, we are convinced that behind every MAXQDA project there is a story worth sharing. #PictureYourResearch – show us the world through your eyes and share a moment from your research journey with the global MAXQDA community! Submit a photo from your research project for your chance to win by September 22nd, 2021 here: