MAXQDA offers a variety of options to export data, search results, visualisations, variables, or reports to different data types for use in reports, presentations, papers or to transfer the data to a statistical software. This tip of the months introduces you to 15 exports and visualiations that can help you share and present your findings.
If you’re looking for general export options you can find them in the “Reports” tab, but opportunites to visualize connections, data and results can be found in many places all throughout MAXQDA.
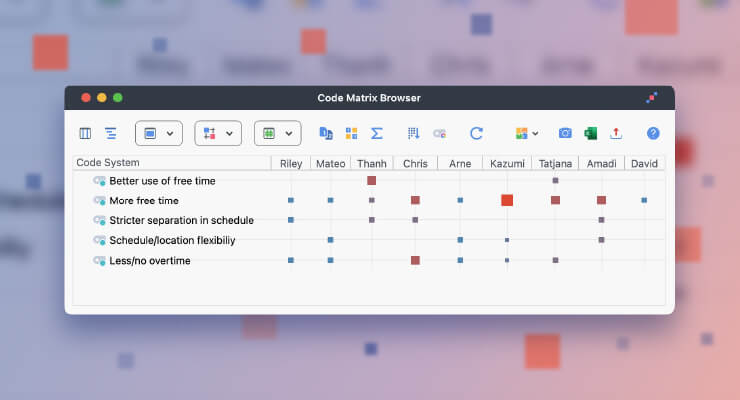
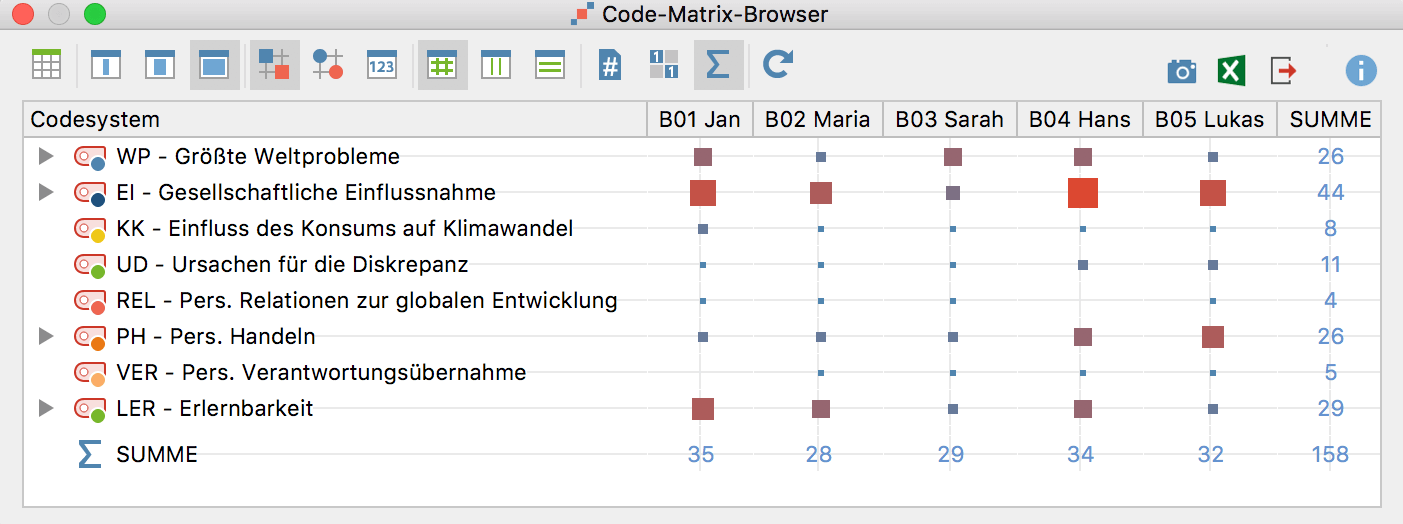
Code Matrix Browser
If you want to visualize which codes have been assigned to which documents, you can use the Code Matrix Browser. The matrix provides an overview of how many document segments from each document have been assigned a specific code, and this for each existing code. Thereby the Code Matrix Browser might give you clues to relevant themes and makes it easy to compare this room between your interviews. The view option can be changed to numerical, if you want to view the frequencies as numbers.
Use it to:
- Display and compare how much room any topic occupies in different documents
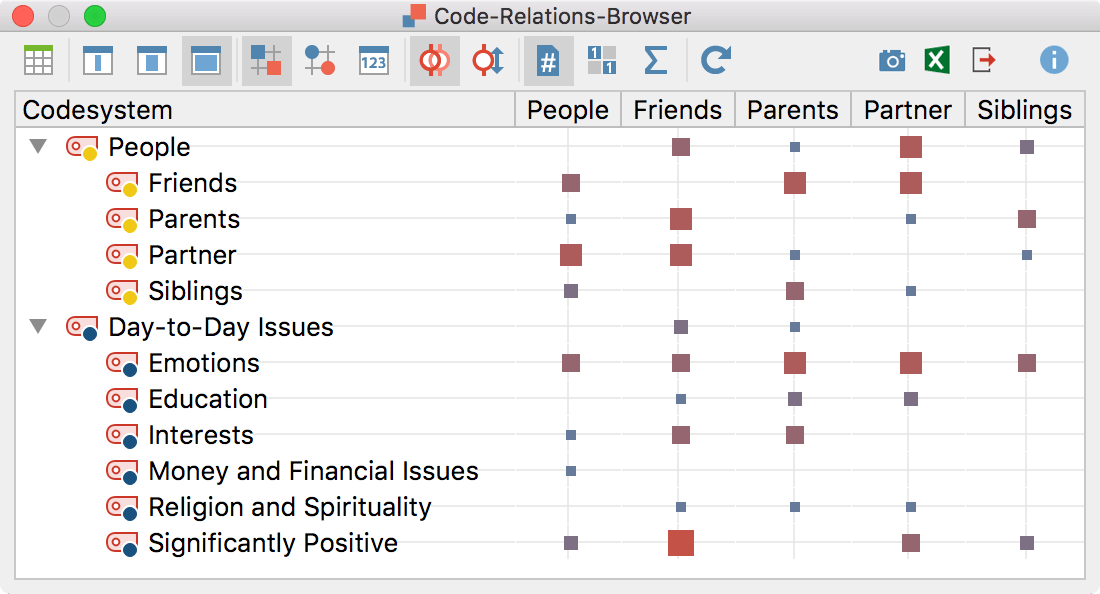
Code Relations Browser
The Code Relations Browser is a visualization of the relationship between codes. A table shows how many document segments any two codes are attached to. This might be of great value for your work because you get a visual impression of thematic clusters that might otherwise escape your attention. The representation is similar to the Code Matrix Browser, but in this case, the little squares/circles stand for the number of co-occurrences of codes. By code-activation you can decide which codes MAXQDA checks for co-occurrence and you can even choose if you want the Code Relations Browser to count and display strictly those passages in which the respective codes are overlapping or if you want it to count also those Passages, in which the respective codes are near to each other.
Use it to:
- Visualize (non)-existing relationships or connections between themes
Crosstabs
Crosstabs function is a visualization of the relationship between document variables and codes. Social categories, such as men and women, or people with different personal backgrounds, etc. can be compared based on variable values. All of the variables that are in your project can be used to set up a group.
Use it to:
- Compare topics and themes by groups based on frequencies and make results easy to understand for outsiders

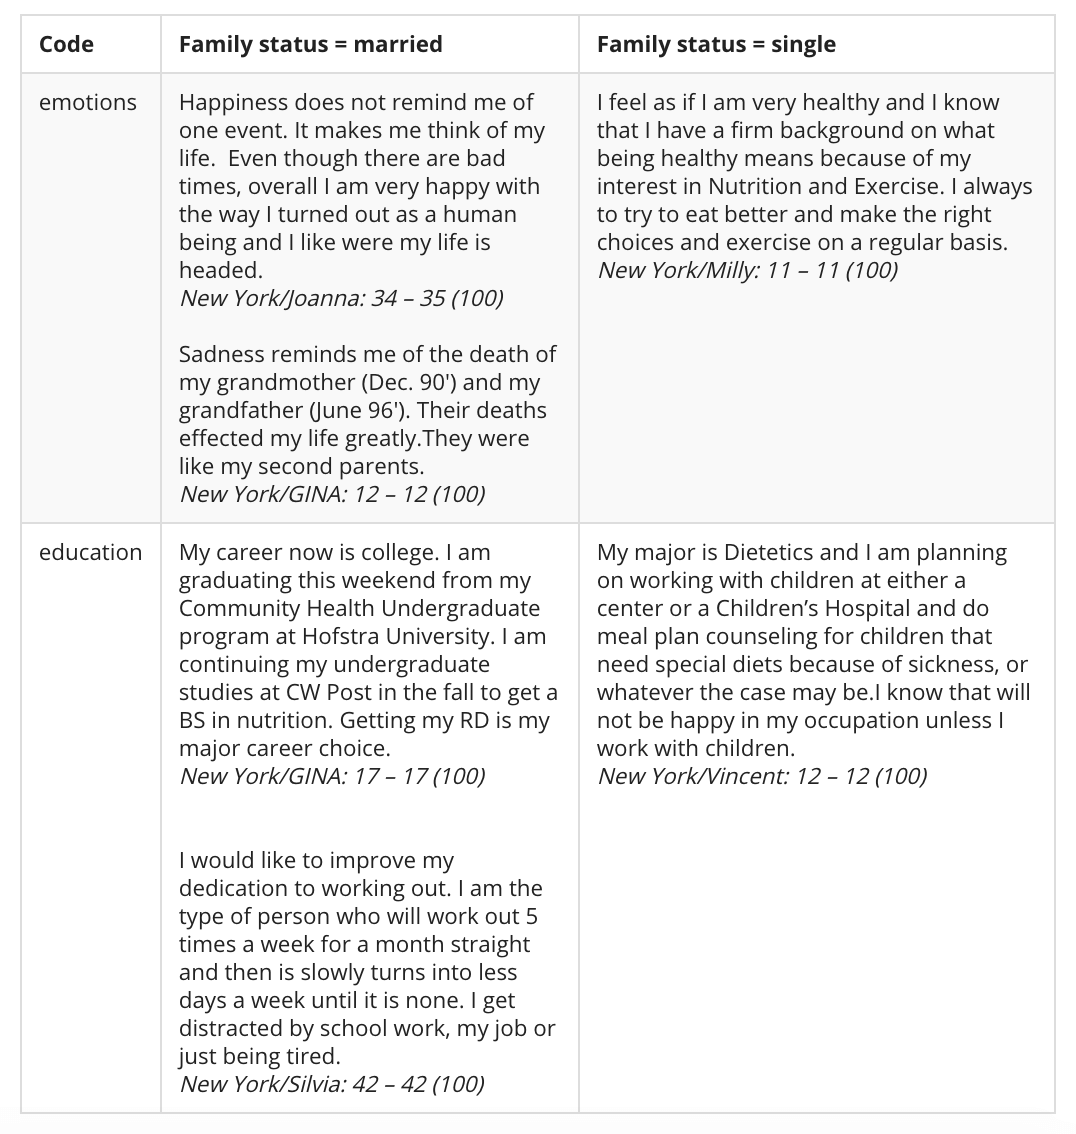
Quote Matrix
The “Quote Matrix“ is based on the same idea as the Crosstabs function, i.e. to create a joint display of themes and quantitative variables. The Quote Matrix does this on a more detailed, non-aggregated level. Here the coded segments themselves are listed in the cells of the matrix, not only the number of coded segments for that particular cell. In the example below, we can see a comparison about what married and single people said about certain themes.
Use it to:
- Share rich information about differences or similarities between different groups
Smart Publisher
Smart Publisher is a convenient report generator. It exports selected retrieved segments in a formatted Word document report, including title page and table of contents. The structure of the report is determined by the “Code System:” An individual chapter will be created for each top-level code – A subchapter will be created for each subcode. – Coded Segments of each code form the content of each (sub)chapter.
Use it to:
- Produce frequent reports to share with stakeholder or supervisors
- Print out coded segments if you prefer to read on paper
- Attach as citations to your papers when you hand them in
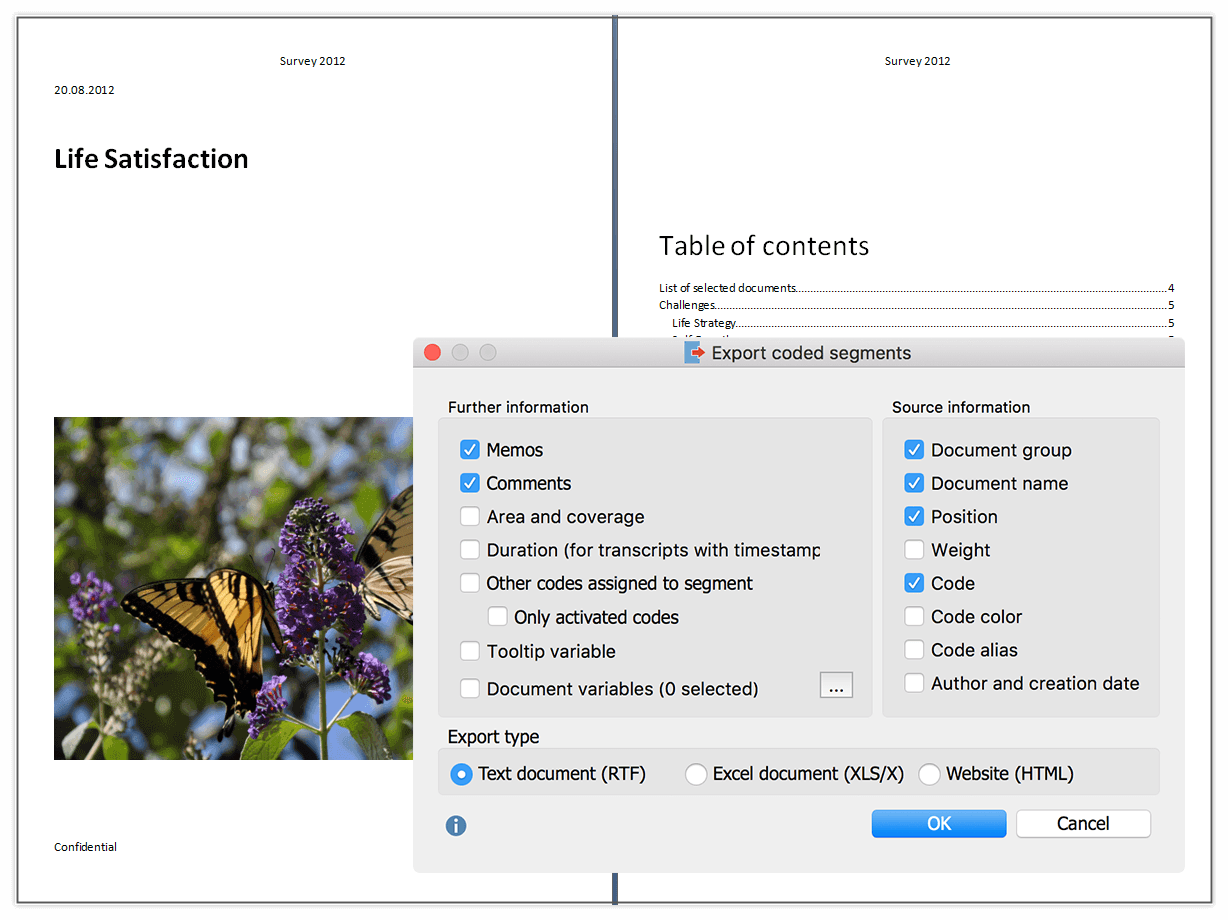
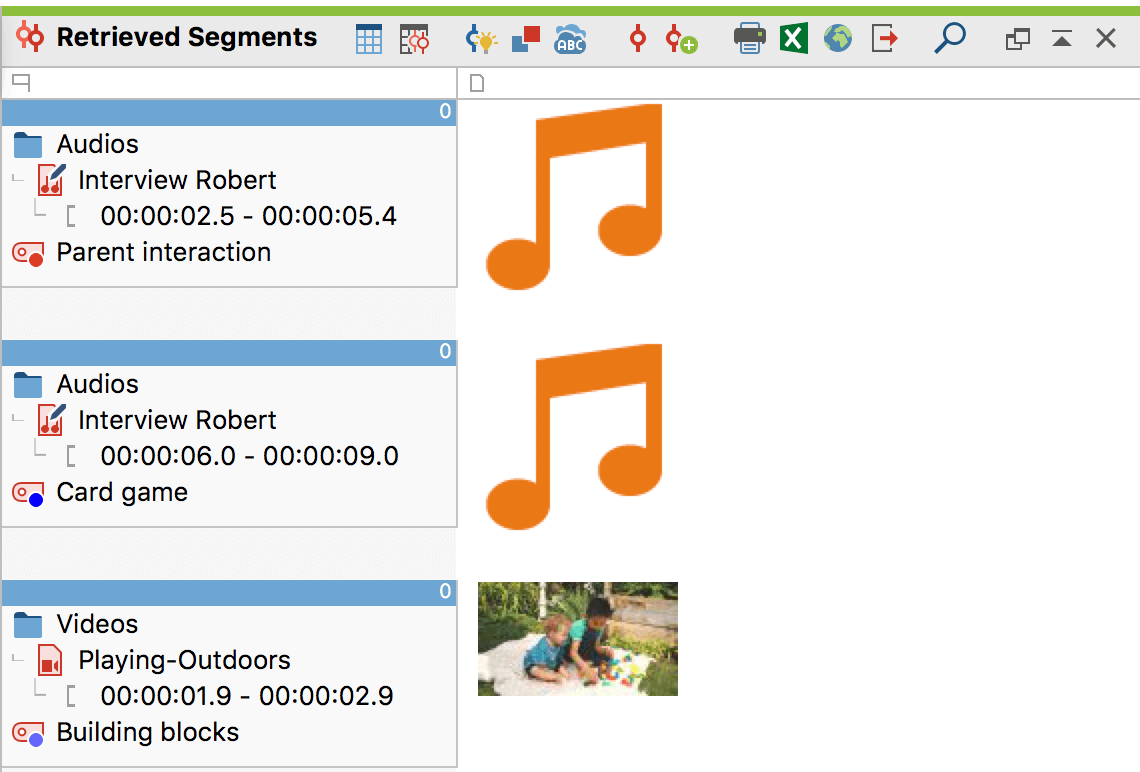
Export Retrieved Segments
You can export results of your retrievals as Excel, HTML and RTF files containing the coded segments along with comments, memos and all the information about its exact location, creation date and weight score. Just click on the export icon in the Retrieved Segments window.
Use it to:
- Save results of complex retrievals for later analysis
- Share very specific results with somebody
Statistics and Graphics
If you need frequency tables and charts, which indicate the frequency of subcodes, code variables or document variables you can use the Statistics and Graphics module built into MAXQDA.
Use it to:
- Support your argument by frequency tables
- Create diagrams to use in reports and presentations

Summary Grid Tables
A “Grid Table” is an overview table of summaries and document variables for selected documents and codes. It gives you an overview of the summaries for selected topics. Grid Tables are a useful tool for presentations and publications.
Why use Summary Grid Tables?
- Present condensed accounts of specific topics
- Compare what essential meanings different subjects attach to some theme
- Give your audience a fuller understanding of your theory building process

Typology Table
This function offers yet another way to combine quantitative data and your codes or categorical variables. It is called a Typology Table, because it is able to calculate various variables and their percentages (means, standard deviations, etc.) for qualitative typologies.
Use it to:
- Show your audience how you used your data to find types and patterns

Configuration Table
Code configurations enable you to examine the co-occurrence of codes in a document or segment; They are particularly suitable for analyzing code combinations. Code configurations can effectively support a multi-dimensional analysis as well as the formation of types through identifying patterns.
Use it to:
- Show similarities or contrasts in your data on the basis of code patterns

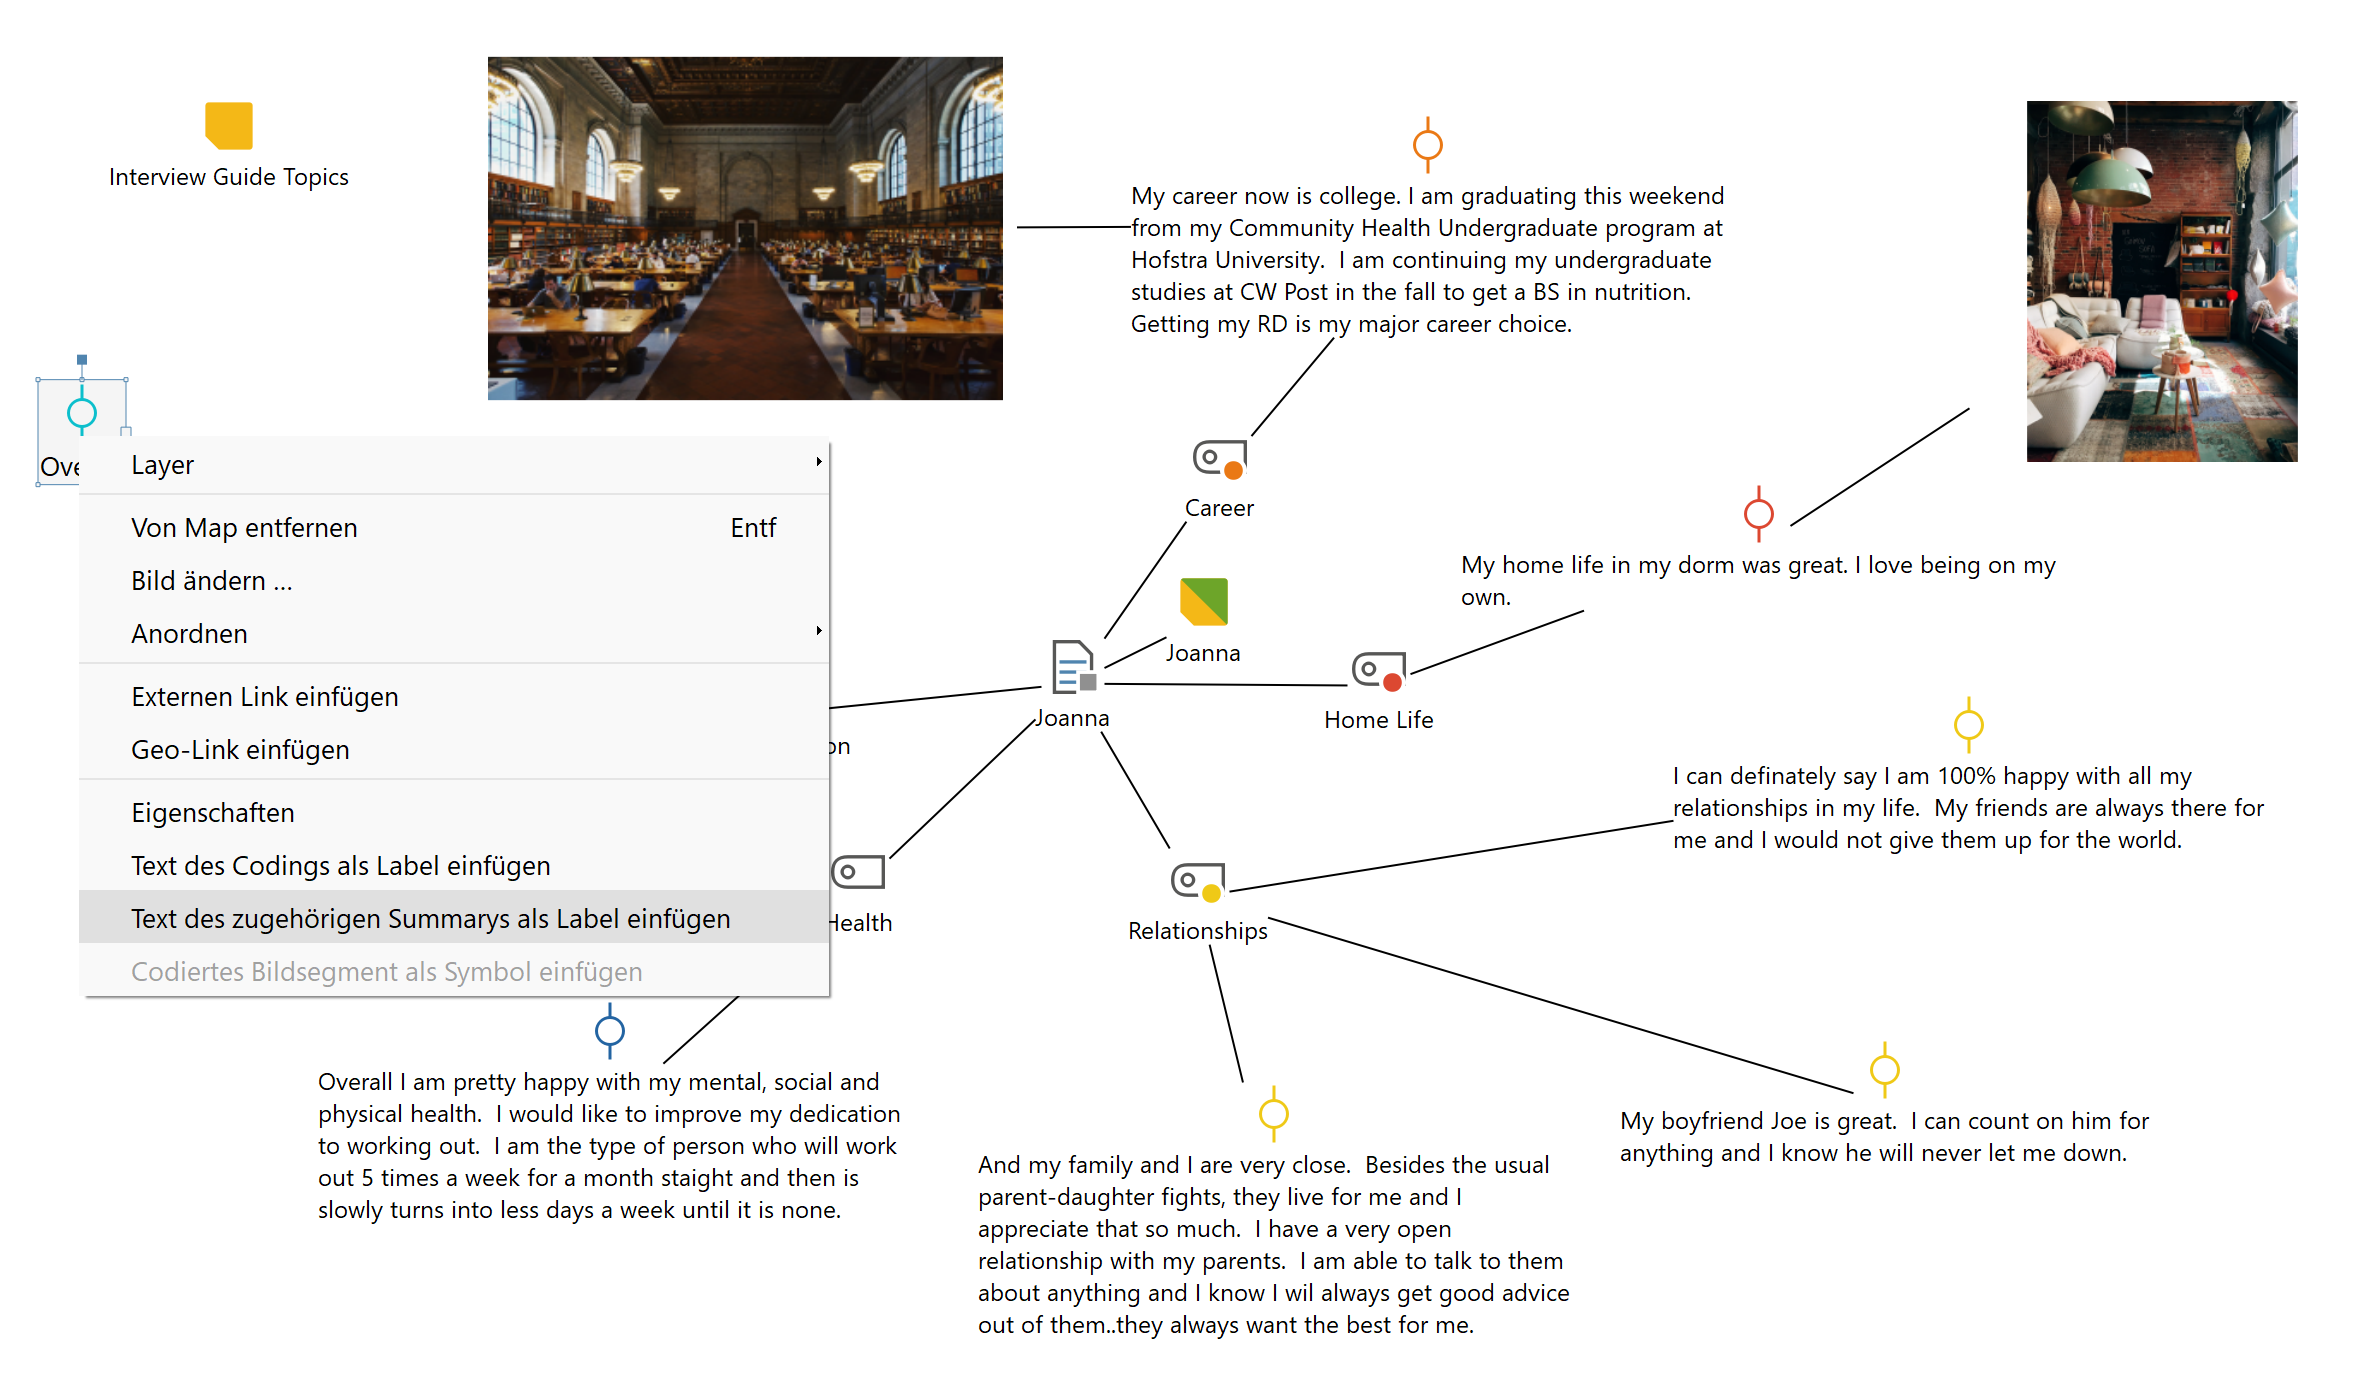
MAXMaps
Manually or automatically create maps with this integrated mapping tool to display your analytical process and its results.
Use it to:
- Illustrate connections, results, theories and more by arranging documents, codes, codings, memos, images or free objects
- Share mind maps you created during analysis
- Use layers to show layers one by one to reconstruct your working process when presenting to an audience
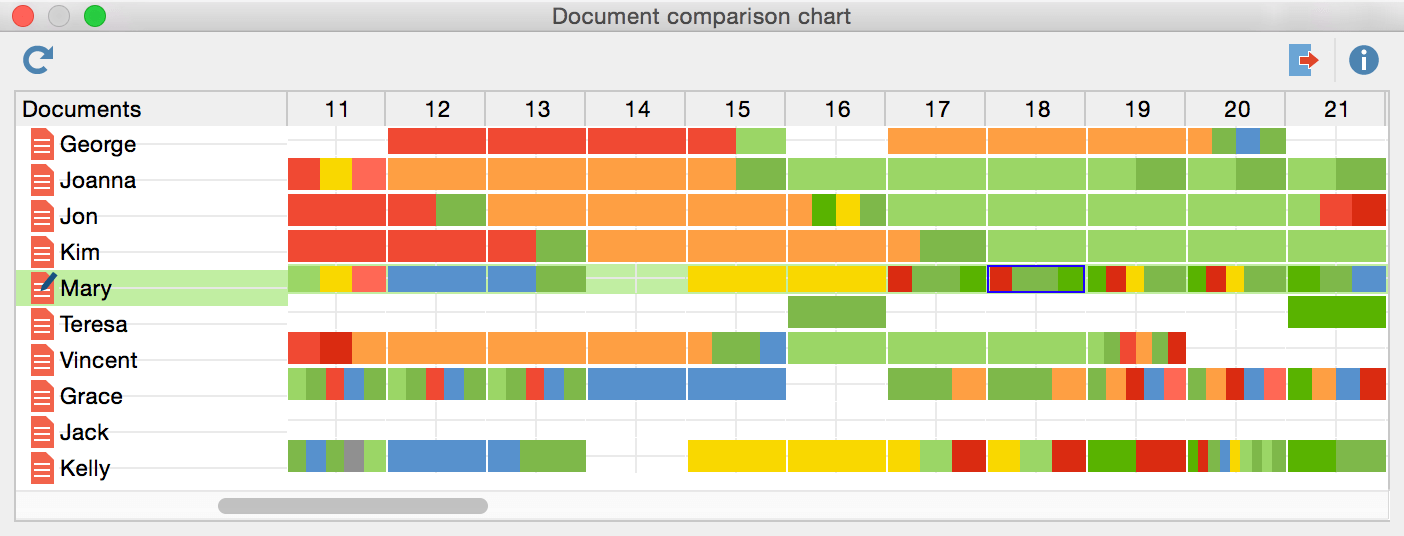
Document Comparison Chart
A single mouse click presents a striking picture, comparing texts at a glance and letting you know which codes were assigned in which paragraphs. You are completely free to decide which codes and texts should be included in the comparison.
Use it to:
- Show how the course of interviews differ.
- Illustrate prevalent topics and compare them between interviewees.
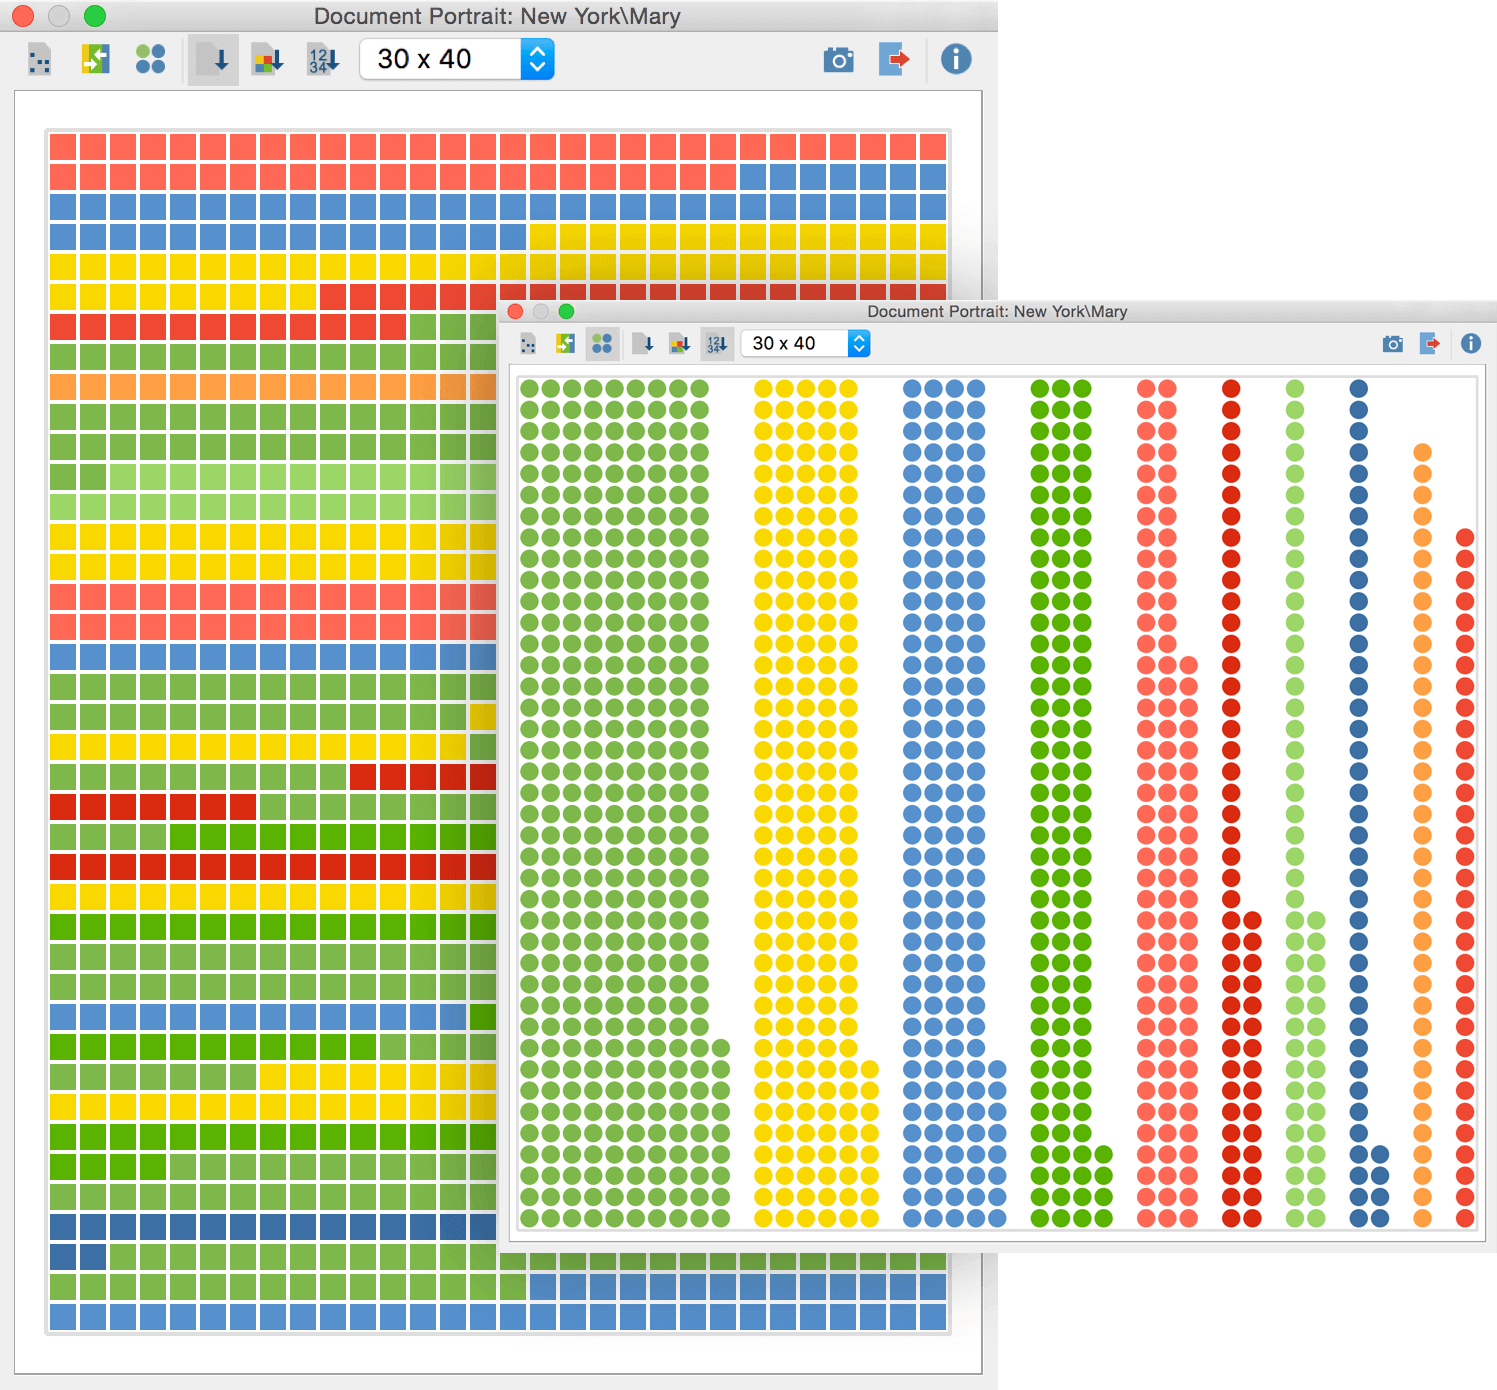
Document Portrait
Displays any text as a „painting“ of either all or specific, selected codes assigned throughout this text. Choose colors for your code to assist you in your analysis, e.g. a special color for emotional factors (red) or economical factors (green).
Use it to:
- Generate coherent visualizations that reflect the weight of a topic without ignoring the differences in length between interviews.
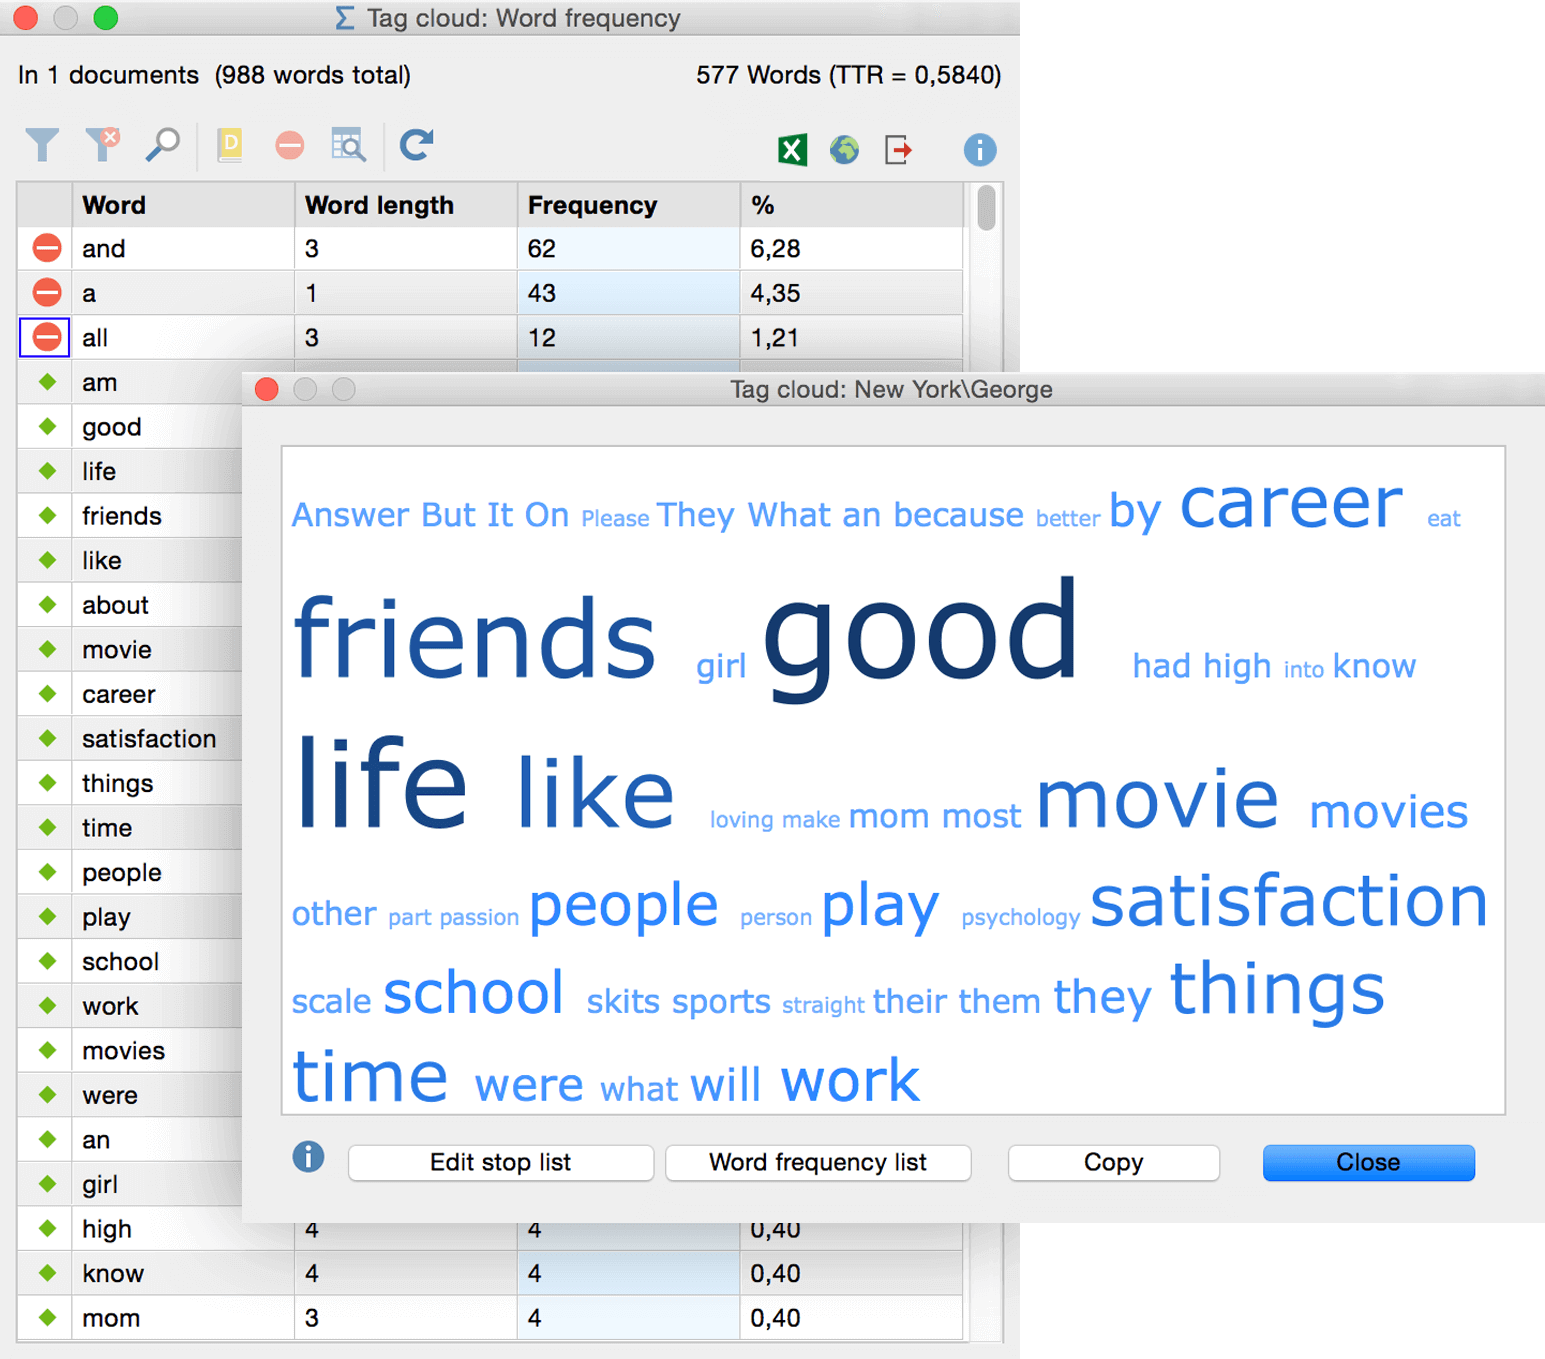
Tag Cloud / Word Frequencies
Tag clouds offer you a simple way to visualize the most frequently used words in a document. The list of word frequencies can be found right underneath the visualization.
Use it to:
- Illustrate the most frequently used words in your text data or limit it to most important topics to compare their frequencies
Export Variables to SPSS
MAXQDA provides basic functions for the statistical analysis of variables within the program. For further statistical investigation, such as cluster or factor analysis, it is necessary to export the document and code variables. MAXQDA lets you easily do this using different file types of which XLS and XLSX are obviously the most appropriate for statistical purposes.
Use it to:
- Continue your analysis with advanced statistics