Guest post by Timothy Silberg.
This is my third and final fieldwork diary entry about analyzing data using MAXQDA software. One component of the research investigates how land tenure institutions, social relations, and other components of a political-economic environment affect Malawian farmers’ preferences for practices to control parasitic weeds (Striga spp.). I mentioned in my second blog post that I would try to highlight and explain these differences using one of MAXQDA’s visual tools.
Highlighting gendered motives behind farming practices using MAXQDA, the ideal data analysis software for the mixed methodologist
I used a sequential explanatory design to organize my data collection and analysis. I first facilitated focus group discussions to assess farmer knowledge about Striga, the control practices (CPs) they used to address the weed (see Image 1), and the attributes they considered before implementing a CP. Focus group transcripts were then imported into MAXQDA to determine which attributes emerged in discussions. Discrete choice experiments (DCEs) were composed based on these findings. DCEs were presented to smallholder farmers (cultivating less than 2ha) in the form of hypothetical scenarios, each having three CPs with five attributes at varying levels. At the same time, household surveys were carried out to assess socioeconomic differences/similarities between CP implementers.
After data collection, a random parameter logistic regression (mixlogit) analysis estimated which attributes were significantly associated with CP decisions and which tradeoffs farmers were willing to make to implement CPs.

Image 1 – Striga asiatica emergence in a pot sown with a susceptible host (Zea mays). The experiment was organized by Timothy and a co-instigator Cyprian Mwale
Mixed method approaches often integrate two polarized methods simultaneously or in a sequential manner. In this case, I analyzed different connections between Striga spp. knowledge and CP preferences in MAXQDA’s MAXMaps feature while running my regressions. Then in the field, I inquired about CP preferences by using induction (or discovery of patterns), deduction (testing of theories and hypotheses), and abduction to uncover and use the best set of explanations for understanding results. MAXQDA facilitated the employment of this sequential explanatory design; orienting my instrumentation to explore confounding results. Sequential mixed methods designs are useful when unexpected results arise and require further clarification, and during my analysis, unexpected results did arise.
Anticipating confounding results – MAXQDA Code Relations Browser to-the-rescue!
Many times, when qualitative and quantitative methods are used separately to analyze farmer decisions, findings are not generalizable or do not highlight the context-specific nuances. After several months of analyzing data from DCEs, it became evident that summary statistics and parametric tests were limited in explaining the difference between male and female participant decisions, especially in the willingness to pay space (see Table 1).
For example, men were willing to sacrifice 7.57% more losses in maize yield for CPs with lower labor requirements than women were willing to sacrifice for CPs with higher labor. These disparate results could not be explained by other quantitative data (e.g. socioeconomic differences between genders) or analyses.
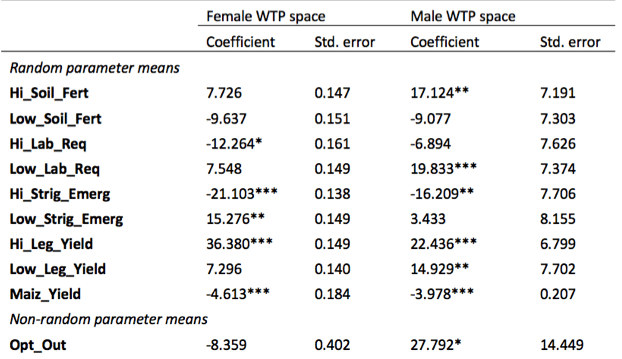
Table 1 – Willingness to pay space for Striga spp. control practices across gender
Instead of trying to use more quantitative methods in the analysis, I took a qualitative approach to analyze the data, using MAXQDA’s Code Relations Browser to explore the differences between CP descriptions across genders. To do this,
- I began by activating all “Method Preference” sub-nodes in my code system (see Image 2).
- I then selected the Visual Tools Tab and clicked the Code Relations Browser.
- I was given the option to choose which sub-nodes would be displayed in the rows and columns. I selected all the Method Preference sub-nodes for the row, but in the column, I checked “Choose Top Level Code” and selected “Male Respondents” and “Female Respondents”. I repeated this process with the “Mention or Preference for Striga Control Trait” sub-node as well.
- MAXQDA generated a frequency map, indicating where there were more or less mentions about a particular Striga spp. control trait or method by each gender (see Image 2)
- By clicking the Quote Matrix icon, MAXQDA generated cross-reference quotes between gender and traits/methods. Then I selected the option to export the document to Excel.
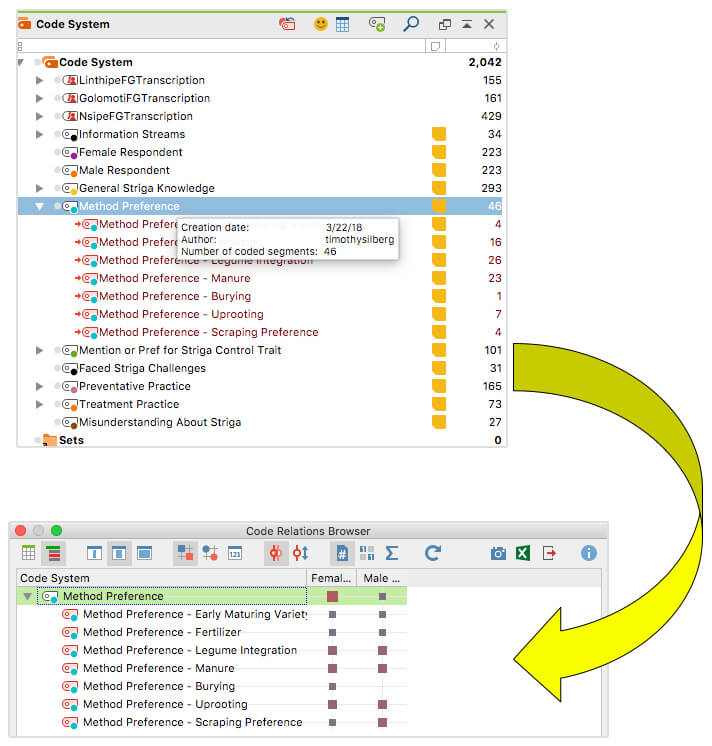
Image 2 – Assessing gendered control practice preferences with the MAXQDA Code Relations Browser
As I scrolled through summaries of coded segments, a richer description of previously confounded quantitative results began to emerge. For instance, each gender was concerned about labor requirements differently. Male focus group participants were willing to pay for lower labor requirements to control Striga spp. whereas female participants mentioned multiple times they would only implement a CP if they could manage it themselves. When asked which practices each gender preferred, the female narrative (as shown in Image 3) seemed to avoid any practice associated with intensive labor requirements. Concern for labor requirements may stem from previous experiences when new technologies shifted the burden of increased weeding labor to them.
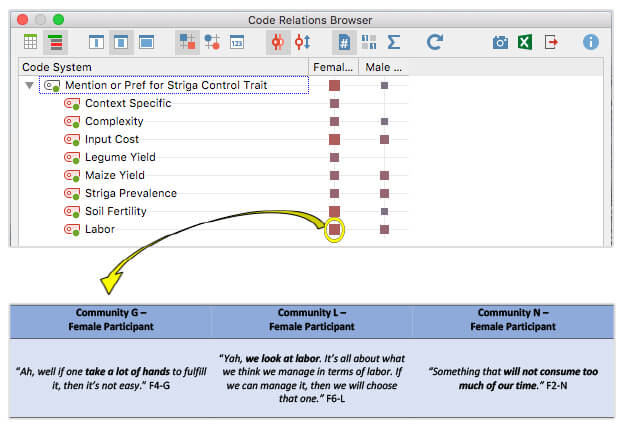
Image 3 – Assessing gendered control practice trait preferences with MAXQDA’s Reports Tool – Summaries with Coded Segments
Closing thoughts about my analysis using MAXQDA
My fieldwork in Malawi has been challenging, but a rewarding experience. With the support of an incredible research team, we were able to collect over 150 household surveys, 320 soil samples, and 1290 decision scenarios. One of the most critical lessons I have learned about the collection and analysis of data in the field is that it is an iterative process, sometimes demanding researchers to go back, redevelop and refine instruments, or rerun tests to clarify findings. Having a flexible research design supported by flexible research software, permits researchers to adapt to unexpected changes. I credit MAXQDA for this flexibility.
The research software has permitted a more holistic analysis and understanding of parasitic weed emergence in the central region of Malawi, and hopefully, improved research and policy for smallholder weed CPs. The addition of qualitative methods (e.g. thematic analysis) helped unveil the context-specific nuances behind these decisions.
MAXQDA’s MAXMaps streamlined the thematic analysis by unveiling various connections between gender and CP. I do not believe these connections would have been discovered without the use of MAXQDA’s various visual tools. In addition, I fear much of these findings would raise ‘red flags’ in my defense, and most likely, with reviewers from a peer-reviewed journal.
It has been a joy learning how to use the mixed methods software. My Professional MAXQDA Trainer Dr. Timothy Guetterman was critical in helping me navigate the various analysis tools MAXQDA had to offer. I appreciate his help and look forward to using MAXQDA in my future analyses.
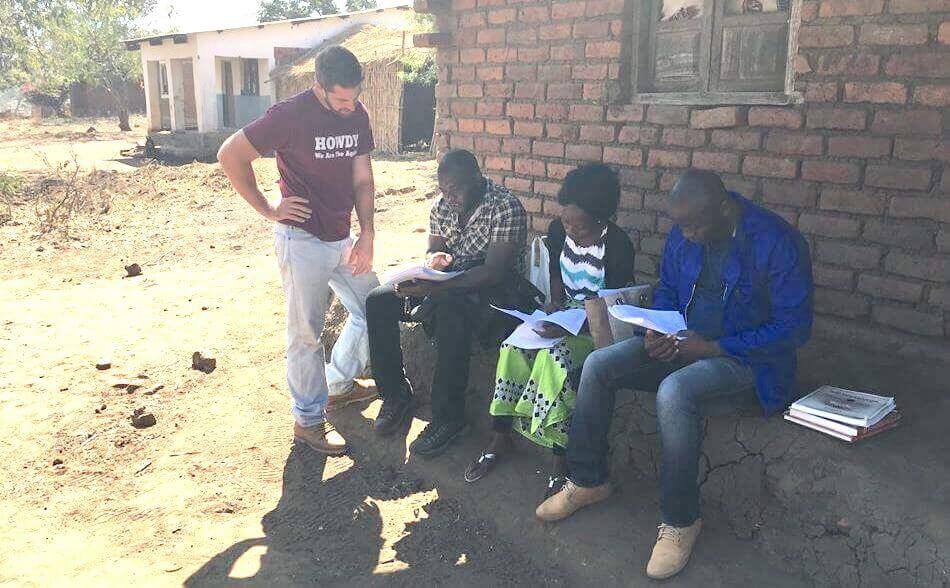
Image 4 – Timothy calibrating the survey instrument with enumerators in Malawi
Editor’s Note
Timothy Silberg is a recipient of MAXQDA’s #ResearchforChange Grant and is a PhD candidate in the Department of Community Sustainability at Michigan State University, USA. The year-long fieldwork phase of his research project titled, “Modeling Parasitic Weed Emergence – The Case of Malawi” began in May 2017 and finished in May 2018. He has since returned to his university and will defend his dissertation in November 2018. This is his third and final fieldwork diary entry. Follow Timothy’s entire research journey with MAXQDA through his previous posts and stay tuned to see his published manuscript using this software!