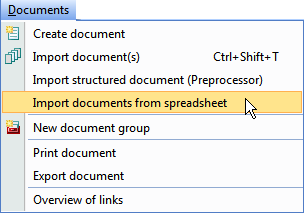
There are many situations, in which standardized data is needed in addition to your qualitative data. Especially when the researcher is aiming for a complex research design, a combination of quantitative and qualitative factors can be extremely helpful. In the case of online surveys, the collected data are often displayed in spreadsheets, which include responses in text form as well as variables, such as age or place of residence. With MAXQDA, you can simply import all of these data at once through the Import documents from spreadsheet feature.
 Importing quantitative and qualitative data from a table is very easy. Your Excel spreadsheet only has to be structured in the following way: each row represents a document, and each column represents a text answer or a statistical value. The first two columns contain the keywords “text group” and “text name”. The other columns can be assigned any name. Columns containing variables need to be marked with a “$” in front of their name.
Here is an example of a table before importing it to MAXQDA:
| document group | document name | How do you like…? | What would you….? | $Age | $City |
| Staff Member | Interview_1 | text text text text text text | text text text text text text | 45 | Chicago |
| Student | Interview_5 | text text text text text text | text text text text text text | 19 | Chicago |
| Staff Member | Interview_2 | text text text text text text | text text text text text text | 32 | Minneapolis |
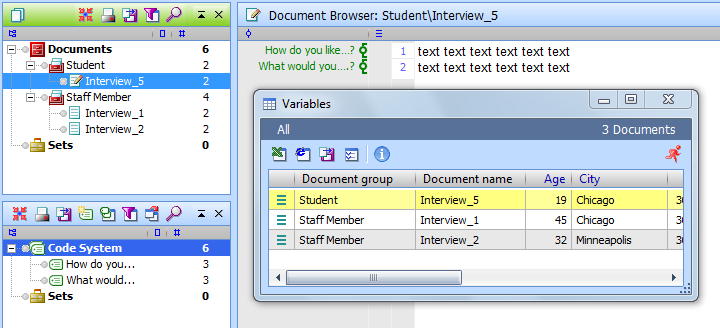
This way you can, for example, assign each of your interviews to the city in which it was conducted and later compare the results from different cities in MAXQDA. Text answers are coded automatically with the column header, and these codes are added to the list of codes. The documents are assigned the respective value of the variable from the variable columns.


