You have coded all of your data – now what?
The most important notion here is that a software will not interpret your data for you. MAXQDA has powerful and easy-to-use tools that help you during the steps you take to interpret your data, but no qualitative analysis software can do the interpretation for you.

Don’t forget that coding your data is already part of your interpretation. When you tag data with codes you make tons of little decisions, e.g. which parts to code, which code to attach and where to start and end your code.
You probably also arranged and re-arranged your code system during the coding process, again making decisions how to group codes together and how to organize them in a hierarchical order.
Your Research Method
Your research method sets the tone for your research project. You might be following strict rules in the way that you organize and summarize data, you might have a lot of data to look at, you might only work with images, or you might have a mix of qualitative and quantitative data to take into account. No two projects are exactly the same.
The next chapter introduces some of the analytical tools, that you could use to interpret your data. Pick what works for you and do not worry about using each and every tool available. What drives your project forward is your search for the answer to your research question. Use the tools that help you find the answer. Your research project determines which tools are useful in getting your research needs met.
So go ahead and get that research question answered.
Interpretation Tools in MAXQDA
Simple Retrieval
Call up all of the coded segments for one code, one document, multiple codes, multiple documents or a mix of the above by activating the code(s) and document(s) you are interested in. The retrieval windows always shows you exactly the results you want to see.

Complex Retrieval: The Coding Query Tool
Filter your results with powerful search filters. Look for overlapping of codes, codes that follow close to each other, codes within another code and much, much more.
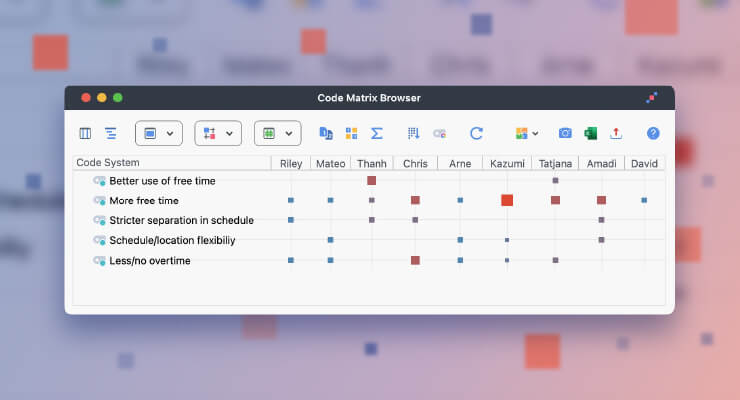
Visual Tools
The best way to look for patterns or contrasts in your data. Visual tools allow you to look at your data from new angles and make things visible, that you might have missed otherwise. Perfect to spark new insights, ideas and theories or to share your results with others through clear illustrations.

Memos – Database for your theories
Everytime a brilliant thought comes to mind, write it down in a memo and attach it to any part of your project. Or start a new memo and write down that first chapter for your report. The memo manager makes sure you never lose a single thought. Easy to export.

Code Comments
Know the feeling when you code a piece of text or image and want to quickly summarize the essential of the coded segment? Code comments let you do just that. Also a good way to summarize each coded segment and use the comments to refine your code into a more detailed subcodes later on.

Summary Grid
For each of your documents, summarize all those text passages that you assigned to a specific code. Afterwards you can much more quickly compare results for each category by document. Or take it a step further and create Grid Tables to neatly organize and compare summaries for multiple codes at once.

MAXMAps
A tool that can be used like a mind map, but every element is deeply linked and integrated into your project. Get started easily by using templates to create your maps and continue to lay out your thoughts and theories freely in this one-of-a-kind tool. Not just for presentation – illustrate complex relationships or theories on multiple layers with codes, documents, text, images and links.