MAXQDA’s new sentiment analysis feature allows you to quickly determine people’s emotions toward a certain topic within the context of Twitter data. To do so, our sentiment analysis uses a specifically defined polarity lexicon and a set of logical rules to identify the sentiment of a tweet. This feature is particularly useful for researchers working with large data sets given that those can now be split into categories automatically. Sentiment analysis for tweets is available beginning with MAXQDA 2020.4.
As a quick example of how sentiment analysis can be integrated in your research, we carried out a research exercise which investigates people’s feelings toward and perceptions of various COVID-19 vaccines. To do this, we proceed through the following steps:
- Create the Twitter dataset
- Perform sentiment analysis
- Examine statistics
- Autocode tweets with sentiment labels
- Revise sentiment labels
- Evaluate results
Create the dataset
Firstly, you should build your dataset using MAXQDA’s Twitter import function. To do this, either identify hashtags or search terms that should be contained within the tweets you would like to explore.
For our example project, we created a dataset of tweets for each COVID-19 vaccine that we included in our research exercise. Accordingly, within the Twitter import window, we specified for each dataset that the vaccine’s name and terms such as “vaccine” itself should be contained.
Twitter Data Import in the MAXQDA Manual
Perform a sentiment analysis of your data
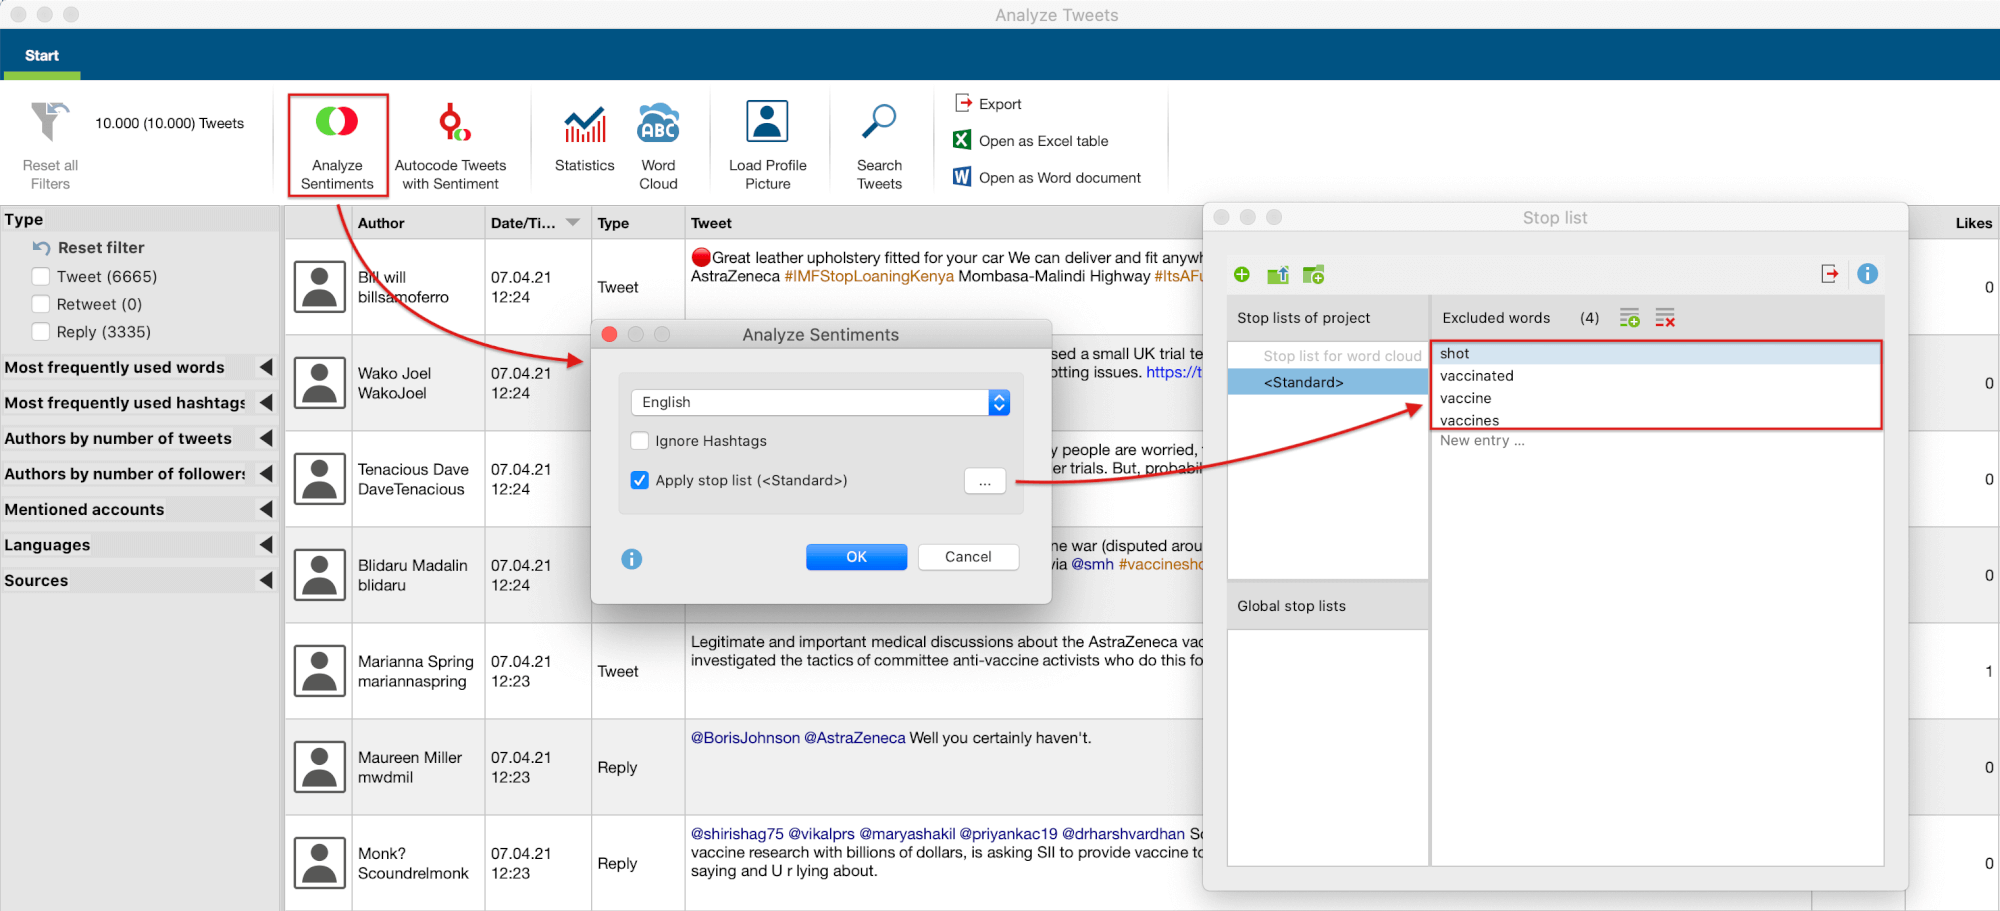
To carry out a sentiment analysis, open the Analyze Tweets window via Analysis -> Twitter and select your previously created dataset. Now you can easily click on Analyze Sentiments and determine the settings appropriate to your topic of research. It may be necessary to ignore certain words which express a clear bias towards either negative or positive polarity.
For instance, assuming that words such as “vaccine”, “vaccinated”, and “shot” themselves have a connotation towards positive or negative polarity, we decided to ignore those terms in our example by adding them to the stop list and therefore restricting the impact of such words on our sentiment results.
 Applying stop lists within the sentiment analysis feature.
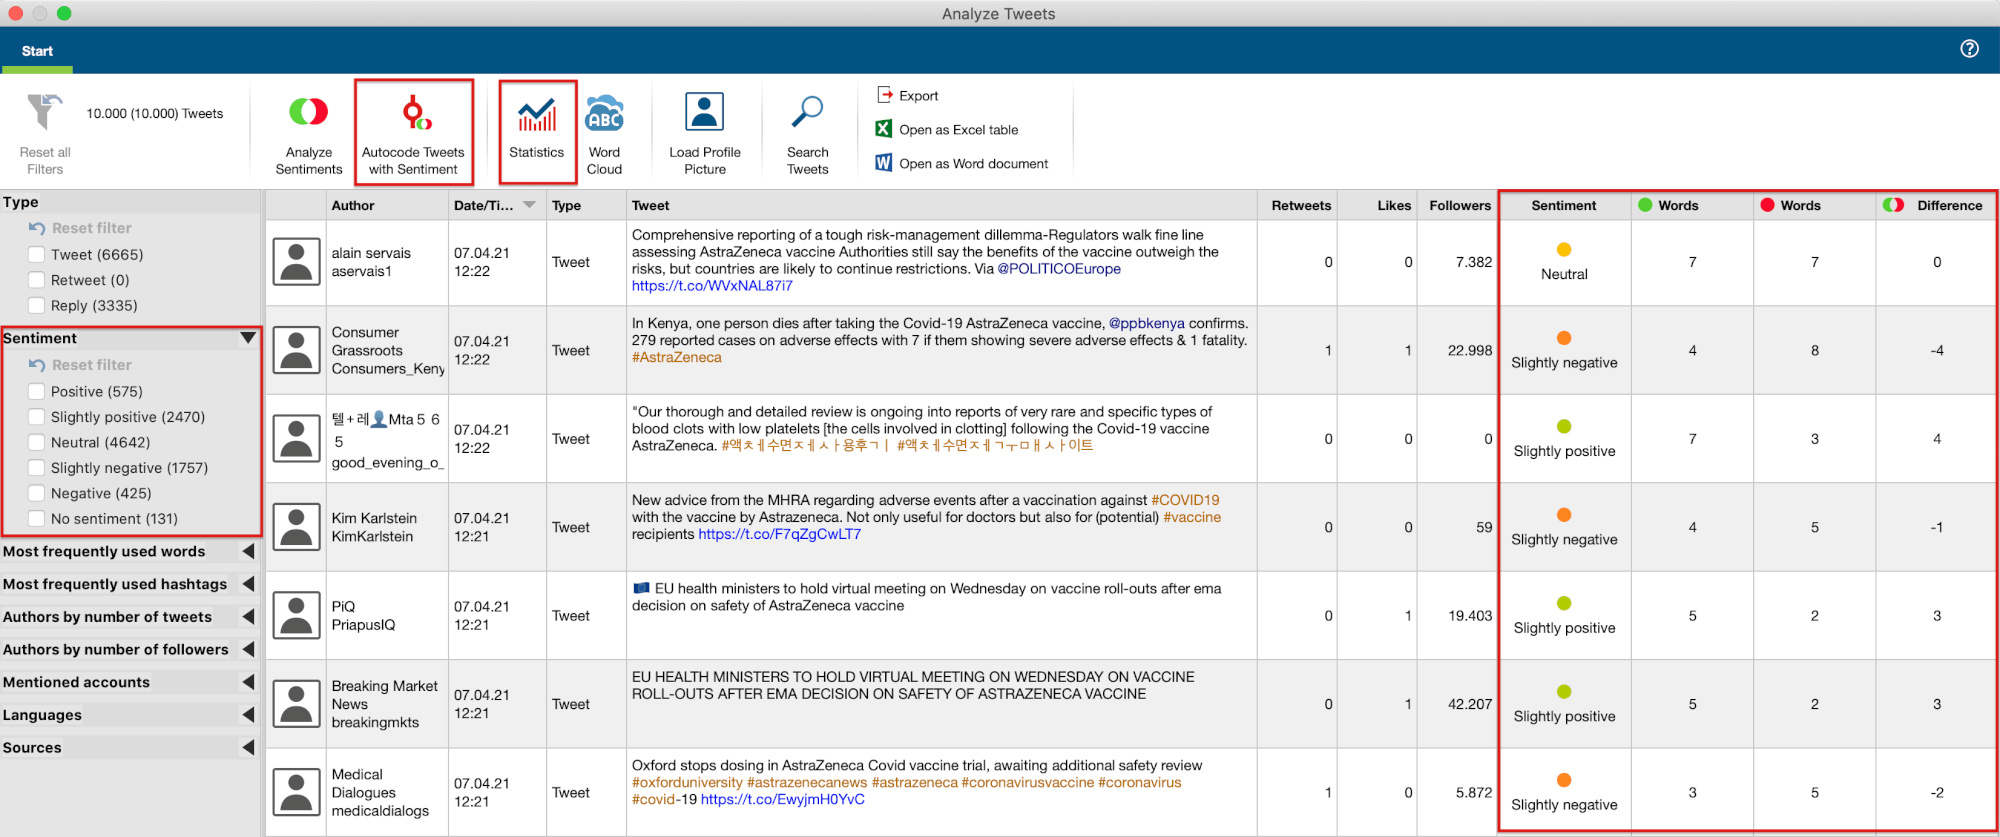
After performing the sentiment analysis, its results will appear on the right of your Twitter table and a new filter option Sentiment will be opened in the left part of the window. Here, you can adjust filtering options or enable sorting of the new sentiment columns by clicking on a column’s title.
 Analyze Tweets window with highlighted sentiment features.
Examine sentiment statistics
Before autocoding sentiment labels you may want to have a quick look at the statistics of your data’s sentiments. Go to Statistics and select Sentiment to show and customize the distribution of the sentiment labels. When you’re done, you can directly export the result graph or copy it to your clipboard.
In our example, we noted some sentiment labels which seemed incorrectly predicted that we will revise in the following steps.
Autocode sentiment labels
Now that you’re done with your sentiment analysis, you can click on Autocode Sentiments to add the sentiment codes to the code system of your project. The automatically created codes will appear in MAXQDA’s main window within a new parent code called Tweet Sentiment.
Hint: If you want to perform a sentiment analysis on multiple data sets within your project you should consider changing the name of the parent code Tweet Sentiment. Otherwise, upcoming sentiment autocodes will automatically be added to the currently existing autocode.
Optional: Revise your sentiment labels
Since sentiment analysis has its limitations, such as the correct evaluation of sarcasm and misspelled words, we will now revise and change some of the sentiment codes that do not fit our subjective opinion of the sentiment label certain tweets should have. One option to do this is via the Smart Coding Tool in the main MAXQDA window. Here you can drag and drop tweets to the desired subcode (in this case: sentiment label) and remove them from the current one.
 With the Smart Coding Tool you can easily edit coded segments.
Evaluate your results
For an evaluation of your findings you can either access the statistics of your dataset by opening Subcode Statistics and selecting Coded Segments as your unit of analysis, or directly within the Twitter analysis statistics before leaving the Analyze Tweets window.
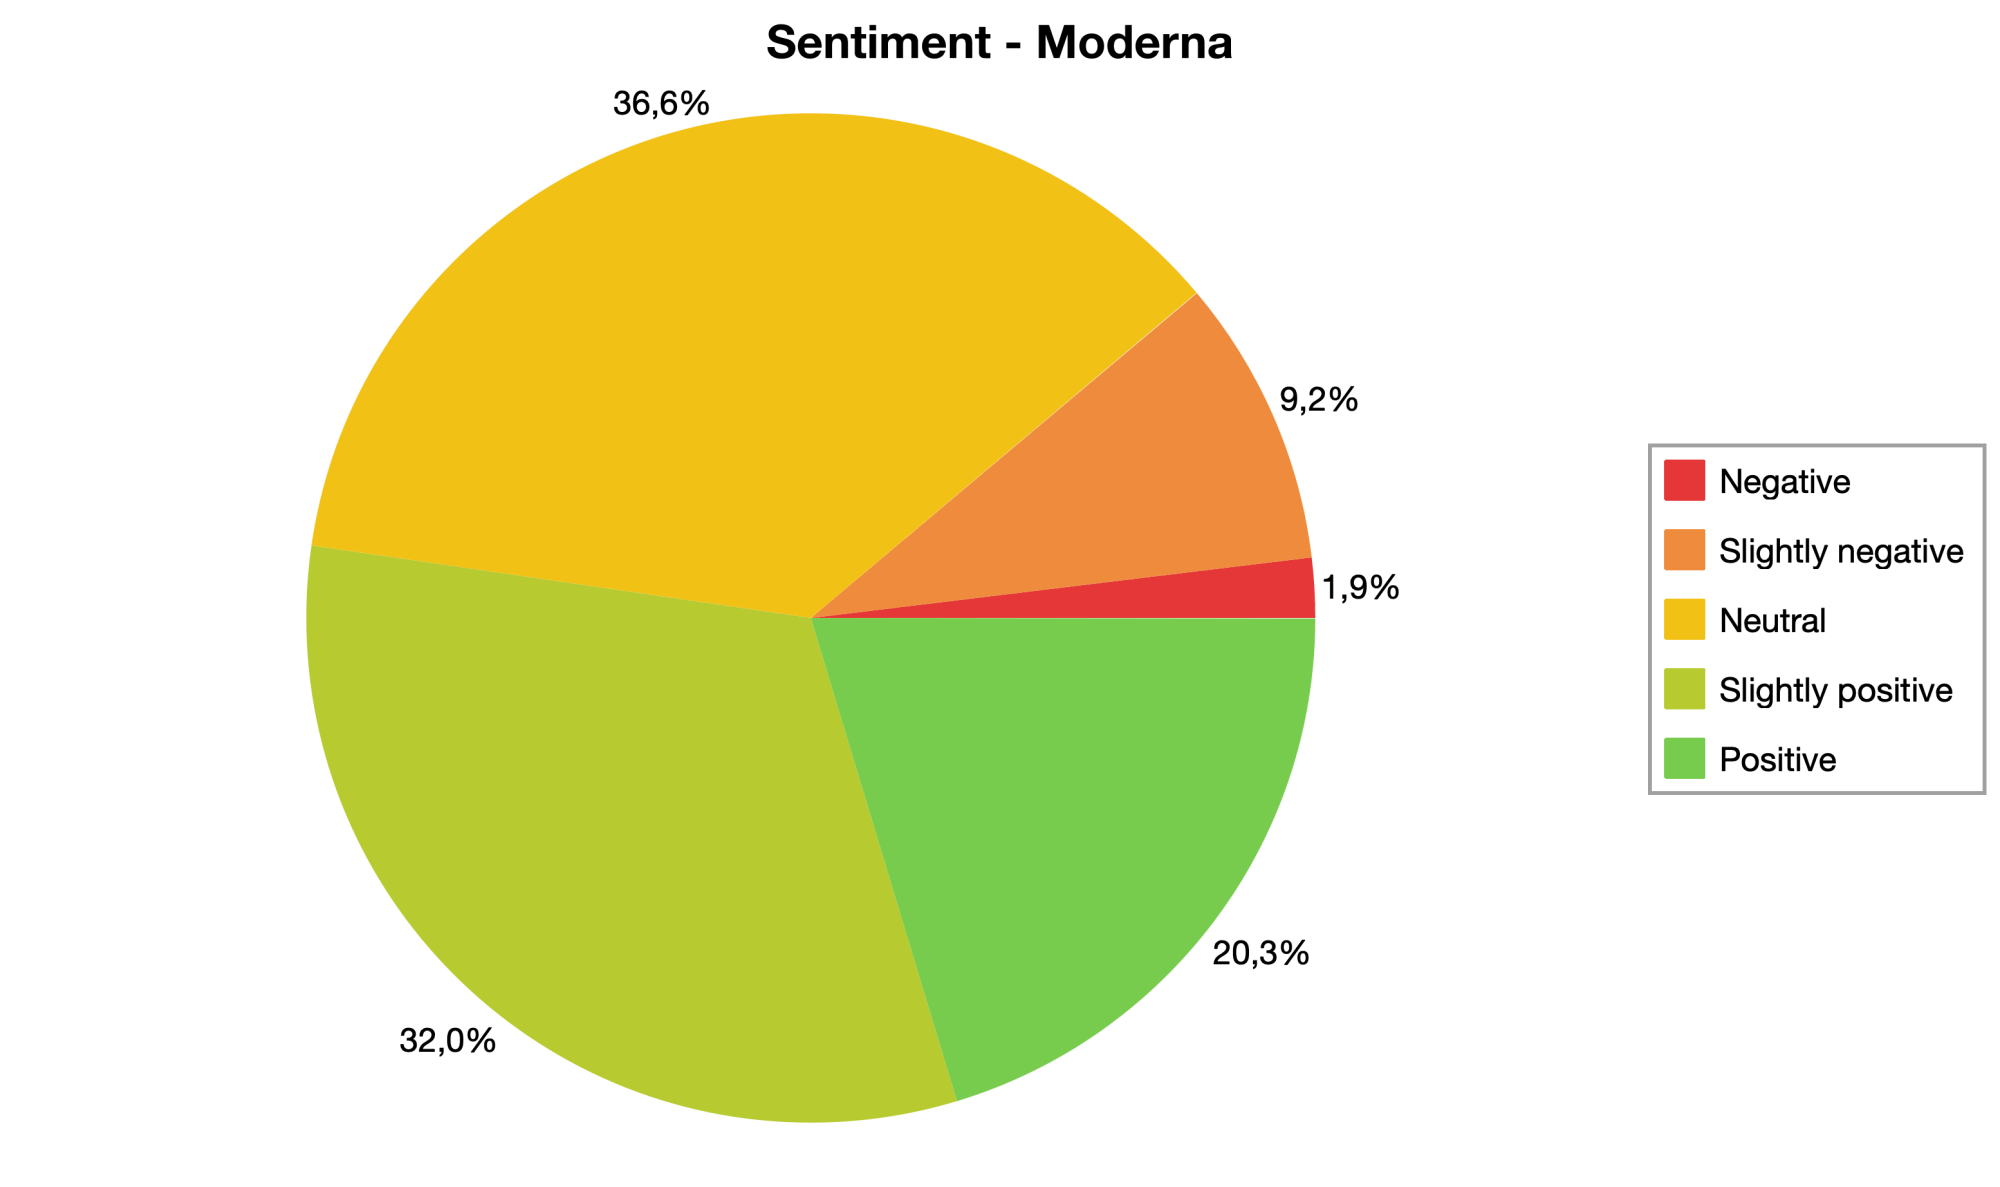
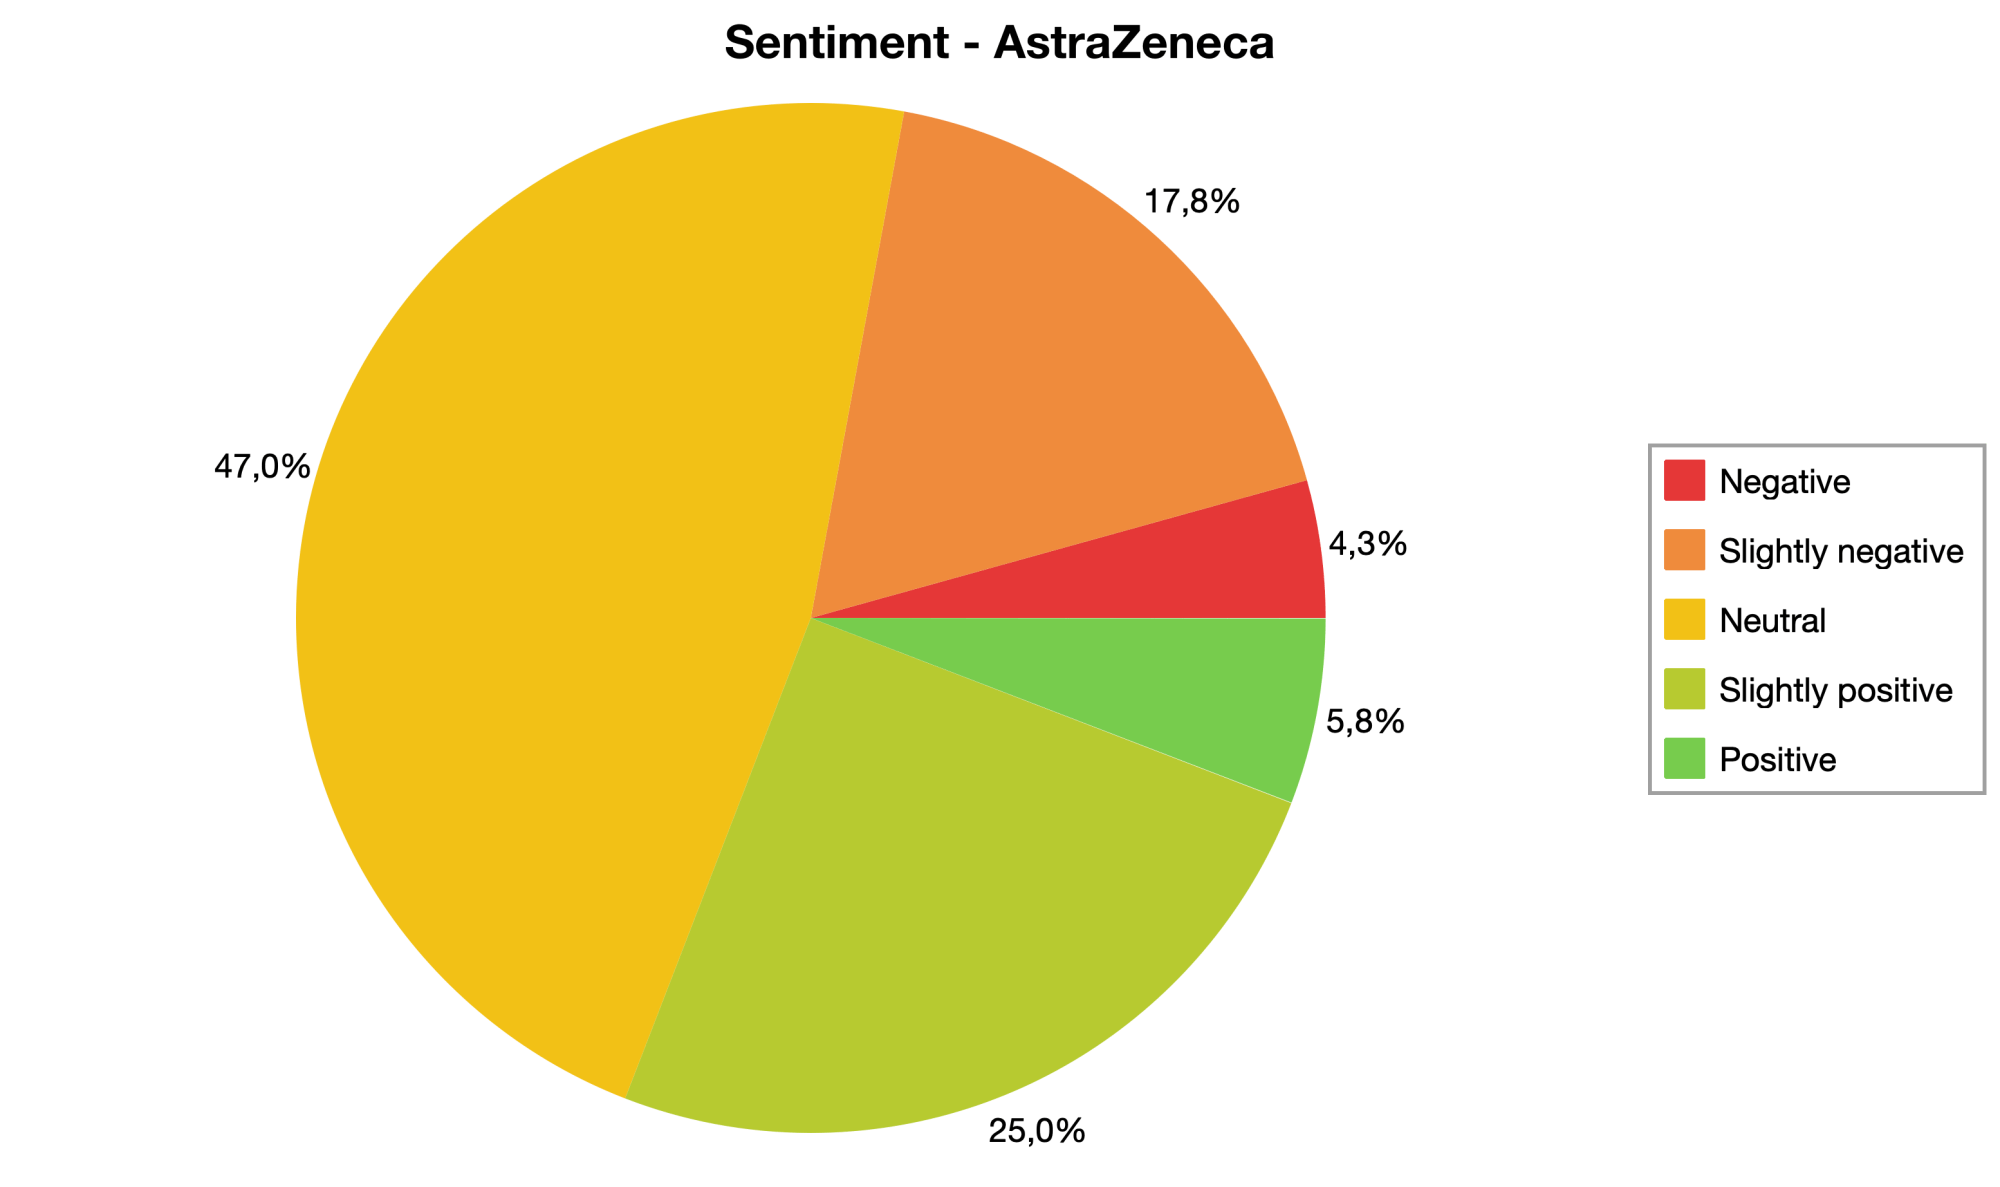
Our example shows that sentiment toward various COVID-19 vaccines differs slightly but notably. For instance, the Moderna vaccine seems to evoke the most positive emotions in the public with around 52% positively tagged tweets and only 11% negatively coded segments. In contrast, the AstraZeneca data set reveals around 30% positive sentiments and 22% negative tweets.
 Distribution of sentiment labels for Moderna data set.
 Distribution of sentiment labels for AstraZeneca data set.
Now that we have shown you how to construct and analyze your Twitter data with respect to sentiment you are welcome to create your own dataset using the Twitter import function and try out MAXQDA’s new sentiment features.
For more information and theoretical background about MAXQDA’s sentiment analysis, check the corresponding manual page here:
Twitter Sentiment Analysis in the MAXQDA Manual
Learn more about MAXQDA’s sentiment analysis in this video:


